| Param | Original file | Final file |
|---|---|---|
| Filename | modeM0/AS1A14_009T01_9000006534_55251cztM0_level2.fits | modeM0/AS1A14_009T01_9000006534_55251cztM0_level2_quad_clean.evt |
| Size (bytes) | 1,298,419,200 | 274,265,280 |
| Size | 1.2 GB | 261.6 MB |
| Events in quadrant A | 9,237,710 | 1,782,980 |
| Events in quadrant B | 10,038,852 | 1,861,415 |
| Events in quadrant C | 13,131,260 | 1,683,180 |
| Events in quadrant D | 14,115,745 | 1,606,984 |
| Mode SS | |||
|---|---|---|---|
| Quadrant | BADHDUFLAG | Total packets | Discarded packets |
| A | 0 | 400 | 0 |
| B | 0 | 400 | 0 |
| C | 0 | 400 | 0 |
| D | 0 | 400 | 0 |
| Mode M0 | |||
|---|---|---|---|
| Quadrant | BADHDUFLAG | Total packets | Discarded packets |
| A | 0 | 42904 | 2 |
| B | 0 | 45429 | 2 |
| C | 0 | 52843 | 2 |
| D | 0 | 54656 | 3 |
| Mode M9 | |||
|---|---|---|---|
| Quadrant | BADHDUFLAG | Total packets | Discarded packets |
| A | 0 | 10 | 0 |
| B | 0 | 10 | 0 |
| C | 0 | 10 | 0 |
| D | 0 | 10 | 0 |
| Quadrant | Total seconds | Saturated seconds | Saturation percentage |
|---|---|---|---|
| A | 19882 | 479 | 2.409214% |
| B | 19883 | 1087 | 5.466982% |
| C | 19883 | 942 | 4.737716% |
| D | 19882 | 725 | 3.646514% |
Noise dominated data is calculated using 1-second bins in cleaned event files. If a bin has >2000 counts, and if more than 50% of those come from <1% of pixels, then it is considered to be noise-dominated and hence unusable.
| Quadrant | # 1 sec bins | Bins with >0 counts | Bins with >2000 counts | High rate bins dominated by noise | Noise dominated (total time) | Noise dominated (detector-on time) | Marked lightcurve |
|---|---|---|---|---|---|---|---|
| A | 20792 | 19884 | 120 | 120 | 0.58% | 0.60% | 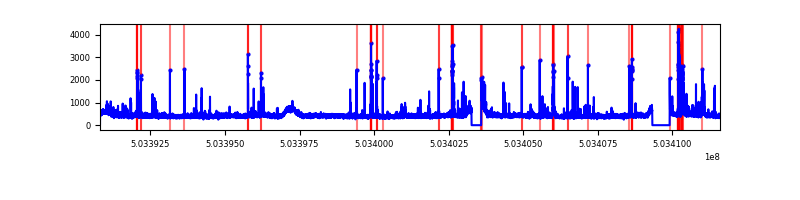 |
| B | 20793 | 19885 | 498 | 498 | 2.40% | 2.50% | 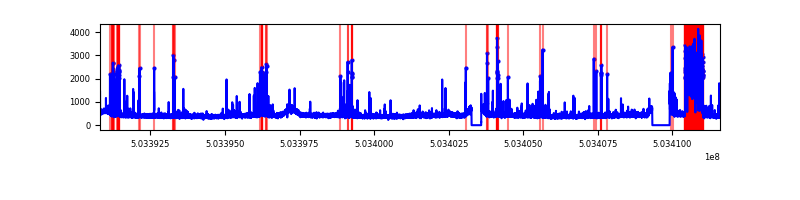 |
| C | 20793 | 19885 | 714 | 714 | 3.43% | 3.59% | 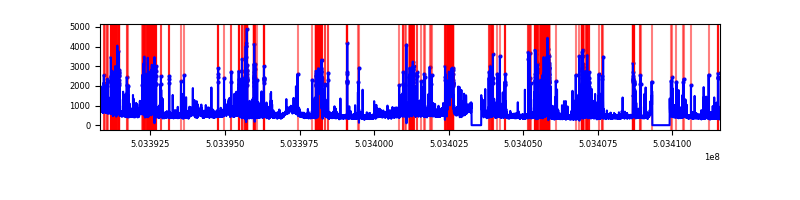 |
| D | 20792 | 19884 | 472 | 472 | 2.27% | 2.37% | 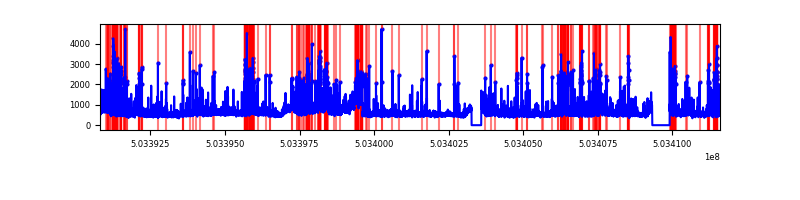 |
Top three noisy pixels from each quadrant. If the there are fewer than three noisy pixels in the level2.evt file, extra rows are filled as -1
| Pixel properties | Quadrant properties | ||||||
|---|---|---|---|---|---|---|---|
| Quadrant | DetID | PixID | Counts | Sigma | Mean | Median | Sigma |
| A | 0 | 8 | 384360 | 753.0 | 2095 | 2041 | 507.7 |
| A | 3 | 62 | 282170 | 551.73 | 2095 | 2041 | 507.7 |
| A | 12 | 115 | 118899 | 230.16 | 2095 | 2041 | 507.7 |
| B | 5 | 185 | 1486708 | 3422.66 | 2034 | 1956 | 433.8 |
| B | 2 | 249 | 260277 | 595.48 | 2034 | 1956 | 433.8 |
| B | 10 | 247 | 118746 | 269.23 | 2034 | 1956 | 433.8 |
| C | 1 | 16 | 1630540 | 2943.24 | 2025 | 2004 | 553.3 |
| C | 13 | 3 | 1199977 | 2165.09 | 2025 | 2004 | 553.3 |
| C | 15 | 147 | 706449 | 1273.14 | 2025 | 2004 | 553.3 |
| D | 5 | 38 | 2281456 | 4017.71 | 2031 | 1947 | 567.4 |
| D | 2 | 249 | 1083816 | 1906.83 | 2031 | 1947 | 567.4 |
| D | 8 | 160 | 812477 | 1428.58 | 2031 | 1947 | 567.4 |
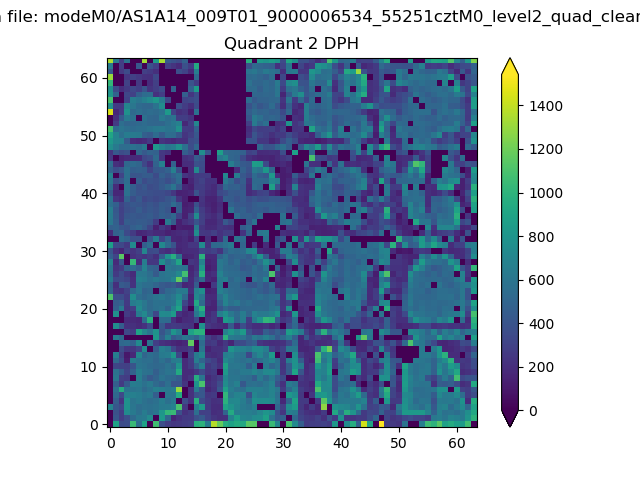
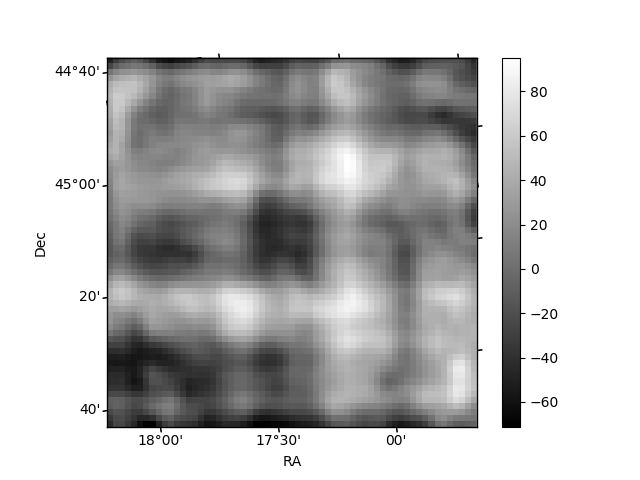
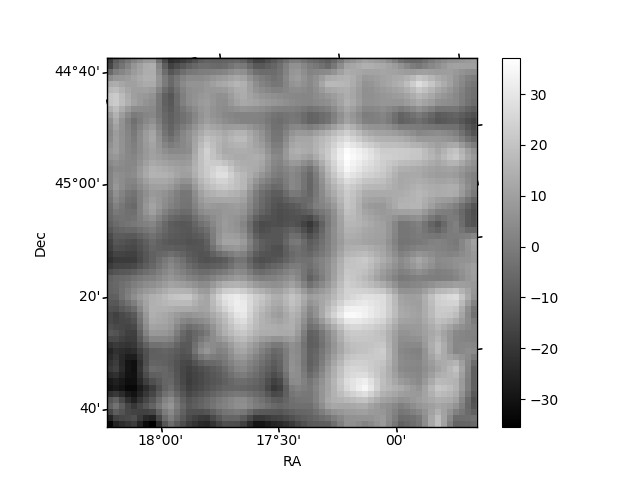
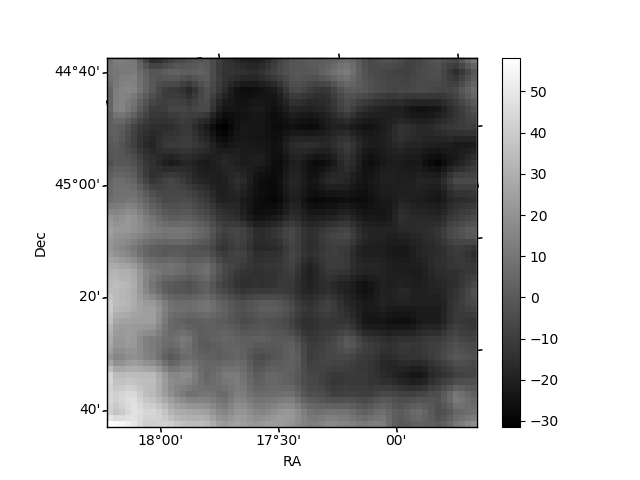
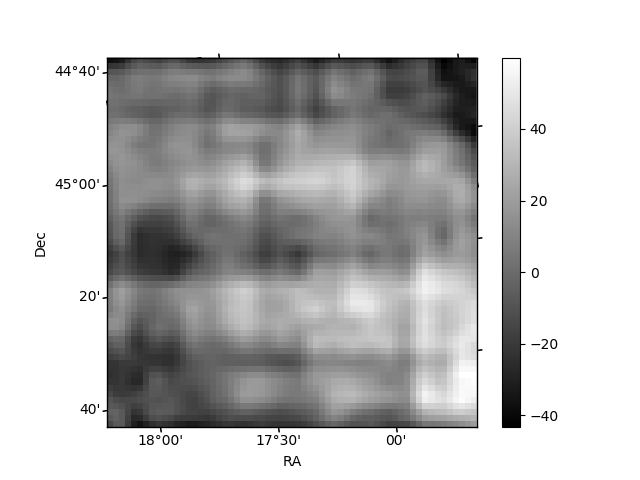
Histogram calculated using DETX and DETY for each event in the final _common_clean file
| Quadrant A | 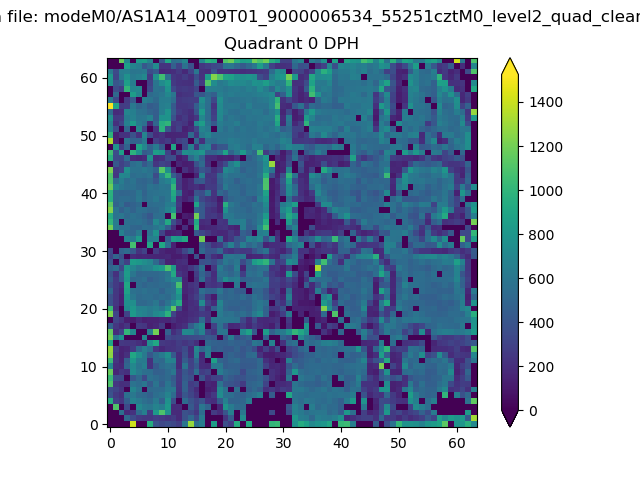 |
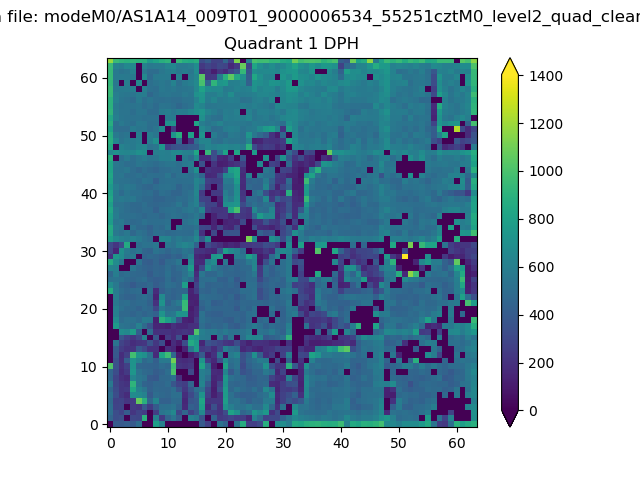 |
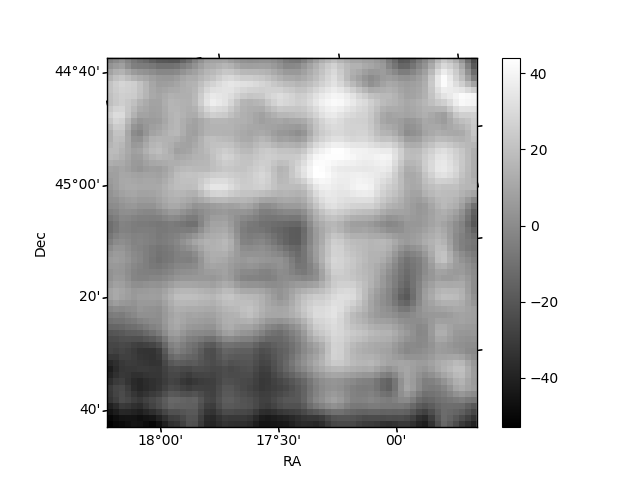
Quadrant B |
|---|---|---|---|
| Quadrant D | 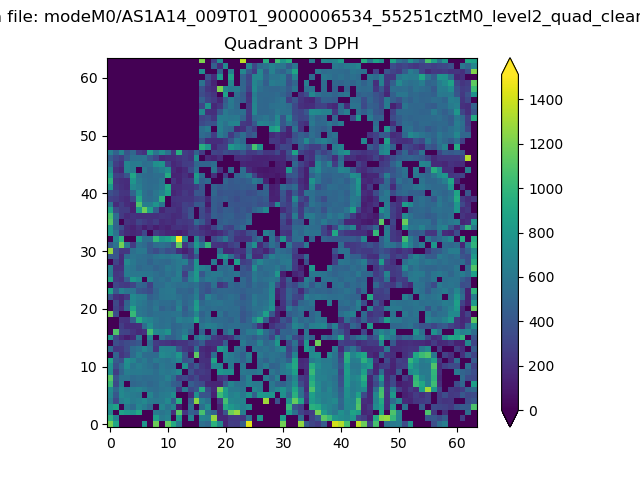 |
 |
Quadrant C |
| Plot type | Count rate plots | Images |
|---|---|---|
| Comparison with Poisson distribution Blue bars denote a histogram of data divided into 1 sec bins. Red curve is a Poisson curve with rate = median count rate of data. |
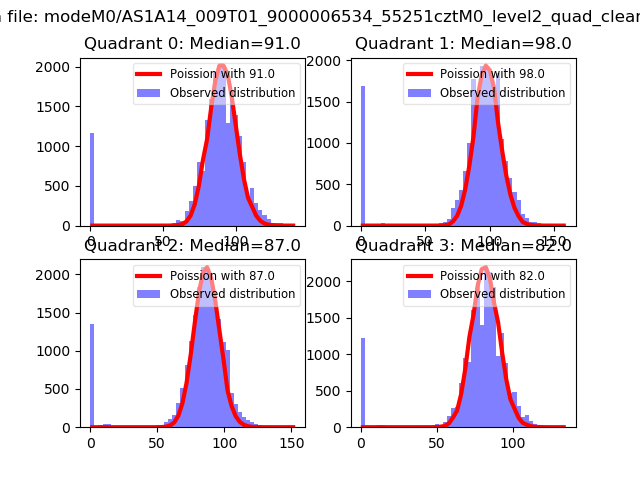 |
 |
| Quadrant-wise count rates Data is divided into 100 sec bins |
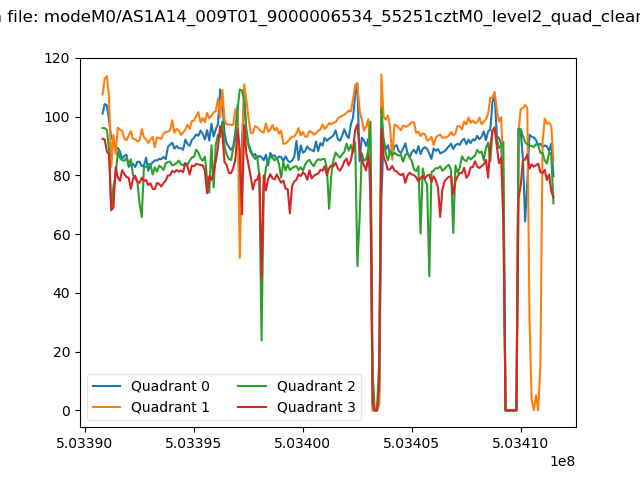 |
|
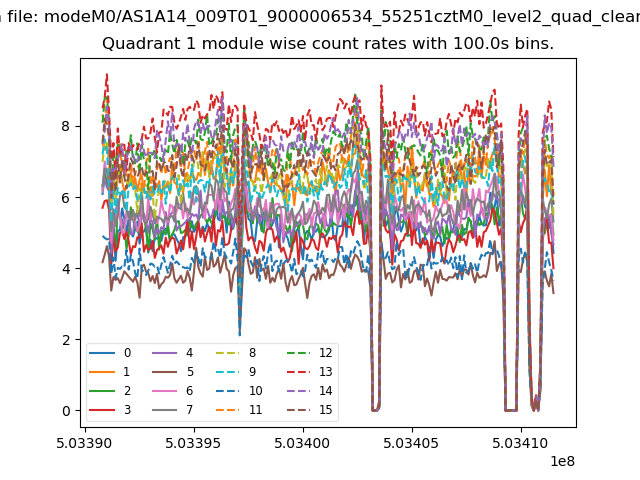
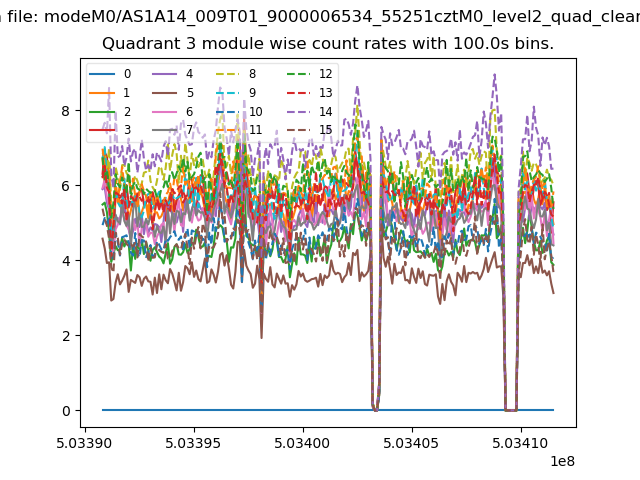
| Module-wise count rates for Quadrant A Data is divided into 100 sec bins |
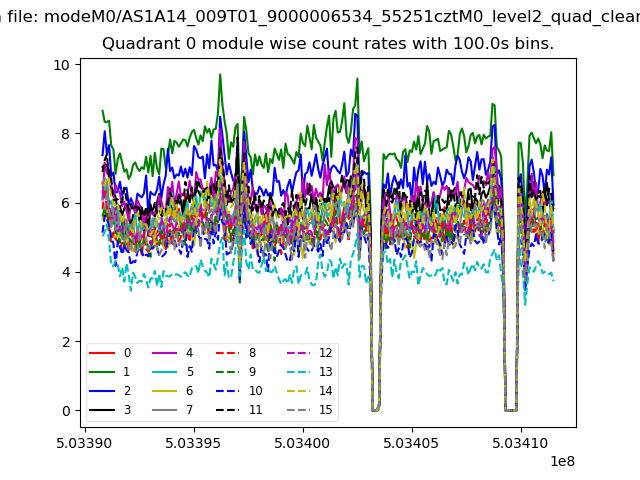 |
 |
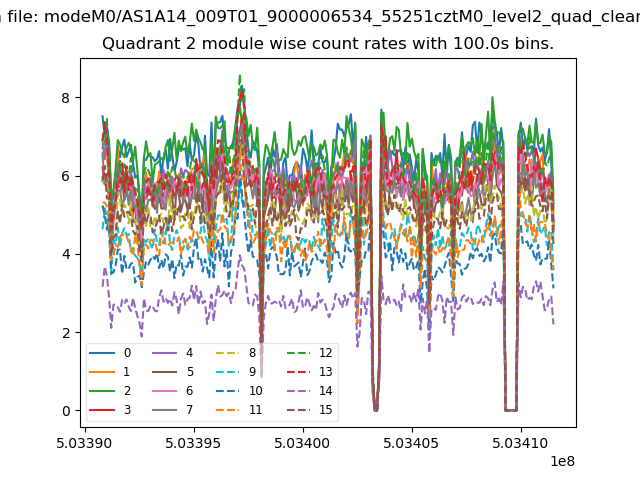
| Module-wise count rates for Quadrant B Data is divided into 100 sec bins |
 |
 |
| Module-wise count rates for Quadrant C Data is divided into 100 sec bins |
 |
 |
| Module-wise count rates for Quadrant D Data is divided into 100 sec bins |
 |
 |
| Parameter | Plot |
|---|---|
| CZT HV Monitor | 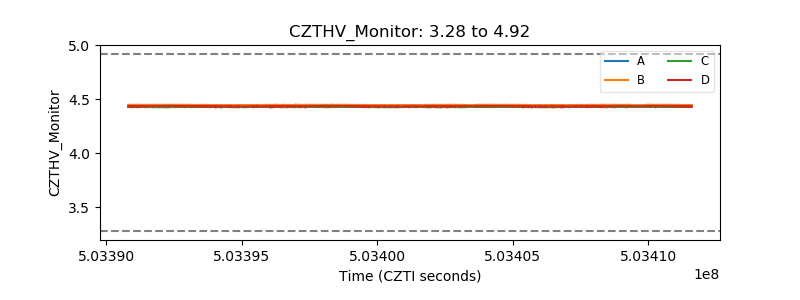 |
| D_VDD | 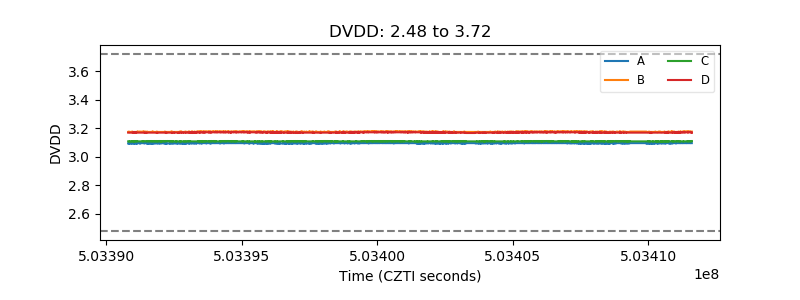 |
| Temperature 1 | 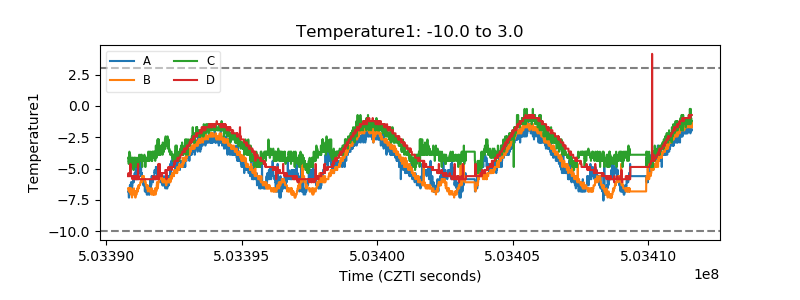 |
| Veto HV Monitor | 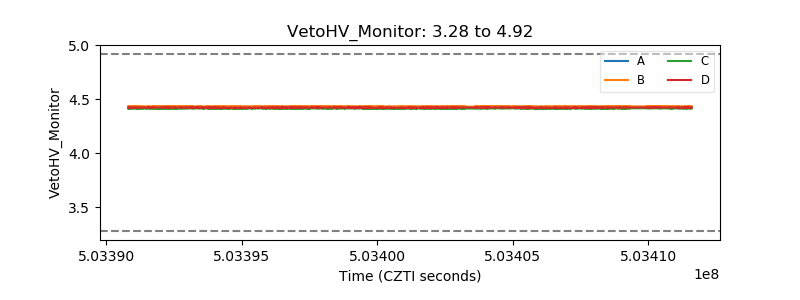 |
| Veto LLD | 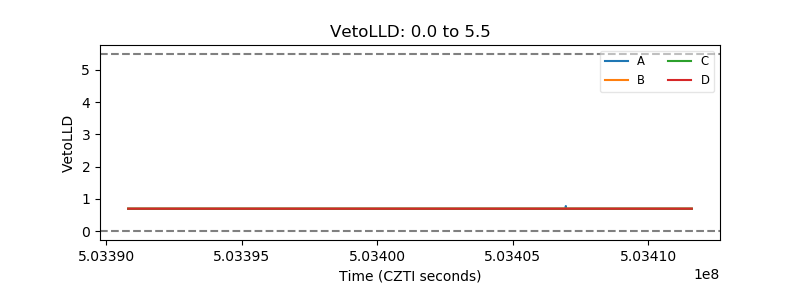 |
| Alpha Counter | 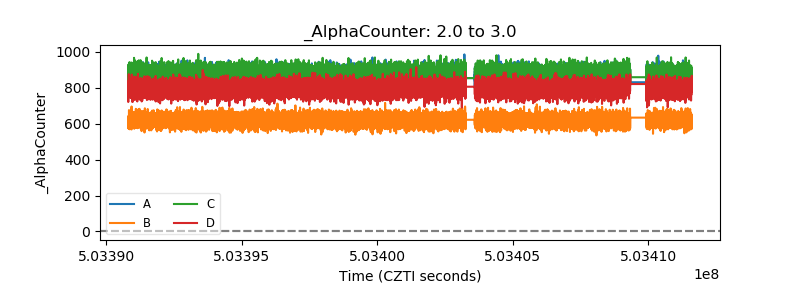 |
| _CPM_Rate | 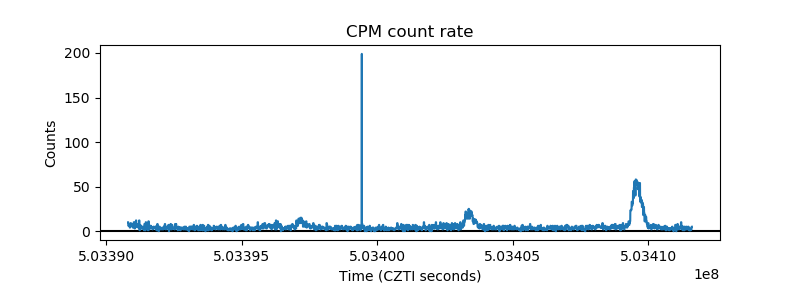 |
| CZT Counter | 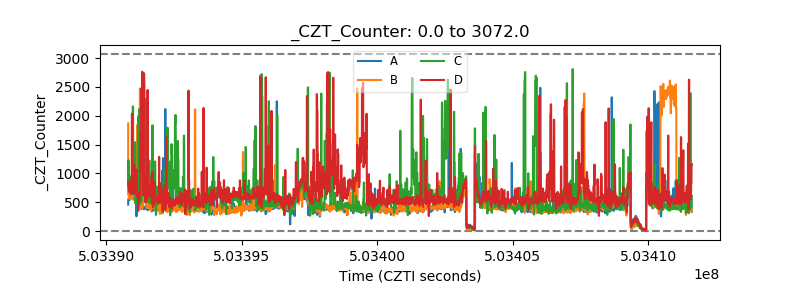 |
| +2.5 Volts monitor |  |
| +5 Volts monitor |  |
| _ROLL_ROT | 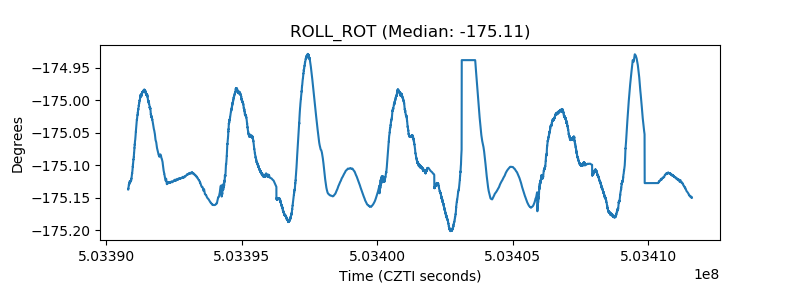 |
| _Roll_DEC | 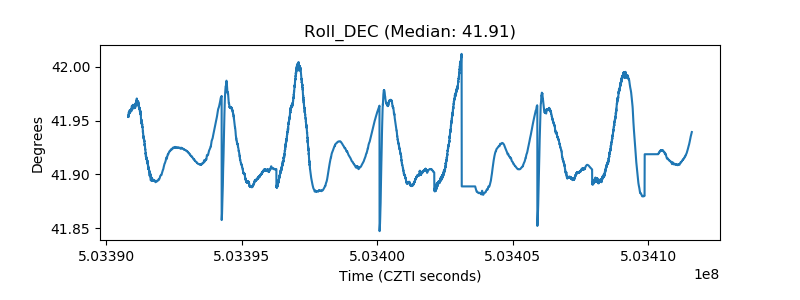 |
| _Roll_RA | 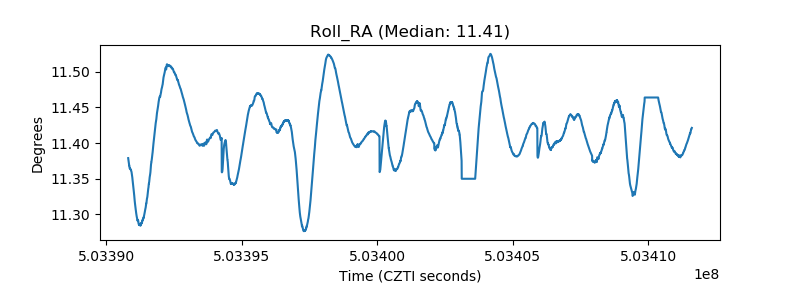 |
| Veto Counter | 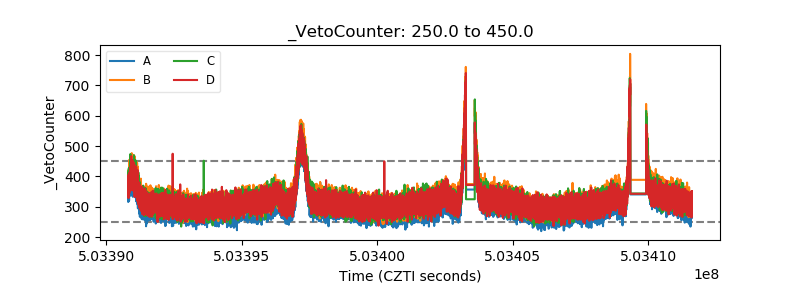 |