| Param | Original file | Final file |
|---|---|---|
| Filename | modeM0/AS1A14_009T01_9000006534_55252cztM0_level2.fits | modeM0/AS1A14_009T01_9000006534_55252cztM0_level2_quad_clean.evt |
| Size (bytes) | 455,549,760 | 94,536,000 |
| Size | 434.4 MB | 90.2 MB |
| Events in quadrant A | 3,435,282 | 621,924 |
| Events in quadrant B | 4,620,237 | 610,115 |
| Events in quadrant C | 3,442,034 | 597,859 |
| Events in quadrant D | 4,836,456 | 558,277 |
| Mode SS | |||
|---|---|---|---|
| Quadrant | BADHDUFLAG | Total packets | Discarded packets |
| A | 0 | 140 | 0 |
| B | 0 | 140 | 0 |
| C | 0 | 140 | 0 |
| D | 0 | 140 | 0 |
| Mode M0 | |||
|---|---|---|---|
| Quadrant | BADHDUFLAG | Total packets | Discarded packets |
| A | 0 | 15340 | 1 |
| B | 0 | 18942 | 1 |
| C | 0 | 15442 | 1 |
| D | 0 | 18687 | 1 |
| Mode M9 | |||
|---|---|---|---|
| Quadrant | BADHDUFLAG | Total packets | Discarded packets |
| A | 0 | 7 | 0 |
| B | 0 | 7 | 0 |
| C | 0 | 7 | 0 |
| D | 0 | 7 | 0 |
| Quadrant | Total seconds | Saturated seconds | Saturation percentage |
|---|---|---|---|
| A | 6799 | 157 | 2.309163% |
| B | 6799 | 726 | 10.678041% |
| C | 6800 | 150 | 2.205882% |
| D | 6800 | 211 | 3.102941% |
Noise dominated data is calculated using 1-second bins in cleaned event files. If a bin has >2000 counts, and if more than 50% of those come from <1% of pixels, then it is considered to be noise-dominated and hence unusable.
| Quadrant | # 1 sec bins | Bins with >0 counts | Bins with >2000 counts | High rate bins dominated by noise | Noise dominated (total time) | Noise dominated (detector-on time) | Marked lightcurve |
|---|---|---|---|---|---|---|---|
| A | 7544 | 6800 | 99 | 99 | 1.31% | 1.46% | 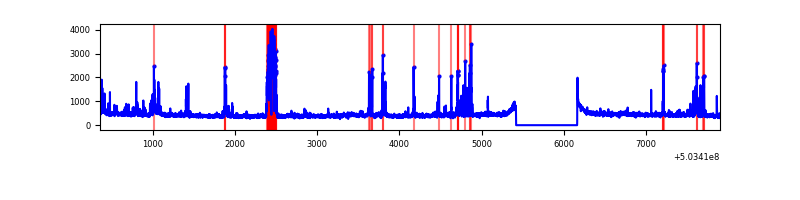 |
| B | 7544 | 6800 | 502 | 502 | 6.65% | 7.38% | 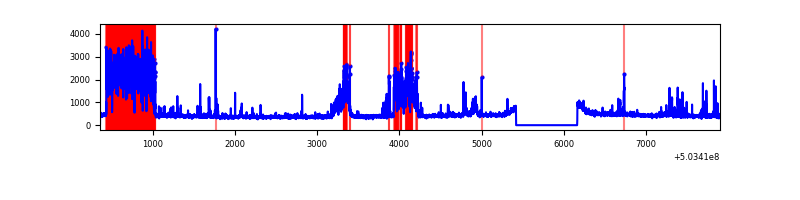 |
| C | 7545 | 6801 | 106 | 106 | 1.40% | 1.56% | 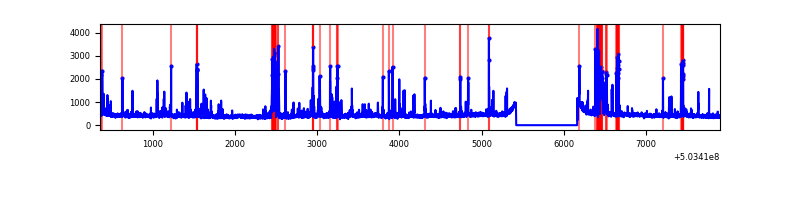 |
| D | 7545 | 6801 | 156 | 156 | 2.07% | 2.29% | 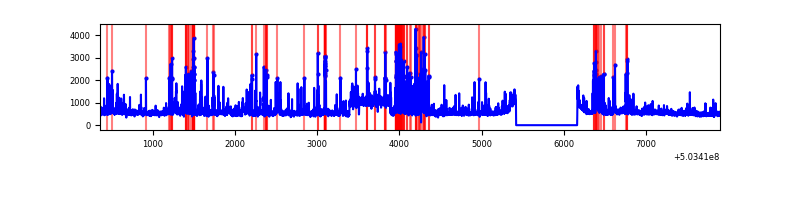 |
Top three noisy pixels from each quadrant. If the there are fewer than three noisy pixels in the level2.evt file, extra rows are filled as -1
| Pixel properties | Quadrant properties | ||||||
|---|---|---|---|---|---|---|---|
| Quadrant | DetID | PixID | Counts | Sigma | Mean | Median | Sigma |
| A | 3 | 62 | 329795 | 1870.42 | 708 | 689 | 176.0 |
| A | 0 | 8 | 229951 | 1302.97 | 708 | 689 | 176.0 |
| A | 3 | 45 | 33325 | 185.48 | 708 | 689 | 176.0 |
| B | 5 | 185 | 1293648 | 9088.02 | 660 | 635 | 142.3 |
| B | 2 | 249 | 579335 | 4067.43 | 660 | 635 | 142.3 |
| B | 0 | 182 | 39488 | 273.08 | 660 | 635 | 142.3 |
| C | 13 | 3 | 324150 | 1711.27 | 688 | 681 | 189.0 |
| C | 14 | 254 | 210597 | 1110.53 | 688 | 681 | 189.0 |
| C | 15 | 193 | 64102 | 335.52 | 688 | 681 | 189.0 |
| D | 5 | 38 | 1158475 | 5964.77 | 688 | 660 | 194.1 |
| D | 2 | 249 | 359127 | 1846.73 | 688 | 660 | 194.1 |
| D | 2 | 31 | 135951 | 696.98 | 688 | 660 | 194.1 |
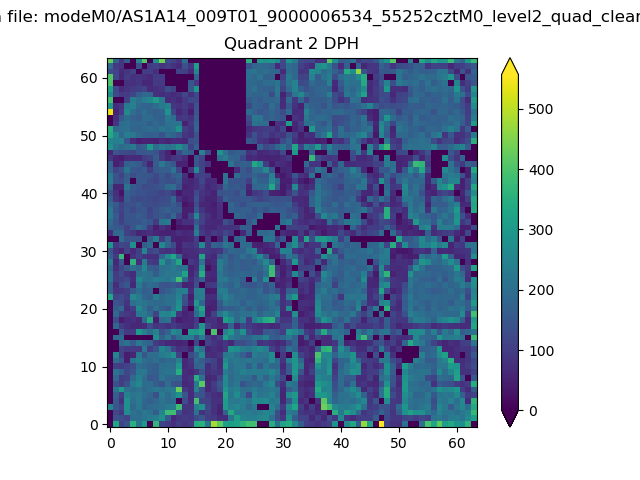
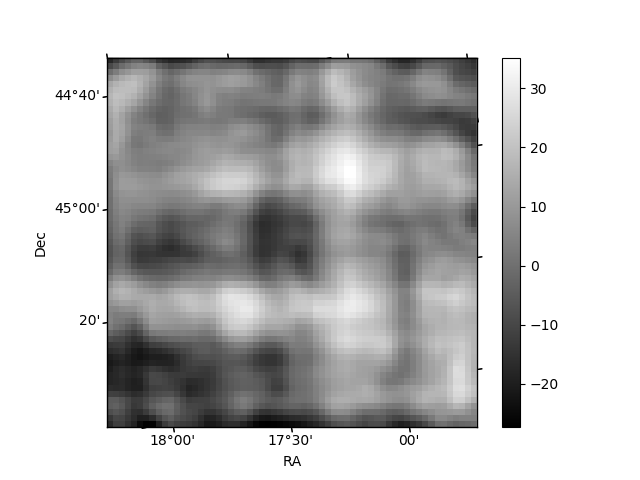
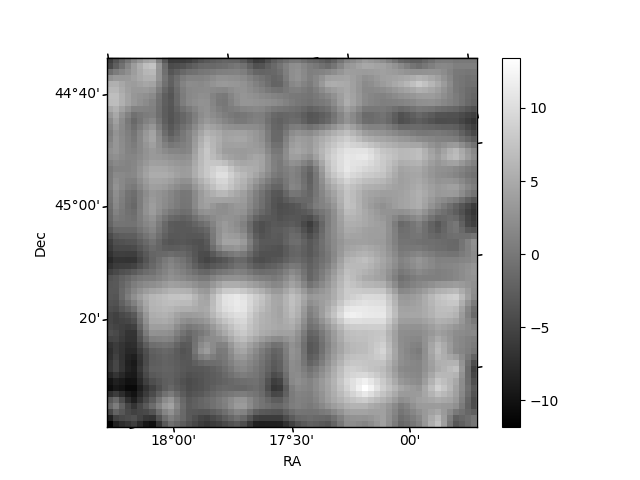
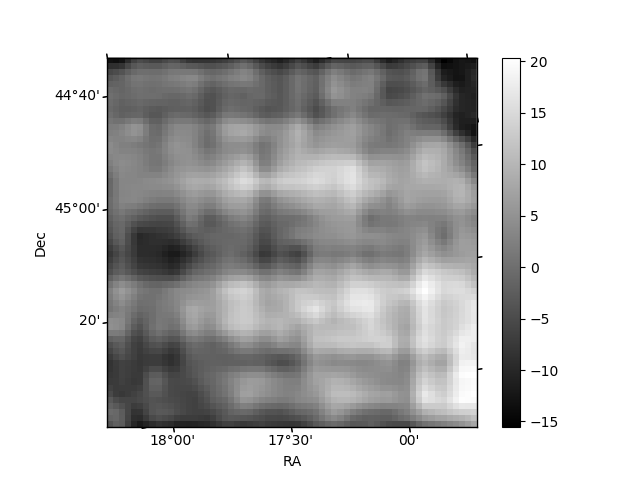
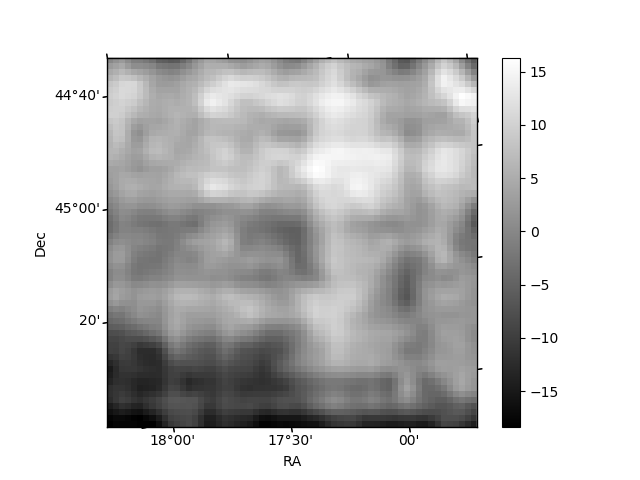
Histogram calculated using DETX and DETY for each event in the final _common_clean file
| Quadrant A | 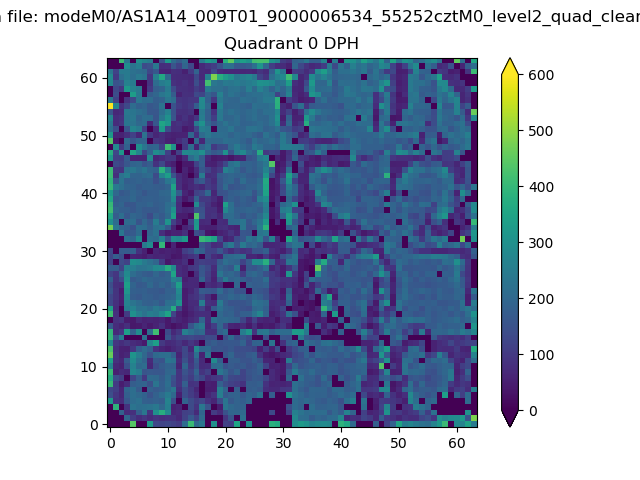 |
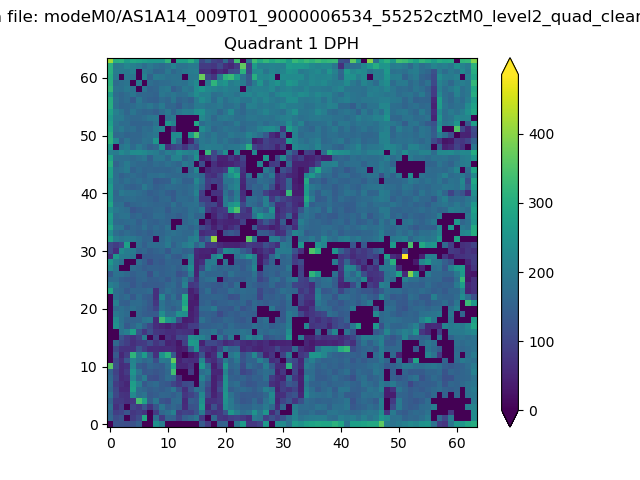 |
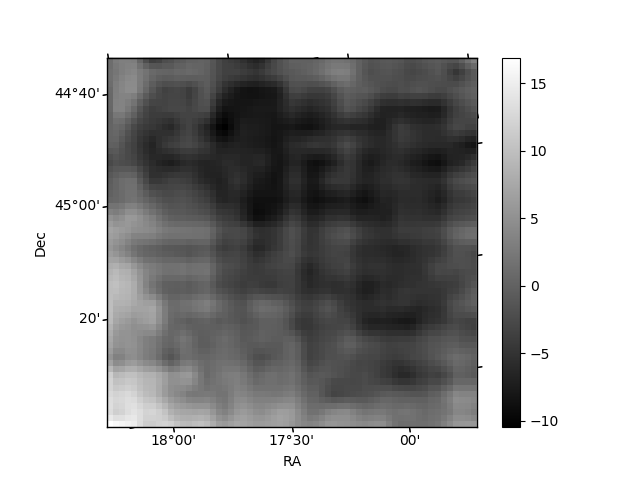
Quadrant B |
|---|---|---|---|
| Quadrant D | 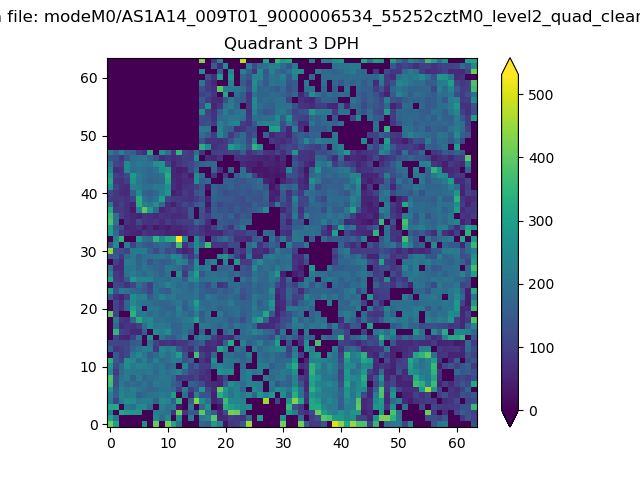 |
 |
Quadrant C |
| Plot type | Count rate plots | Images |
|---|---|---|
| Comparison with Poisson distribution Blue bars denote a histogram of data divided into 1 sec bins. Red curve is a Poisson curve with rate = median count rate of data. |
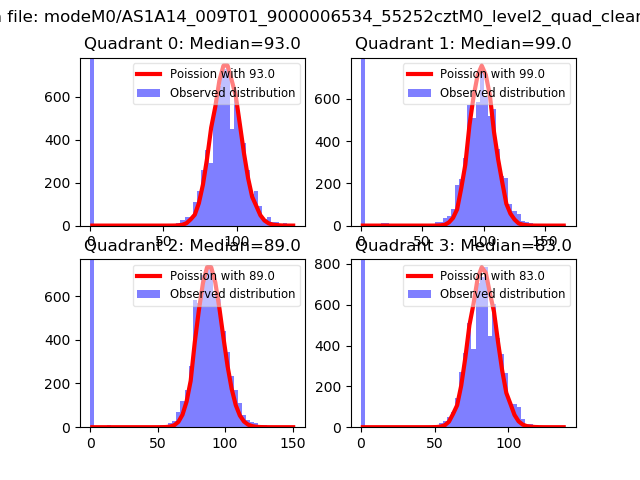 |
 |
| Quadrant-wise count rates Data is divided into 100 sec bins |
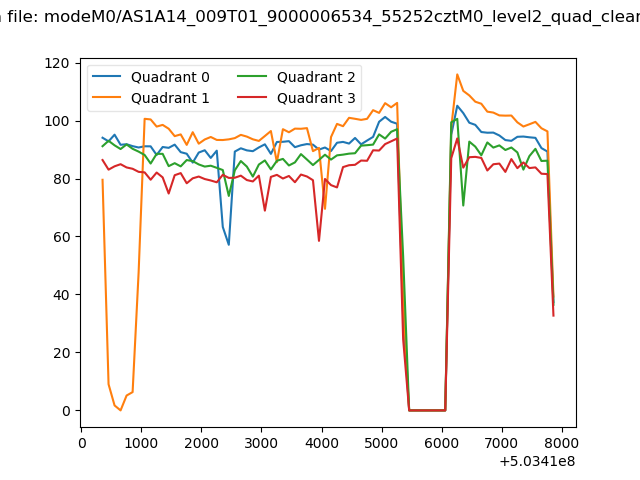 |
|
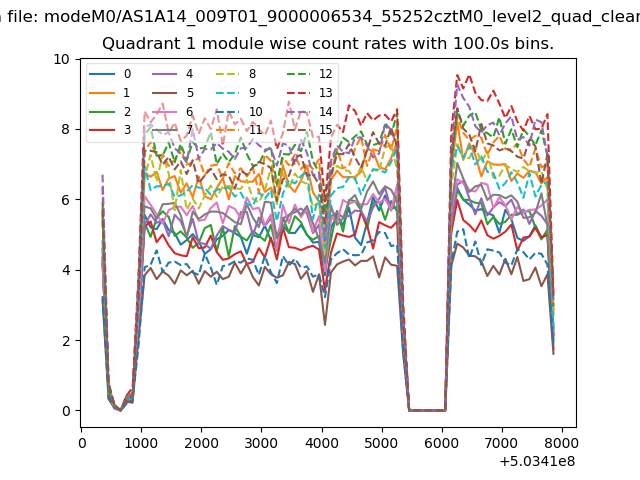
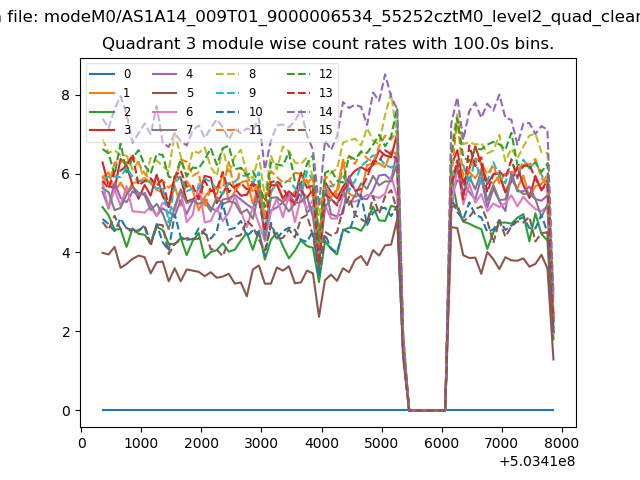
| Module-wise count rates for Quadrant A Data is divided into 100 sec bins |
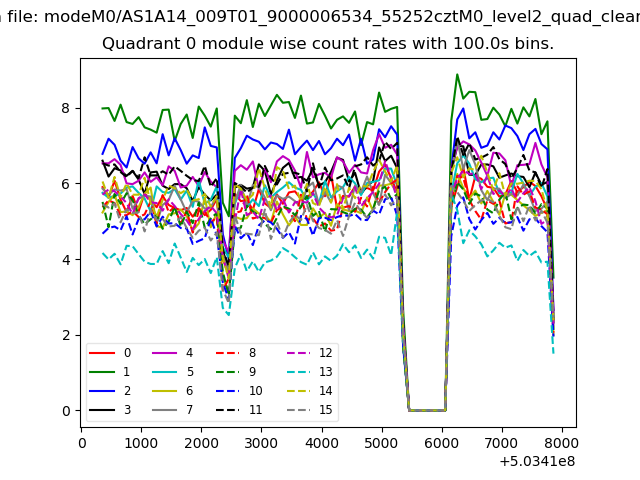 |
 |
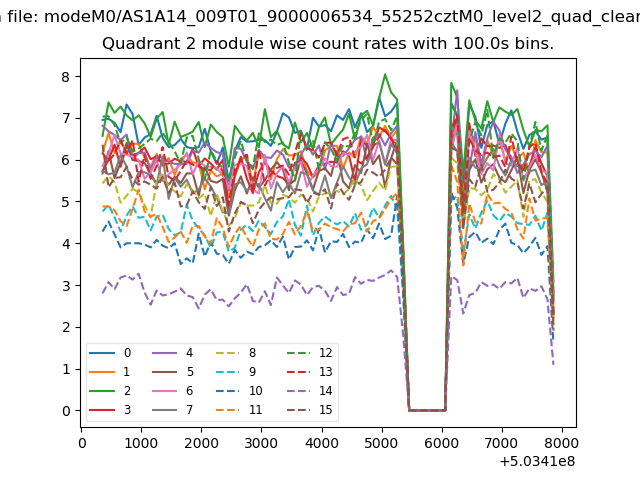
| Module-wise count rates for Quadrant B Data is divided into 100 sec bins |
 |
 |
| Module-wise count rates for Quadrant C Data is divided into 100 sec bins |
 |
 |
| Module-wise count rates for Quadrant D Data is divided into 100 sec bins |
 |
 |
| Parameter | Plot |
|---|---|
| CZT HV Monitor | 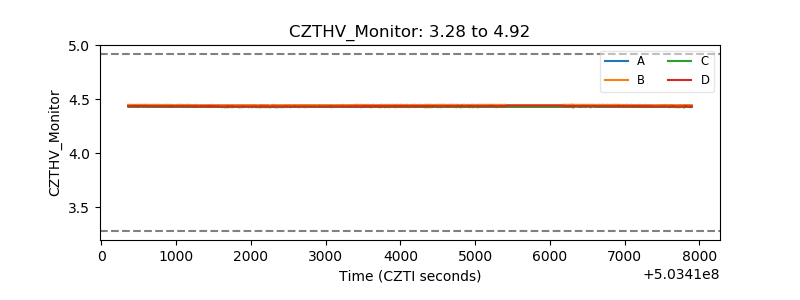 |
| D_VDD | 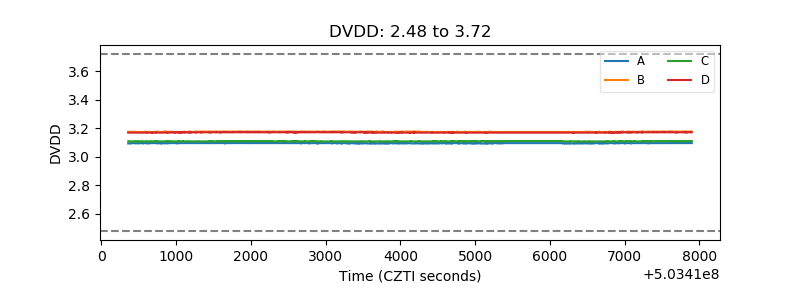 |
| Temperature 1 | 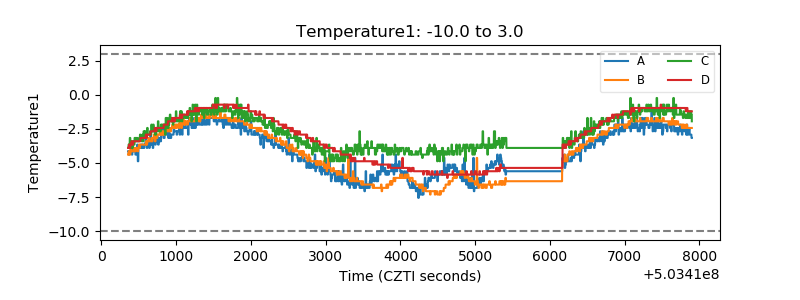 |
| Veto HV Monitor | 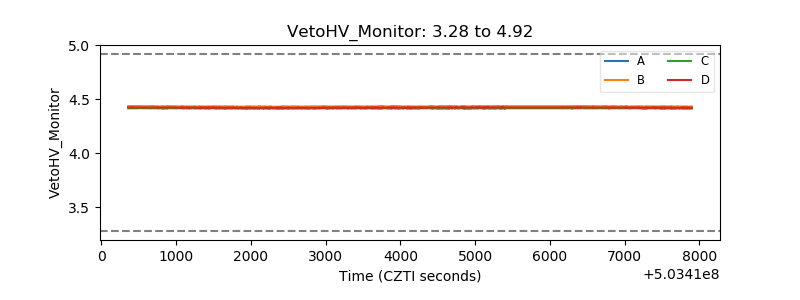 |
| Veto LLD | 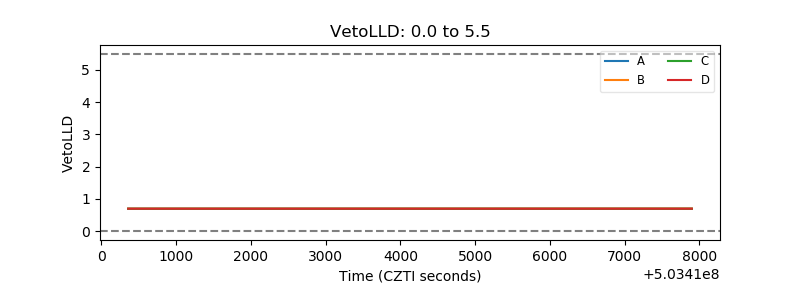 |
| Alpha Counter | 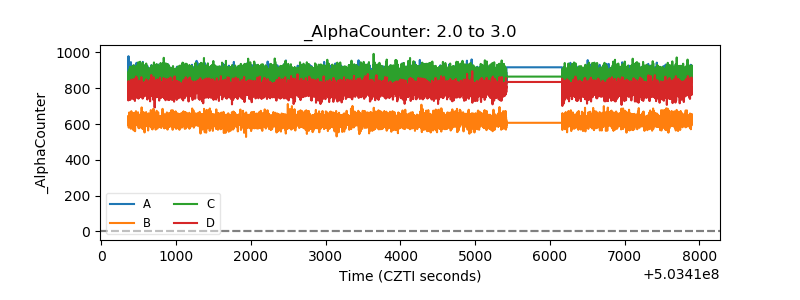 |
| _CPM_Rate | 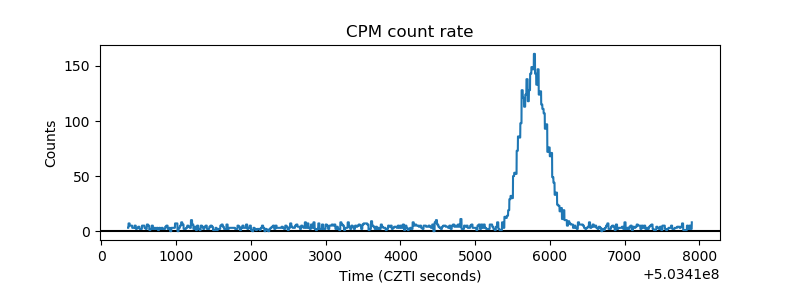 |
| CZT Counter | 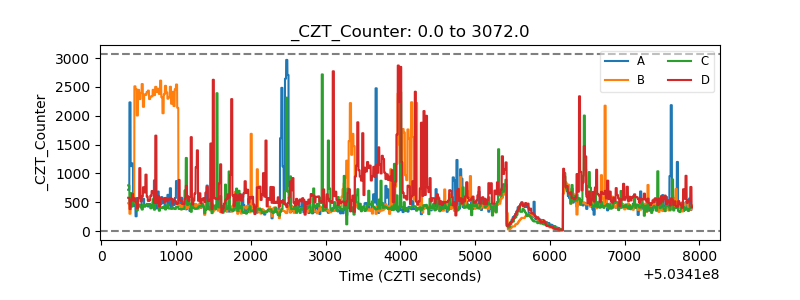 |
| +2.5 Volts monitor | 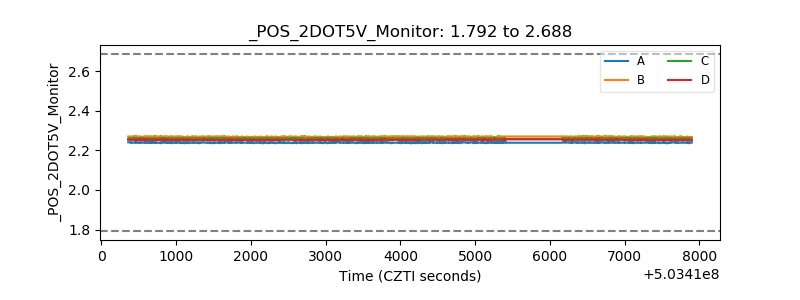 |
| +5 Volts monitor | 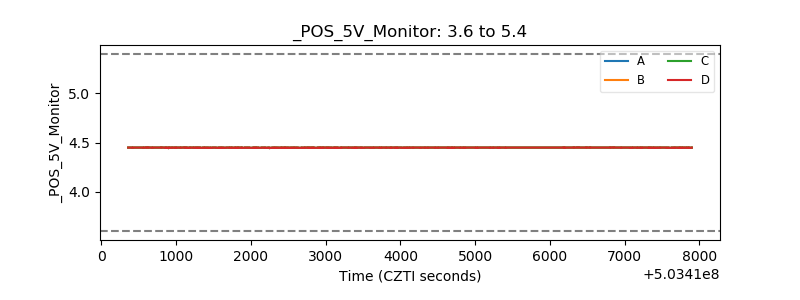 |
| _ROLL_ROT | 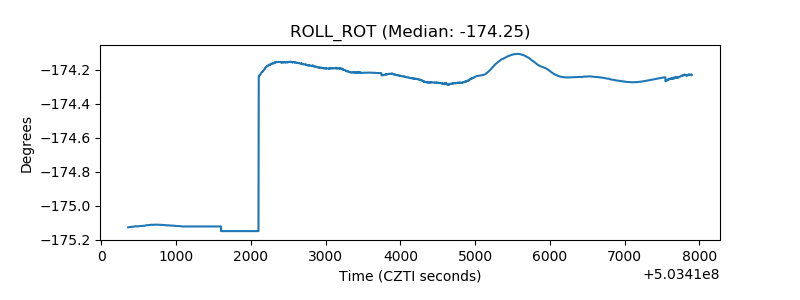 |
| _Roll_DEC | 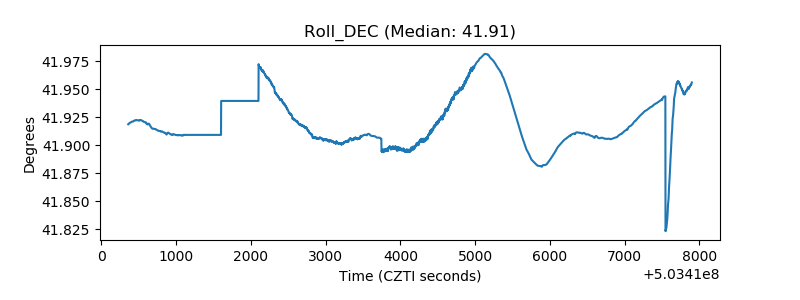 |
| _Roll_RA | 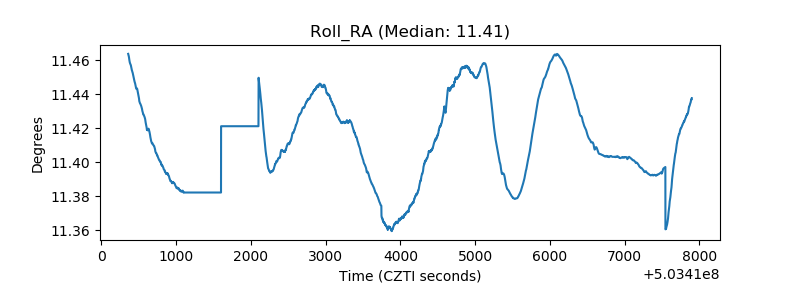 |
| Veto Counter | 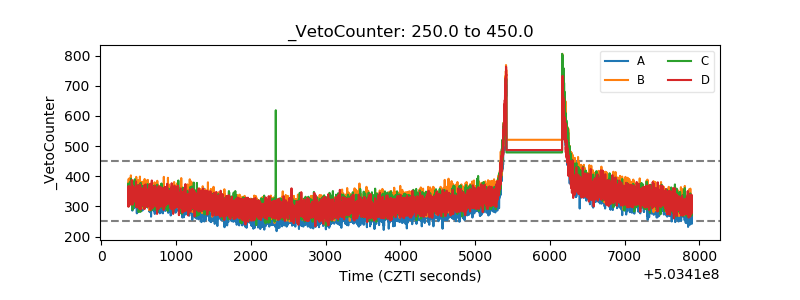 |