| Param | Original file | Final file |
|---|---|---|
| Filename | modeM0/AS1A14_009T01_9000006534_55255cztM0_level2.fits | modeM0/AS1A14_009T01_9000006534_55255cztM0_level2_quad_clean.evt |
| Size (bytes) | 414,872,640 | 99,123,840 |
| Size | 395.7 MB | 94.5 MB |
| Events in quadrant A | 3,136,342 | 650,008 |
| Events in quadrant B | 3,107,213 | 696,507 |
| Events in quadrant C | 5,273,118 | 595,917 |
| Events in quadrant D | 3,314,160 | 587,729 |
| Mode SS | |||
|---|---|---|---|
| Quadrant | BADHDUFLAG | Total packets | Discarded packets |
| A | 0 | 136 | 0 |
| B | 0 | 136 | 0 |
| C | 0 | 136 | 0 |
| D | 0 | 136 | 0 |
| Mode M0 | |||
|---|---|---|---|
| Quadrant | BADHDUFLAG | Total packets | Discarded packets |
| A | 0 | 14463 | 2 |
| B | 0 | 14255 | 2 |
| C | 0 | 20412 | 2 |
| D | 0 | 14743 | 2 |
| Mode M9 | |||
|---|---|---|---|
| Quadrant | BADHDUFLAG | Total packets | Discarded packets |
| A | 0 | 13 | 0 |
| B | 0 | 14 | 0 |
| C | 0 | 14 | 0 |
| D | 0 | 14 | 0 |
| Quadrant | Total seconds | Saturated seconds | Saturation percentage |
|---|---|---|---|
| A | 6766 | 75 | 1.108484% |
| B | 6765 | 77 | 1.138211% |
| C | 6765 | 451 | 6.666667% |
| D | 6765 | 61 | 0.901700% |
Noise dominated data is calculated using 1-second bins in cleaned event files. If a bin has >2000 counts, and if more than 50% of those come from <1% of pixels, then it is considered to be noise-dominated and hence unusable.
| Quadrant | # 1 sec bins | Bins with >0 counts | Bins with >2000 counts | High rate bins dominated by noise | Noise dominated (total time) | Noise dominated (detector-on time) | Marked lightcurve |
|---|---|---|---|---|---|---|---|
| A | 7821 | 6767 | 38 | 38 | 0.49% | 0.56% | 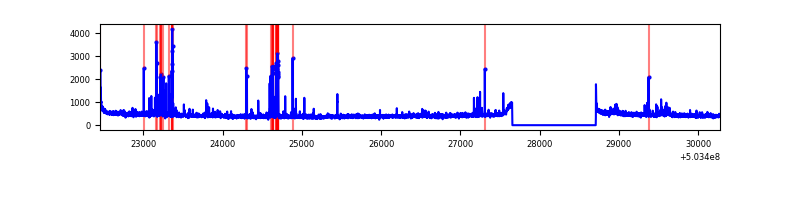 |
| B | 7820 | 6766 | 21 | 21 | 0.27% | 0.31% | 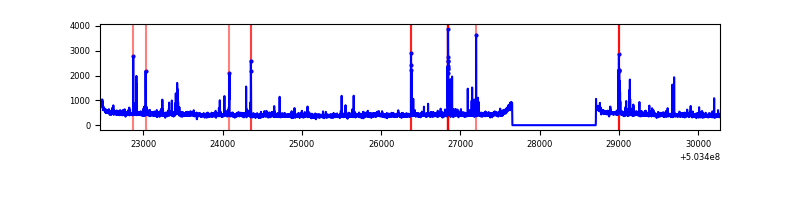 |
| C | 7820 | 6766 | 339 | 339 | 4.34% | 5.01% | 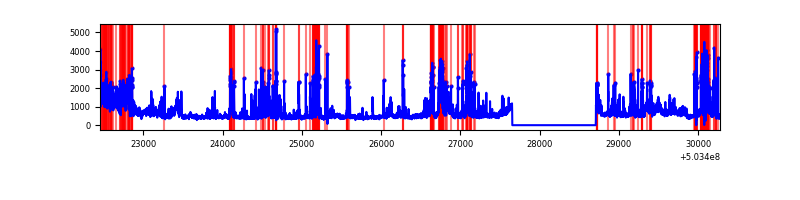 |
| D | 7820 | 6766 | 29 | 29 | 0.37% | 0.43% | 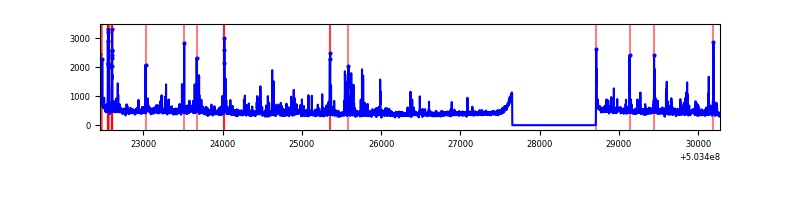 |
Top three noisy pixels from each quadrant. If the there are fewer than three noisy pixels in the level2.evt file, extra rows are filled as -1
| Pixel properties | Quadrant properties | ||||||
|---|---|---|---|---|---|---|---|
| Quadrant | DetID | PixID | Counts | Sigma | Mean | Median | Sigma |
| A | 0 | 8 | 180755 | 1024.15 | 716 | 698 | 175.8 |
| A | 7 | 14 | 68192 | 383.9 | 716 | 698 | 175.8 |
| A | 3 | 14 | 29855 | 165.84 | 716 | 698 | 175.8 |
| B | 10 | 247 | 78870 | 511.56 | 705 | 680 | 152.8 |
| B | 7 | 0 | 73217 | 474.57 | 705 | 680 | 152.8 |
| B | 0 | 182 | 50551 | 326.28 | 705 | 680 | 152.8 |
| C | 13 | 3 | 1906032 | 10211.89 | 680 | 672 | 186.6 |
| C | 1 | 16 | 248720 | 1329.43 | 680 | 672 | 186.6 |
| C | 10 | 22 | 148158 | 790.46 | 680 | 672 | 186.6 |
| D | 7 | 129 | 123235 | 619.9 | 700 | 671 | 197.7 |
| D | 3 | 12 | 102222 | 513.62 | 700 | 671 | 197.7 |
| D | 2 | 249 | 76941 | 385.75 | 700 | 671 | 197.7 |
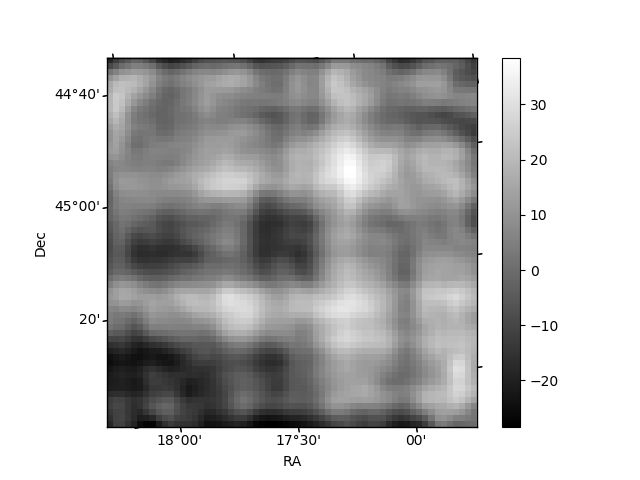
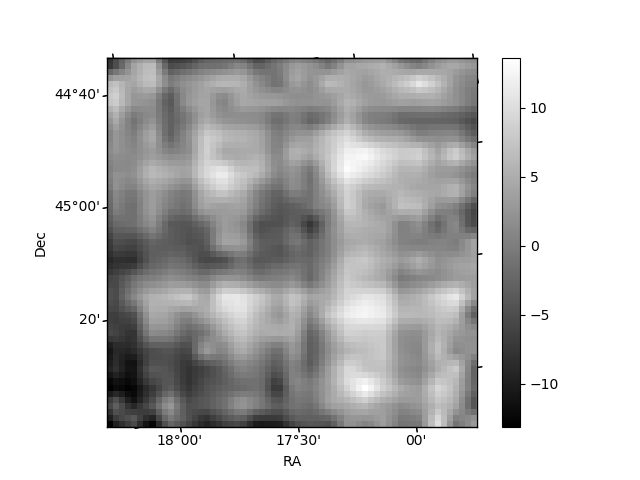
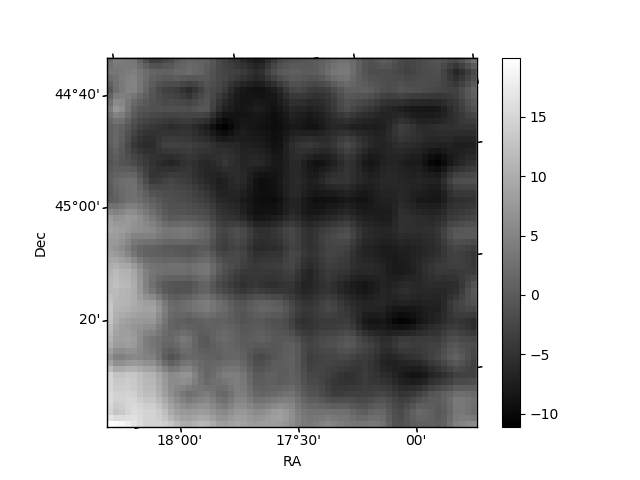
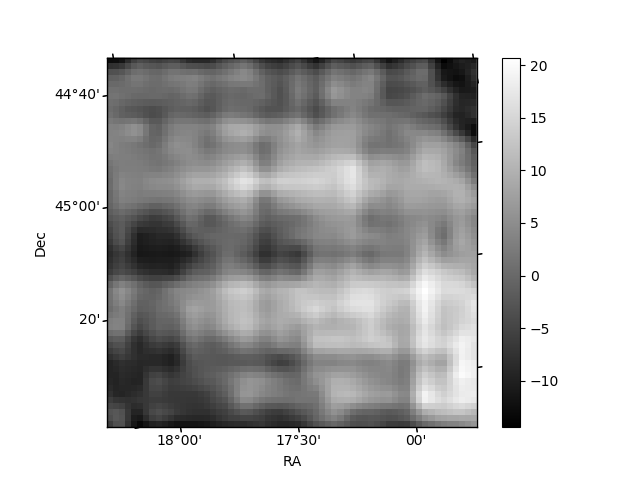
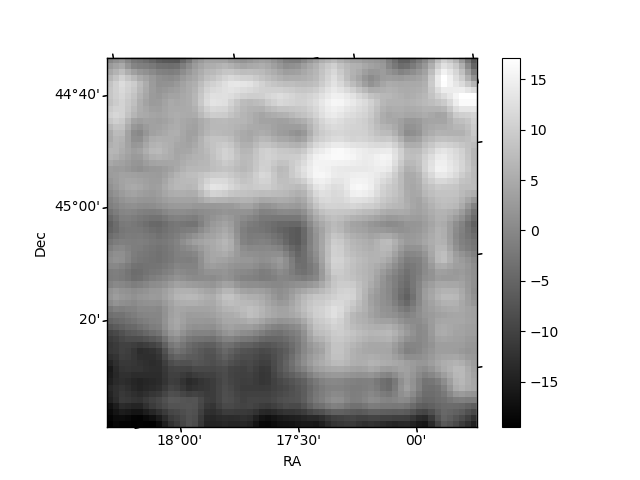
Histogram calculated using DETX and DETY for each event in the final _common_clean file
| Quadrant A | 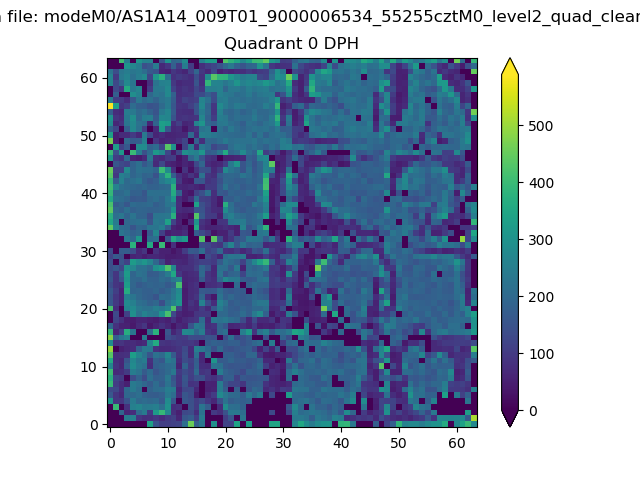 |
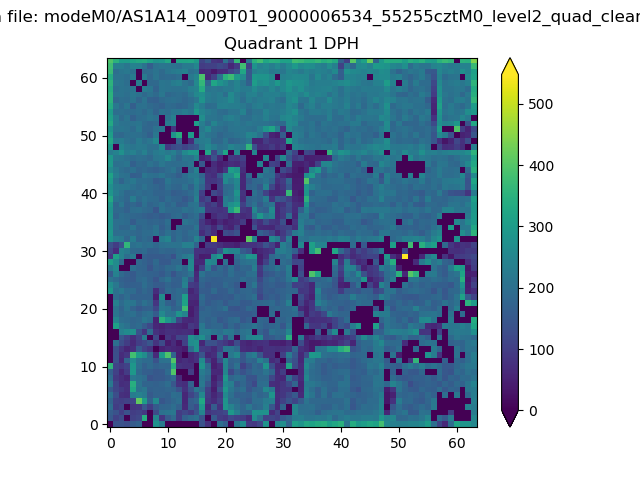 |
Quadrant B |
|---|---|---|---|
| Quadrant D | 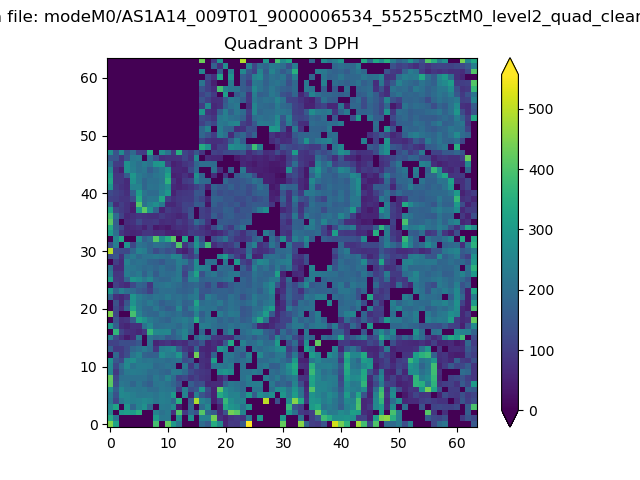 |
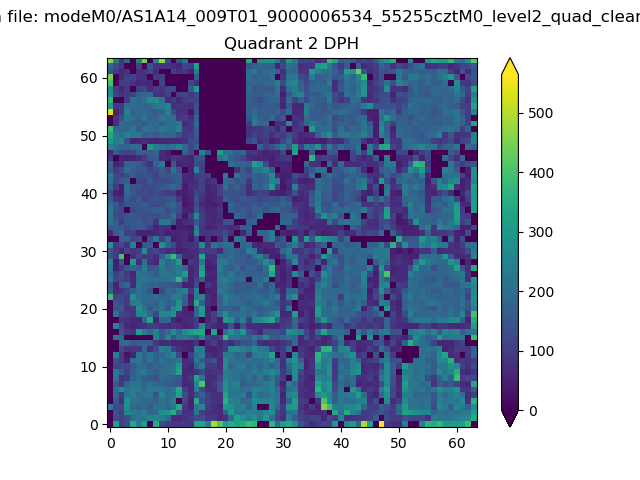 |
Quadrant C |
| Plot type | Count rate plots | Images |
|---|---|---|
| Comparison with Poisson distribution Blue bars denote a histogram of data divided into 1 sec bins. Red curve is a Poisson curve with rate = median count rate of data. |
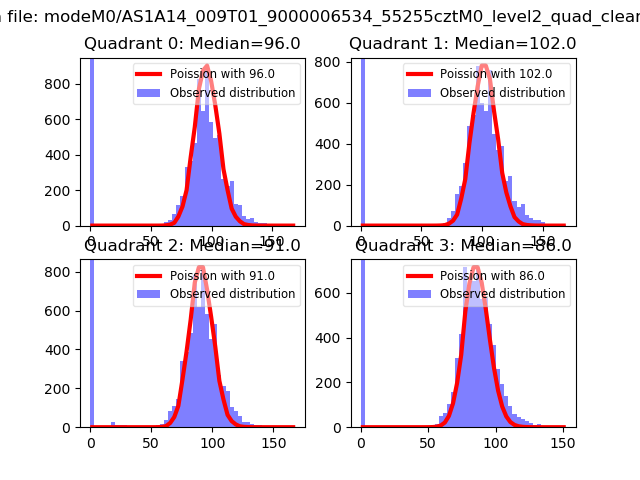 |
 |
| Quadrant-wise count rates Data is divided into 100 sec bins |
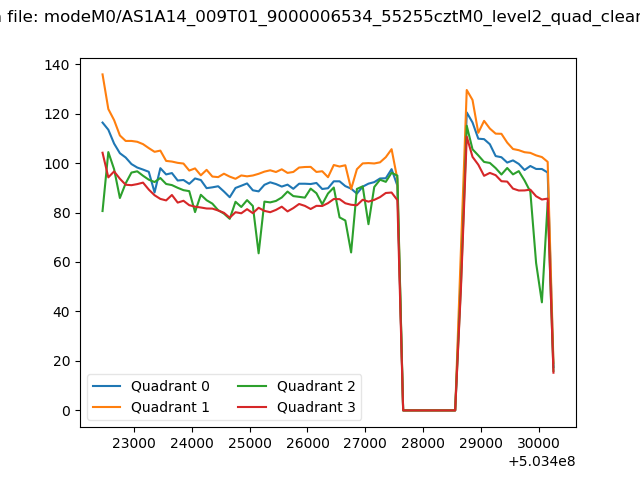 |
|
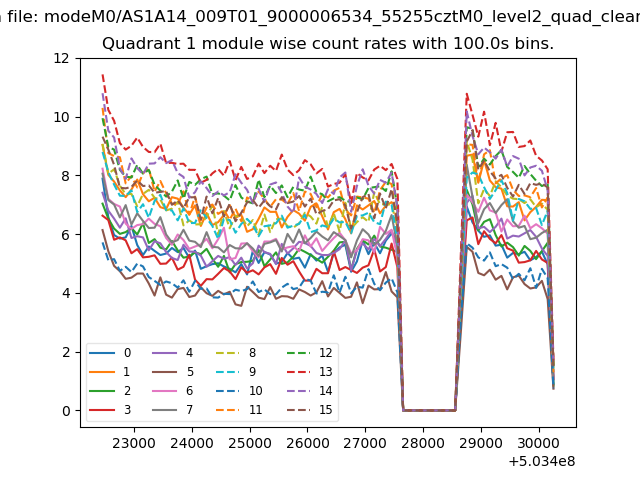
| Module-wise count rates for Quadrant A Data is divided into 100 sec bins |
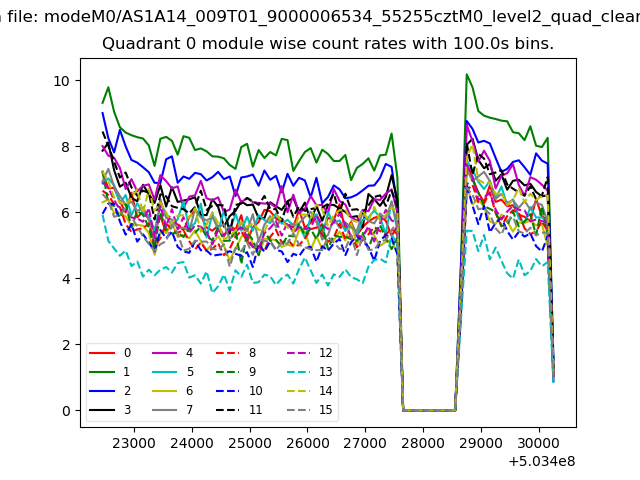 |
 |
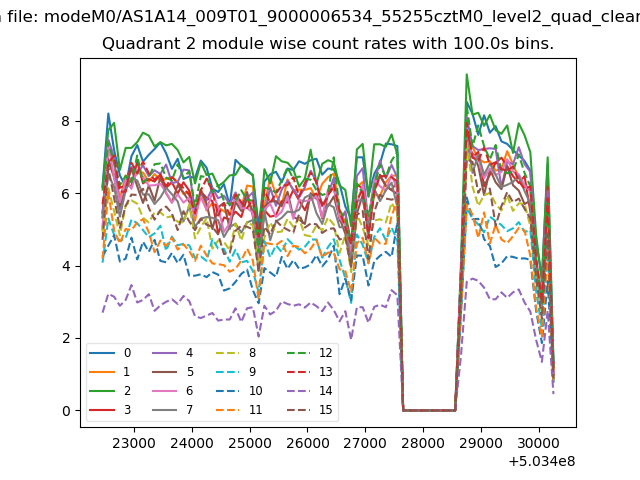
| Module-wise count rates for Quadrant B Data is divided into 100 sec bins |
 |
 |
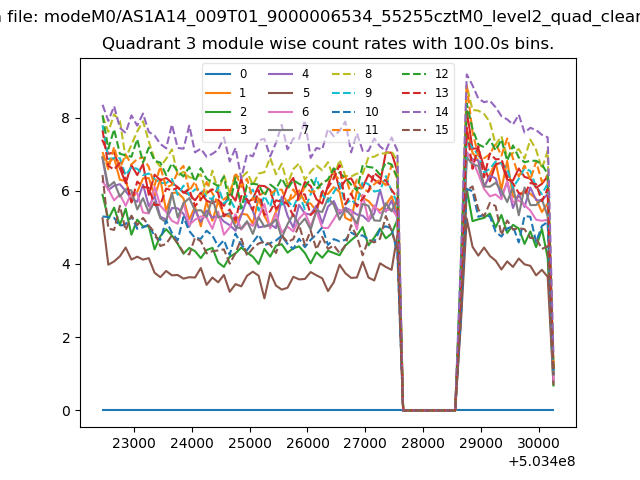
| Module-wise count rates for Quadrant C Data is divided into 100 sec bins |
 |
 |
| Module-wise count rates for Quadrant D Data is divided into 100 sec bins |
 |
 |
| Parameter | Plot |
|---|---|
| CZT HV Monitor | 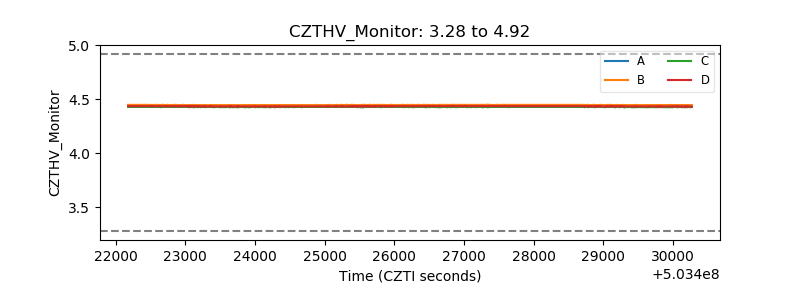 |
| D_VDD | 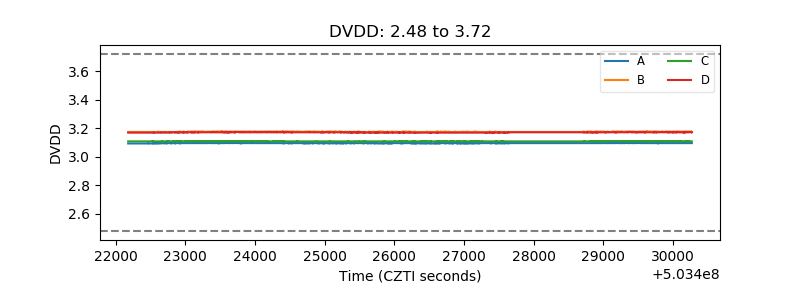 |
| Temperature 1 | 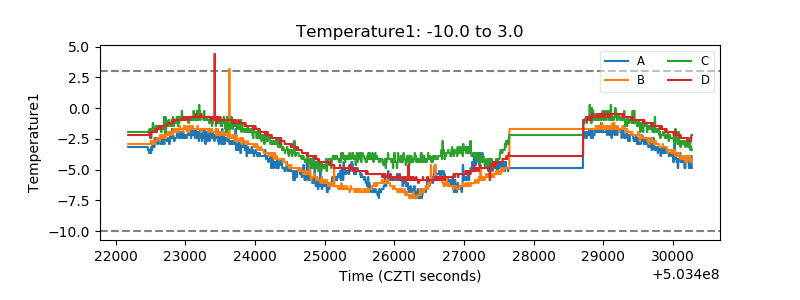 |
| Veto HV Monitor | 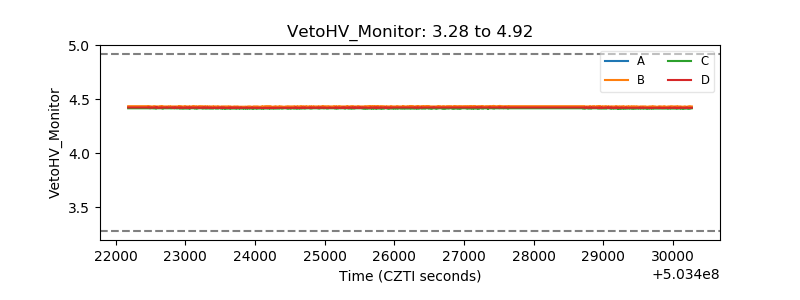 |
| Veto LLD | 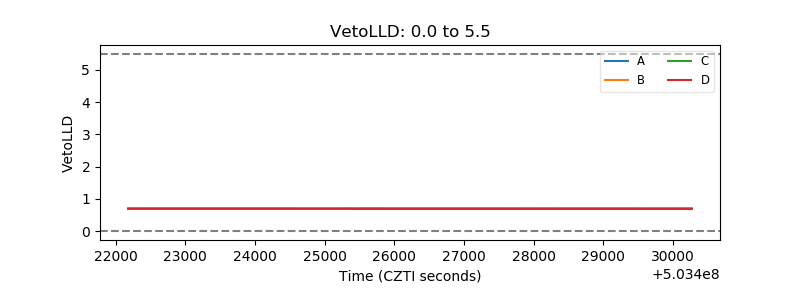 |
| Alpha Counter | 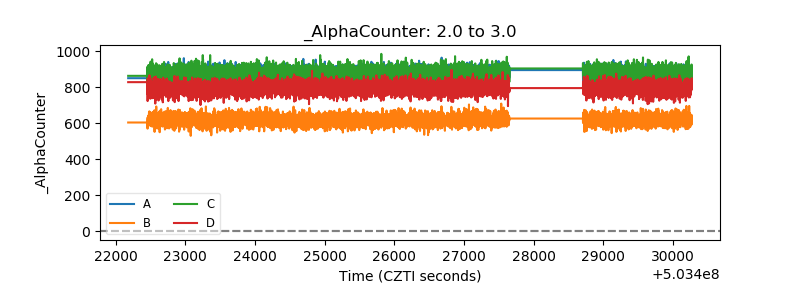 |
| _CPM_Rate | 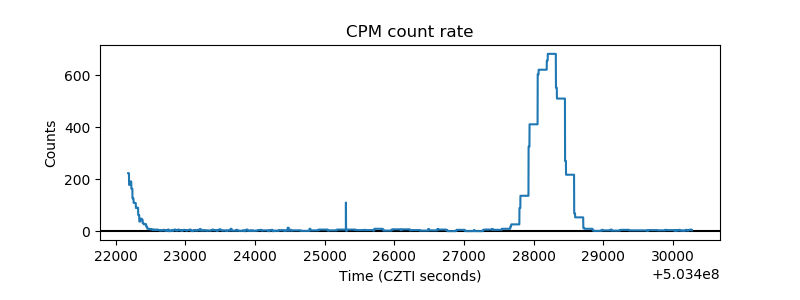 |
| CZT Counter | 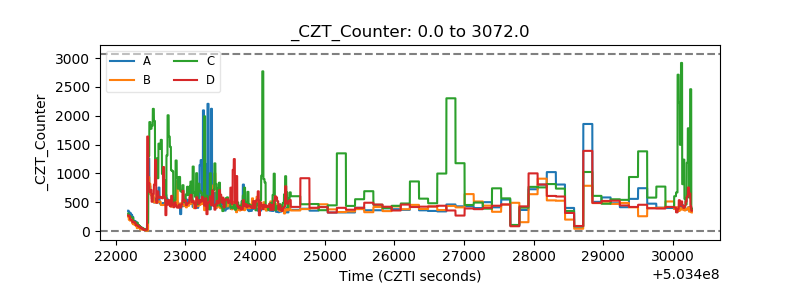 |
| +2.5 Volts monitor |  |
| +5 Volts monitor |  |
| _ROLL_ROT | 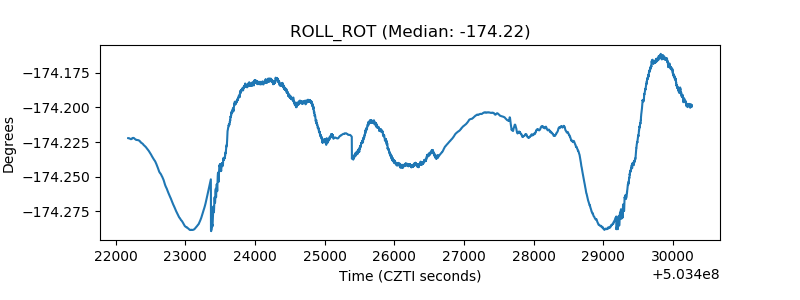 |
| _Roll_DEC | 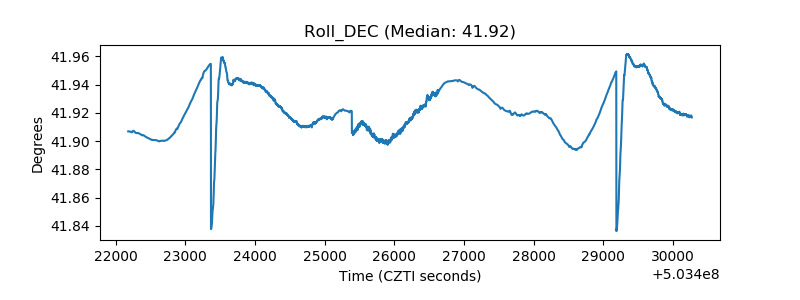 |
| _Roll_RA | 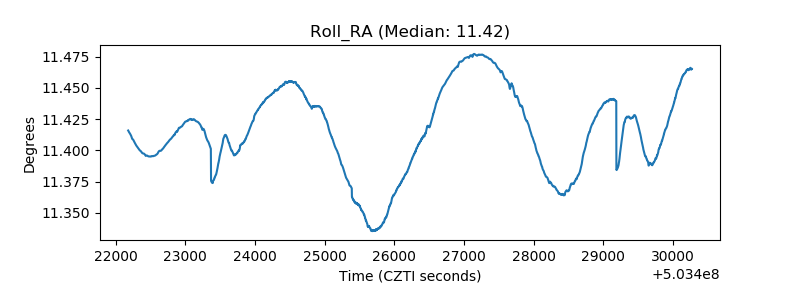 |
| Veto Counter | 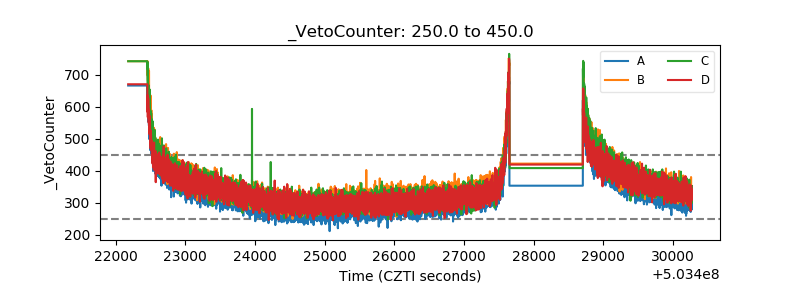 |