| Param | Original file | Final file |
|---|---|---|
| Filename | modeM0/AS1A14_009T01_9000006534_55257cztM0_level2.fits | modeM0/AS1A14_009T01_9000006534_55257cztM0_level2_quad_clean.evt |
| Size (bytes) | 395,363,520 | 94,968,000 |
| Size | 377.0 MB | 90.6 MB |
| Events in quadrant A | 3,201,919 | 620,103 |
| Events in quadrant B | 2,920,123 | 673,787 |
| Events in quadrant C | 4,494,845 | 570,877 |
| Events in quadrant D | 3,521,689 | 565,633 |
| Mode SS | |||
|---|---|---|---|
| Quadrant | BADHDUFLAG | Total packets | Discarded packets |
| A | 0 | 130 | 0 |
| B | 0 | 130 | 0 |
| C | 0 | 130 | 0 |
| D | 0 | 130 | 0 |
| Mode M0 | |||
|---|---|---|---|
| Quadrant | BADHDUFLAG | Total packets | Discarded packets |
| A | 0 | 14192 | 2 |
| B | 0 | 13596 | 2 |
| C | 0 | 17855 | 2 |
| D | 0 | 14871 | 2 |
| Mode M9 | |||
|---|---|---|---|
| Quadrant | BADHDUFLAG | Total packets | Discarded packets |
| A | 0 | 15 | 0 |
| B | 0 | 16 | 0 |
| C | 0 | 16 | 0 |
| D | 0 | 16 | 0 |
| Quadrant | Total seconds | Saturated seconds | Saturation percentage |
|---|---|---|---|
| A | 6380 | 83 | 1.300940% |
| B | 6380 | 58 | 0.909091% |
| C | 6380 | 467 | 7.319749% |
| D | 6380 | 102 | 1.598746% |
Noise dominated data is calculated using 1-second bins in cleaned event files. If a bin has >2000 counts, and if more than 50% of those come from <1% of pixels, then it is considered to be noise-dominated and hence unusable.
| Quadrant | # 1 sec bins | Bins with >0 counts | Bins with >2000 counts | High rate bins dominated by noise | Noise dominated (total time) | Noise dominated (detector-on time) | Marked lightcurve |
|---|---|---|---|---|---|---|---|
| A | 7545 | 6381 | 49 | 49 | 0.65% | 0.77% | 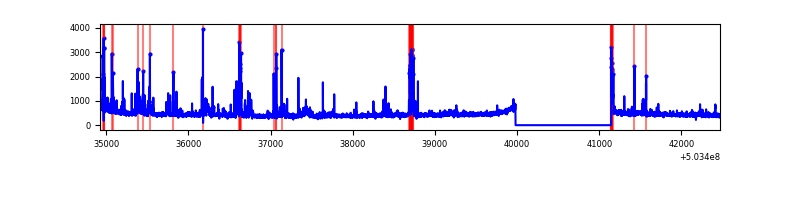 |
| B | 7545 | 6381 | 28 | 28 | 0.37% | 0.44% | 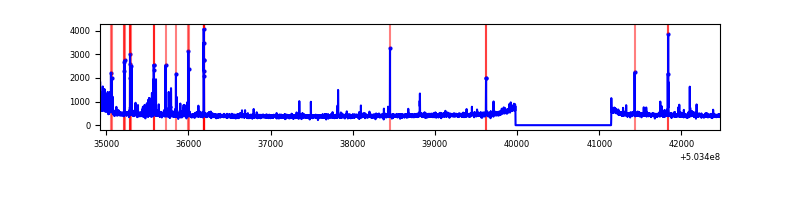 |
| C | 7545 | 6381 | 467 | 467 | 6.19% | 7.32% | 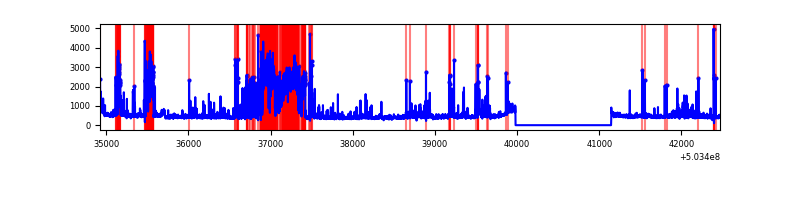 |
| D | 7545 | 6381 | 60 | 60 | 0.80% | 0.94% | 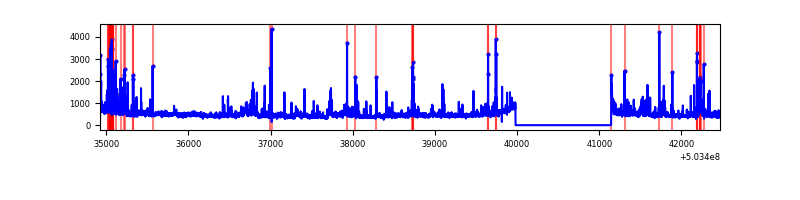 |
Top three noisy pixels from each quadrant. If the there are fewer than three noisy pixels in the level2.evt file, extra rows are filled as -1
| Pixel properties | Quadrant properties | ||||||
|---|---|---|---|---|---|---|---|
| Quadrant | DetID | PixID | Counts | Sigma | Mean | Median | Sigma |
| A | 0 | 8 | 273408 | 1642.79 | 670 | 654 | 166.0 |
| A | 4 | 249 | 84025 | 502.14 | 670 | 654 | 166.0 |
| A | 7 | 243 | 57801 | 344.2 | 670 | 654 | 166.0 |
| B | 5 | 185 | 109774 | 767.62 | 669 | 647 | 142.2 |
| B | 10 | 245 | 65188 | 453.99 | 669 | 647 | 142.2 |
| B | 2 | 249 | 31149 | 214.56 | 669 | 647 | 142.2 |
| C | 13 | 3 | 1398689 | 7821.24 | 650 | 644 | 178.7 |
| C | 14 | 80 | 176510 | 983.87 | 650 | 644 | 178.7 |
| C | 14 | 254 | 119447 | 664.63 | 650 | 644 | 178.7 |
| D | 7 | 96 | 232055 | 1249.74 | 657 | 629 | 185.2 |
| D | 5 | 38 | 229391 | 1235.35 | 657 | 629 | 185.2 |
| D | 3 | 12 | 139406 | 749.42 | 657 | 629 | 185.2 |
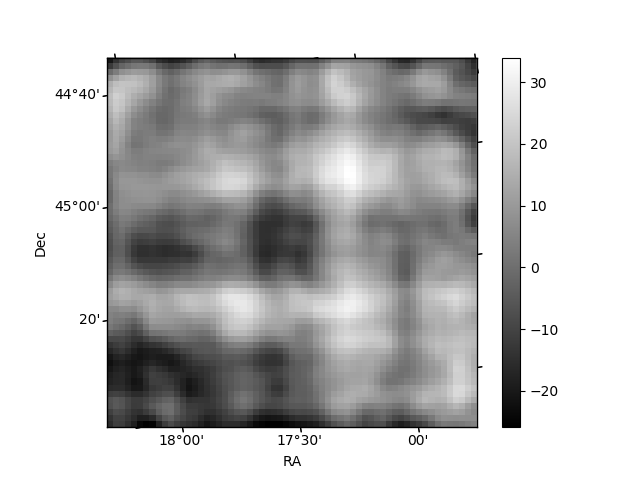
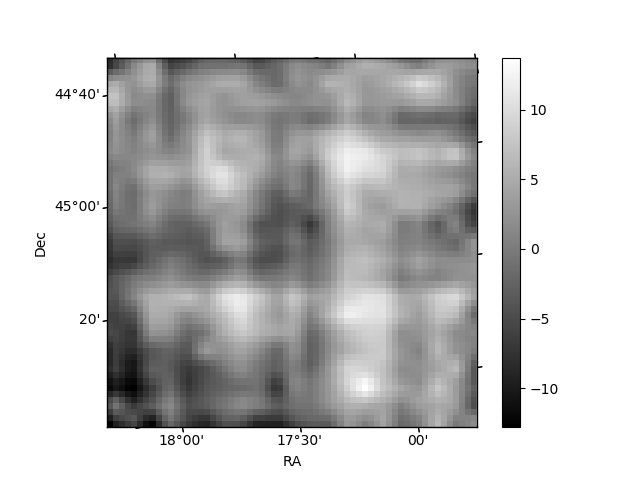
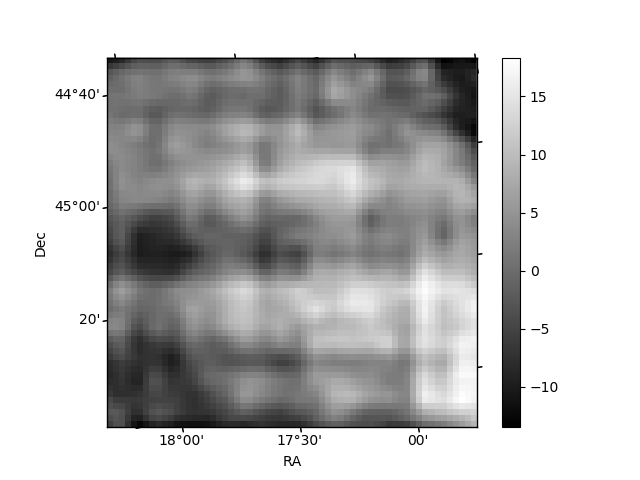
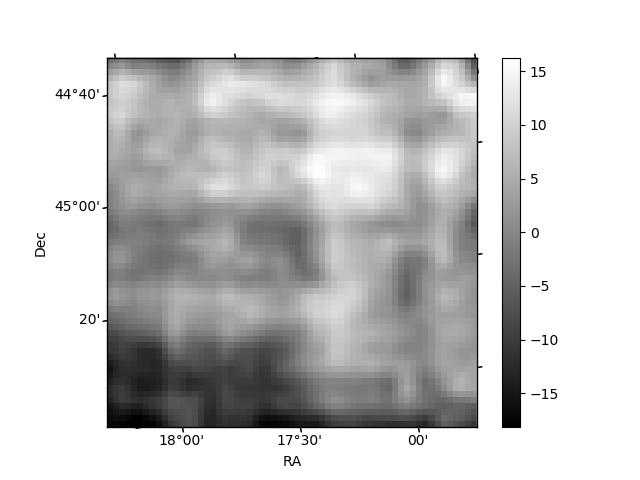
Histogram calculated using DETX and DETY for each event in the final _common_clean file
| Quadrant A | 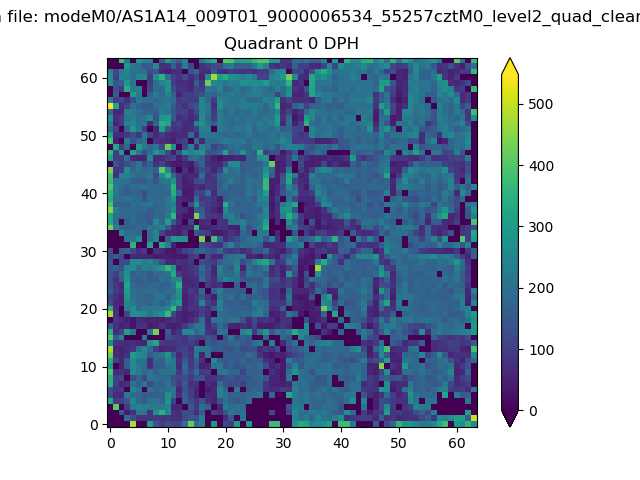 |
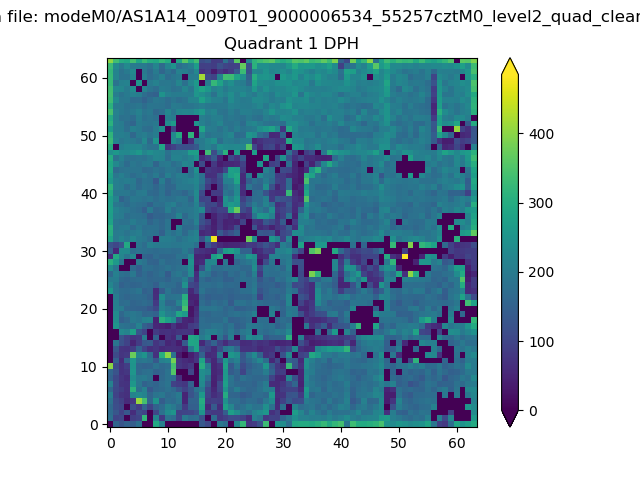 |
Quadrant B |
|---|---|---|---|
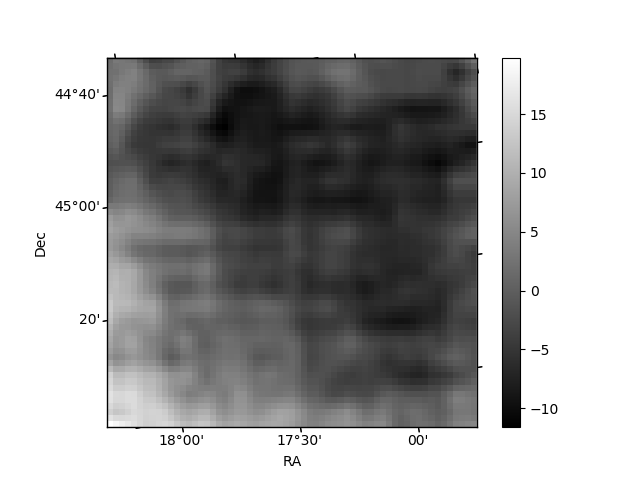
| Quadrant D | 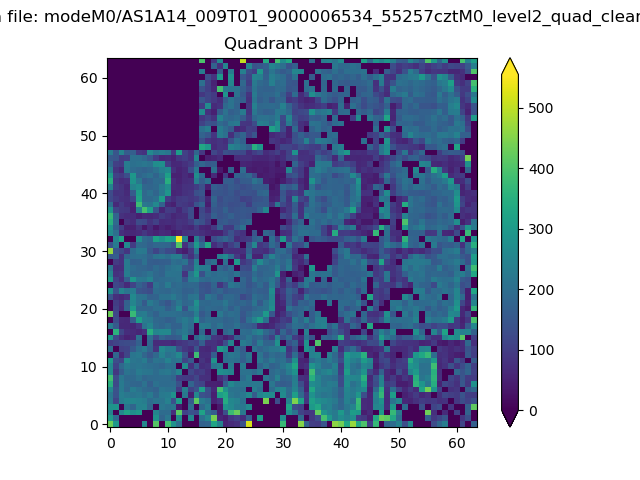 |
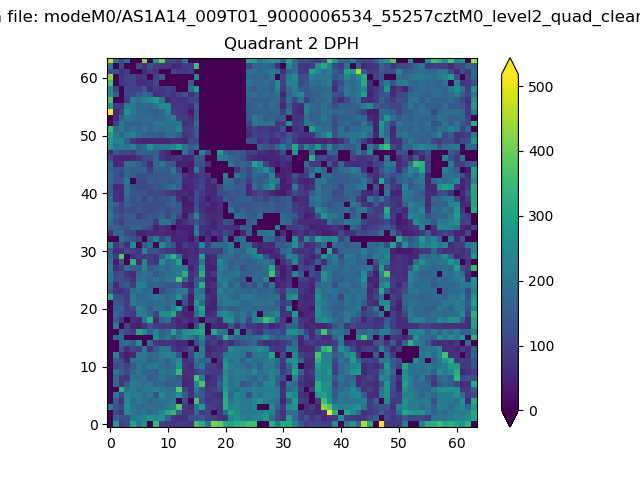 |
Quadrant C |
| Plot type | Count rate plots | Images |
|---|---|---|
| Comparison with Poisson distribution Blue bars denote a histogram of data divided into 1 sec bins. Red curve is a Poisson curve with rate = median count rate of data. |
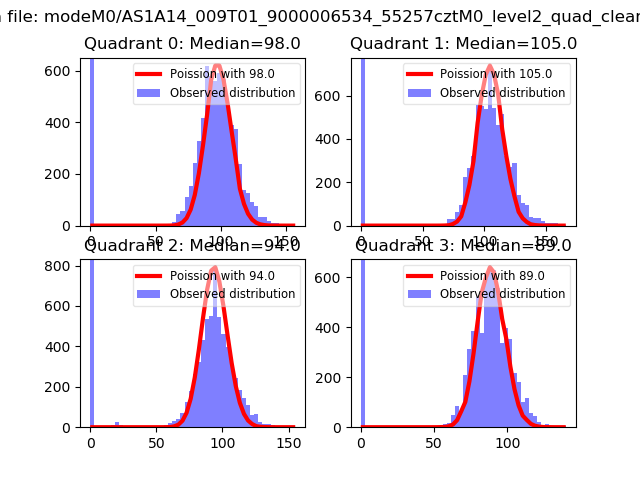 |
 |
| Quadrant-wise count rates Data is divided into 100 sec bins |
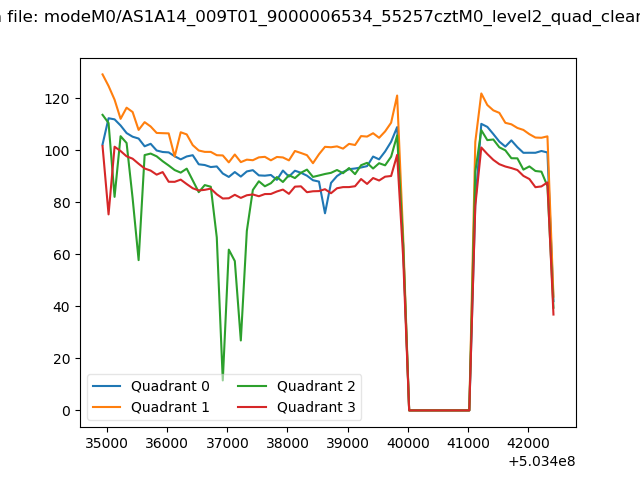 |
|
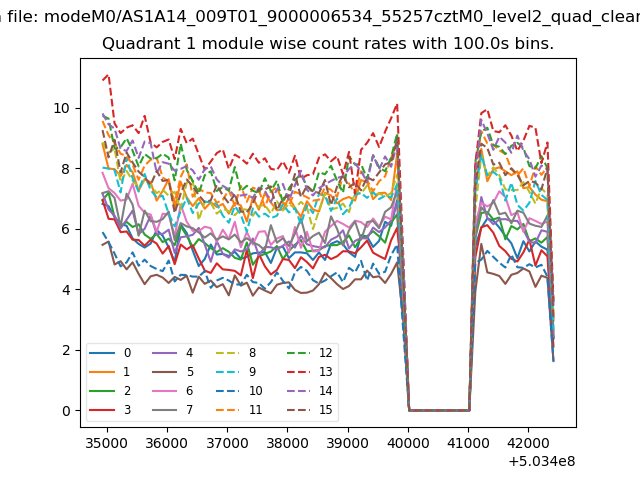
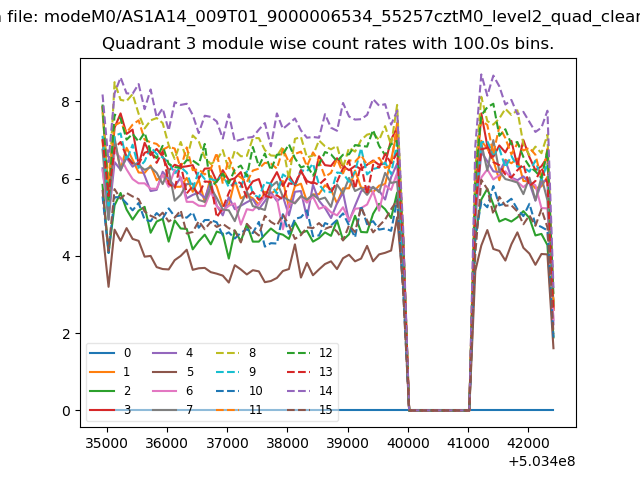
| Module-wise count rates for Quadrant A Data is divided into 100 sec bins |
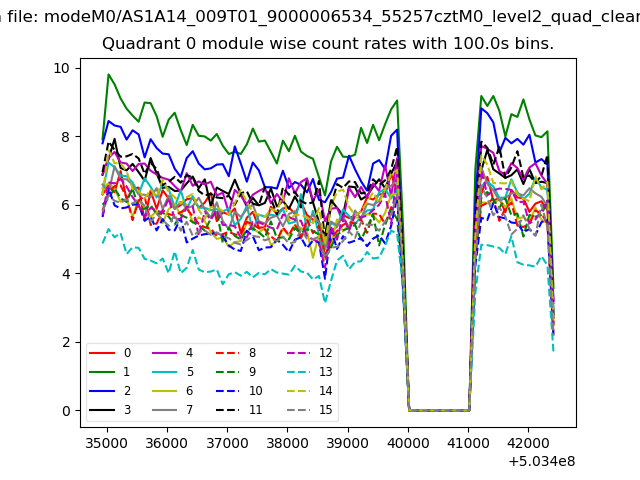 |
 |
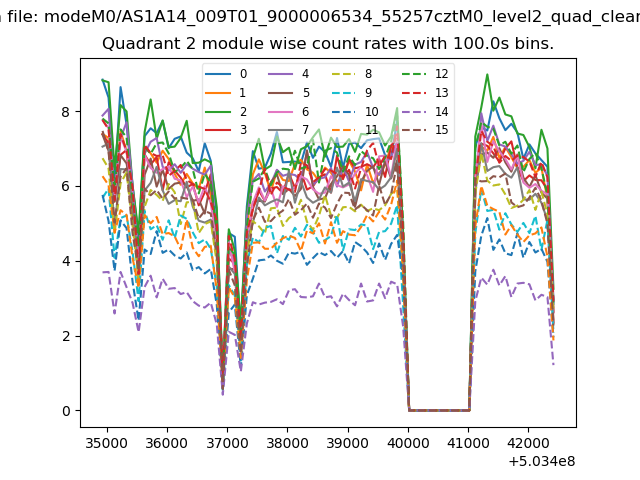
| Module-wise count rates for Quadrant B Data is divided into 100 sec bins |
 |
 |
| Module-wise count rates for Quadrant C Data is divided into 100 sec bins |
 |
 |
| Module-wise count rates for Quadrant D Data is divided into 100 sec bins |
 |
 |
| Parameter | Plot |
|---|---|
| CZT HV Monitor |  |
| D_VDD | 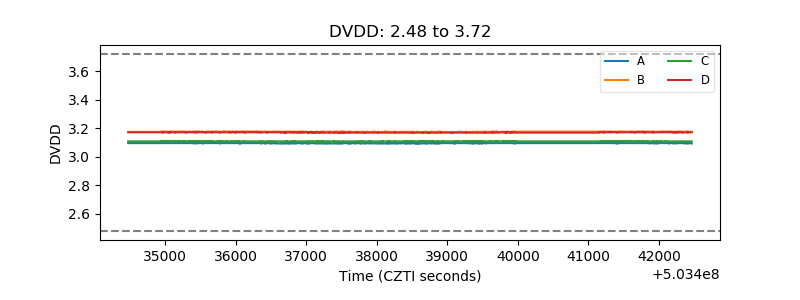 |
| Temperature 1 | 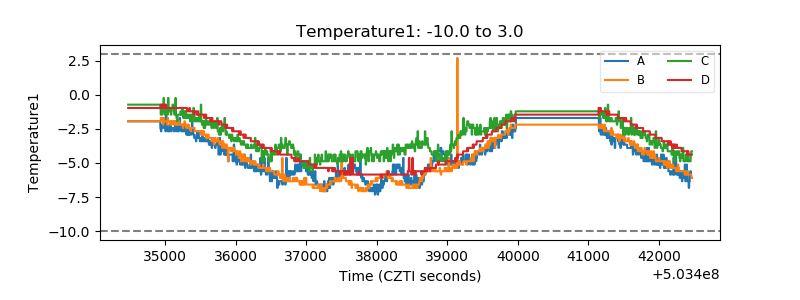 |
| Veto HV Monitor | 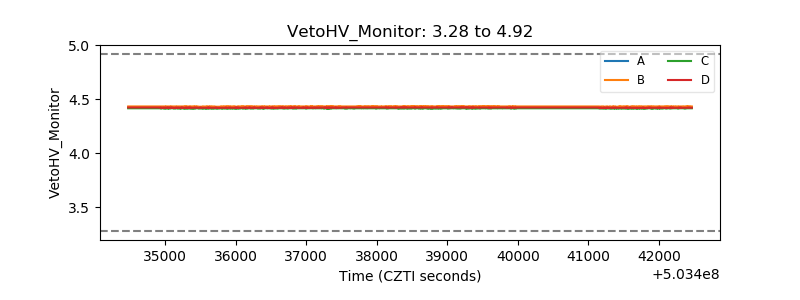 |
| Veto LLD | 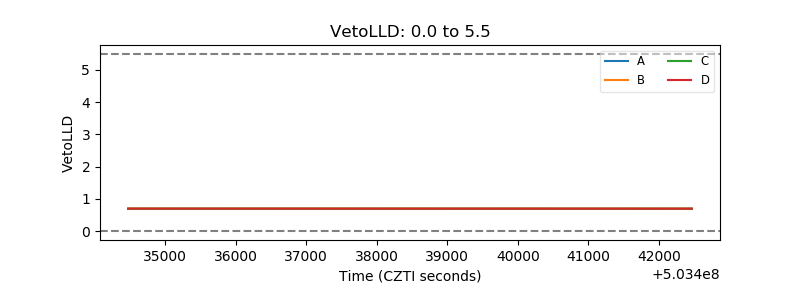 |
| Alpha Counter | 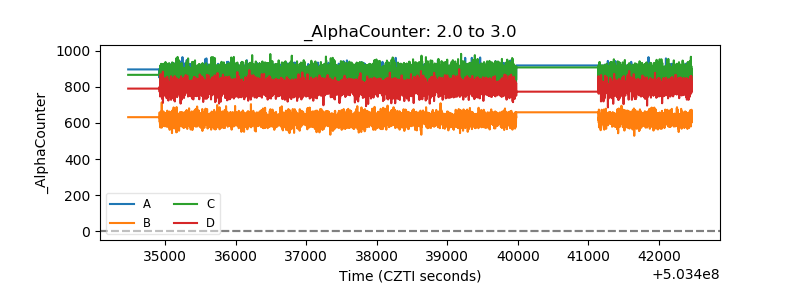 |
| _CPM_Rate | 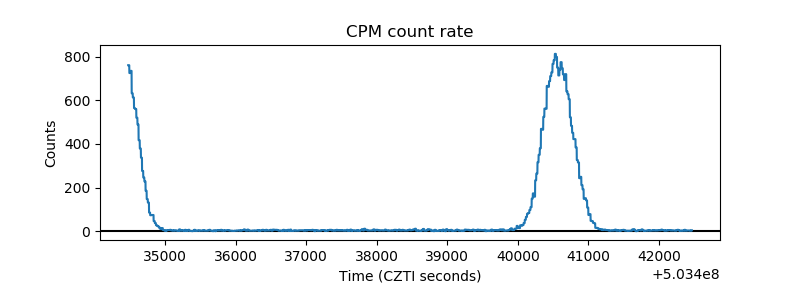 |
| CZT Counter | 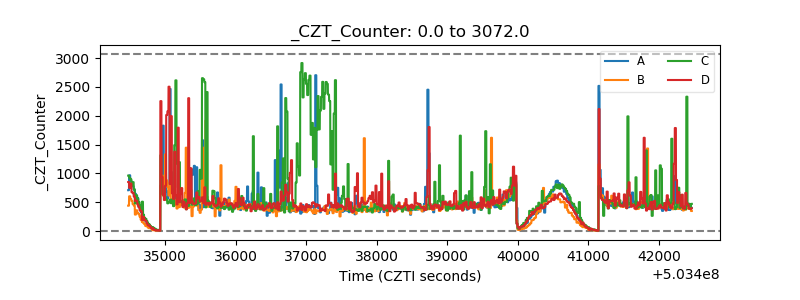 |
| +2.5 Volts monitor | 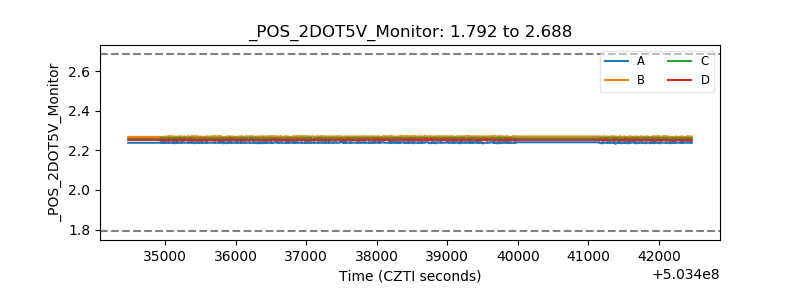 |
| +5 Volts monitor | 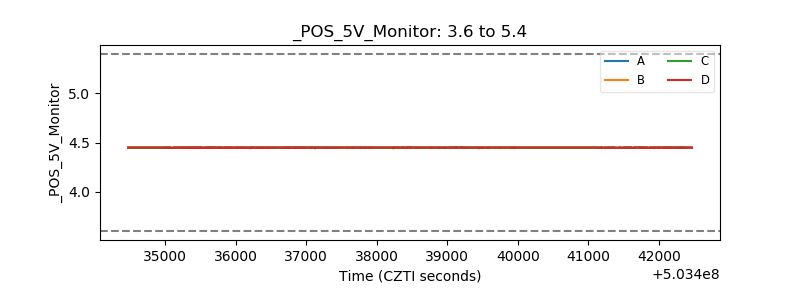 |
| _ROLL_ROT | 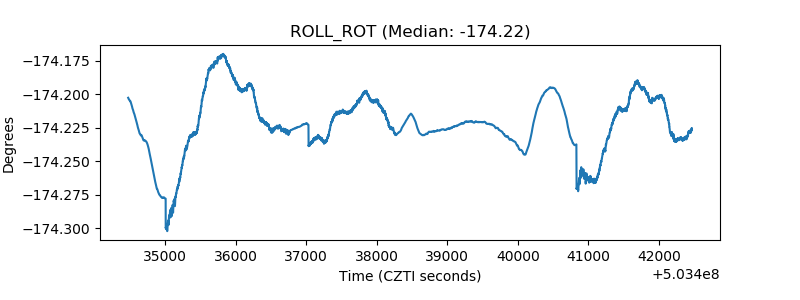 |
| _Roll_DEC | 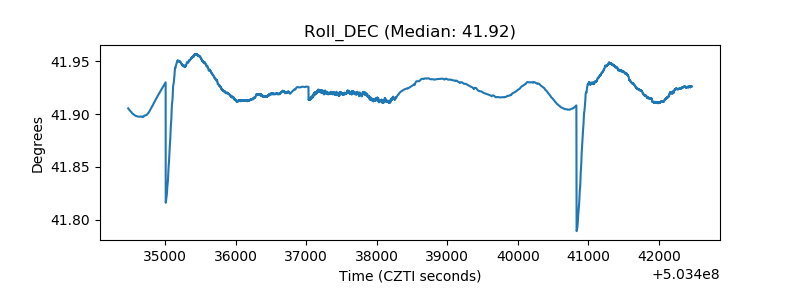 |
| _Roll_RA | 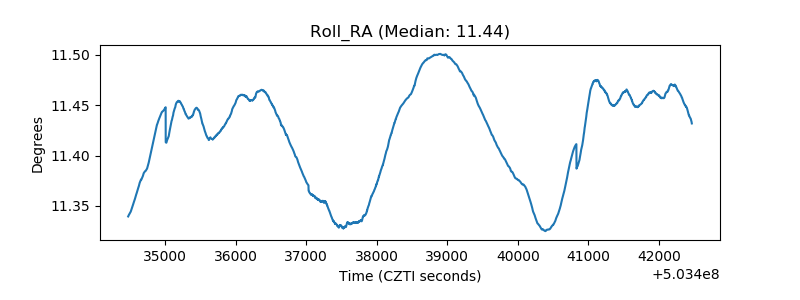 |
| Veto Counter | 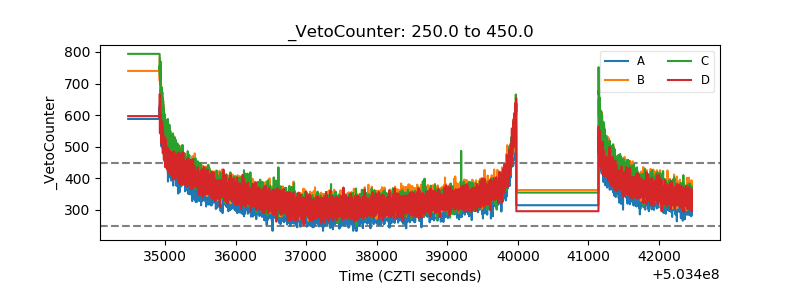 |