| Param | Original file | Final file |
|---|---|---|
| Filename | modeM0/AS1A14_009T01_9000006534_55258cztM0_level2.fits | modeM0/AS1A14_009T01_9000006534_55258cztM0_level2_quad_clean.evt |
| Size (bytes) | 357,445,440 | 97,004,160 |
| Size | 340.9 MB | 92.5 MB |
| Events in quadrant A | 3,196,705 | 623,788 |
| Events in quadrant B | 2,885,290 | 681,435 |
| Events in quadrant C | 3,432,377 | 605,279 |
| Events in quadrant D | 3,207,880 | 570,225 |
| Mode SS | |||
|---|---|---|---|
| Quadrant | BADHDUFLAG | Total packets | Discarded packets |
| A | 0 | 138 | 0 |
| B | 0 | 138 | 0 |
| C | 0 | 138 | 0 |
| D | 0 | 138 | 0 |
| Mode M0 | |||
|---|---|---|---|
| Quadrant | BADHDUFLAG | Total packets | Discarded packets |
| A | 0 | 14494 | 3 |
| B | 0 | 13641 | 2 |
| C | 0 | 14935 | 2 |
| D | 0 | 14467 | 2 |
| Mode M9 | |||
|---|---|---|---|
| Quadrant | BADHDUFLAG | Total packets | Discarded packets |
| A | 0 | 22 | 0 |
| B | 0 | 22 | 0 |
| C | 0 | 22 | 0 |
| D | 0 | 22 | 0 |
| Quadrant | Total seconds | Saturated seconds | Saturation percentage |
|---|---|---|---|
| A | 6537 | 131 | 2.003977% |
| B | 6537 | 47 | 0.718984% |
| C | 6537 | 85 | 1.300291% |
| D | 6537 | 59 | 0.902555% |
Noise dominated data is calculated using 1-second bins in cleaned event files. If a bin has >2000 counts, and if more than 50% of those come from <1% of pixels, then it is considered to be noise-dominated and hence unusable.
| Quadrant | # 1 sec bins | Bins with >0 counts | Bins with >2000 counts | High rate bins dominated by noise | Noise dominated (total time) | Noise dominated (detector-on time) | Marked lightcurve |
|---|---|---|---|---|---|---|---|
| A | 8852 | 6539 | 95 | 95 | 1.07% | 1.45% | 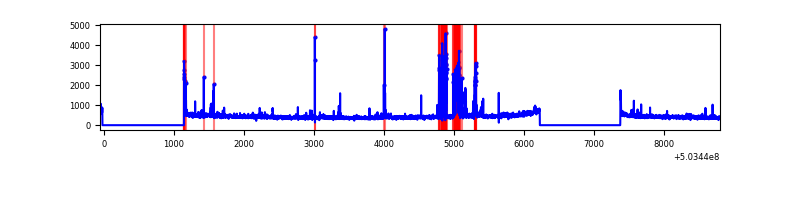 |
| B | 8852 | 6539 | 12 | 12 | 0.14% | 0.18% | 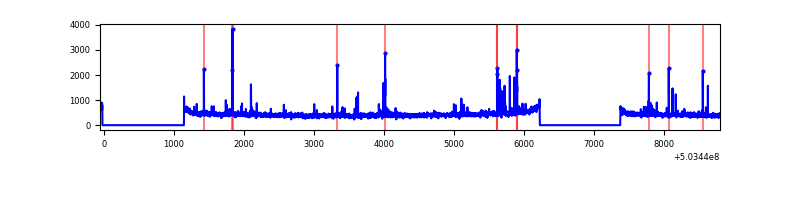 |
| C | 8852 | 6539 | 70 | 70 | 0.79% | 1.07% | 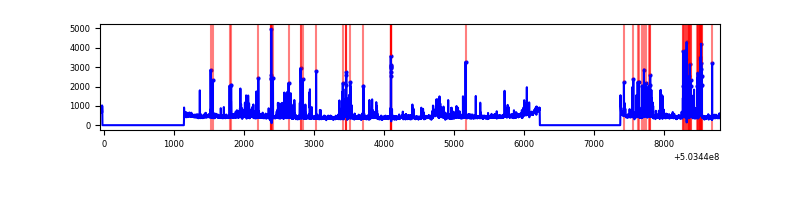 |
| D | 8852 | 6539 | 32 | 32 | 0.36% | 0.49% | 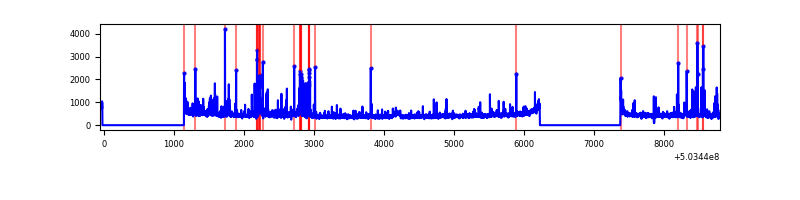 |
Top three noisy pixels from each quadrant. If the there are fewer than three noisy pixels in the level2.evt file, extra rows are filled as -1
| Pixel properties | Quadrant properties | ||||||
|---|---|---|---|---|---|---|---|
| Quadrant | DetID | PixID | Counts | Sigma | Mean | Median | Sigma |
| A | 0 | 8 | 371662 | 2205.44 | 679 | 663 | 168.2 |
| A | 7 | 243 | 54602 | 320.65 | 679 | 663 | 168.2 |
| A | 3 | 14 | 32254 | 187.8 | 679 | 663 | 168.2 |
| B | 5 | 185 | 66122 | 449.68 | 683 | 657 | 145.6 |
| B | 2 | 249 | 34483 | 232.35 | 683 | 657 | 145.6 |
| B | 10 | 247 | 22702 | 151.43 | 683 | 657 | 145.6 |
| C | 13 | 3 | 302874 | 1608.97 | 676 | 670 | 187.8 |
| C | 14 | 254 | 121664 | 644.19 | 676 | 670 | 187.8 |
| C | 12 | 252 | 110700 | 585.81 | 676 | 670 | 187.8 |
| D | 3 | 12 | 136044 | 706.92 | 669 | 638 | 191.5 |
| D | 7 | 96 | 117578 | 610.51 | 669 | 638 | 191.5 |
| D | 10 | 181 | 65514 | 338.7 | 669 | 638 | 191.5 |
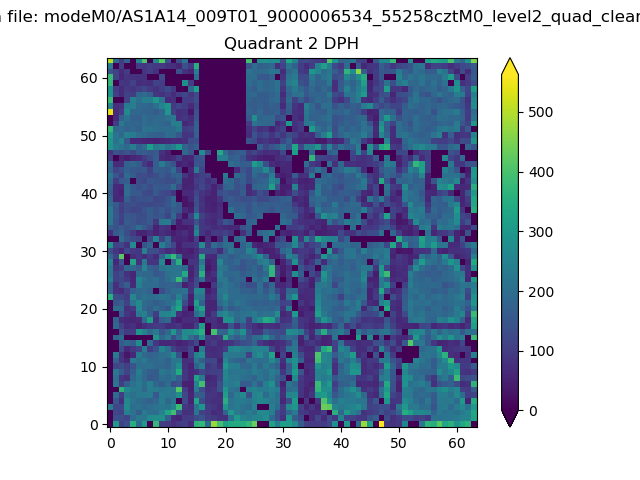
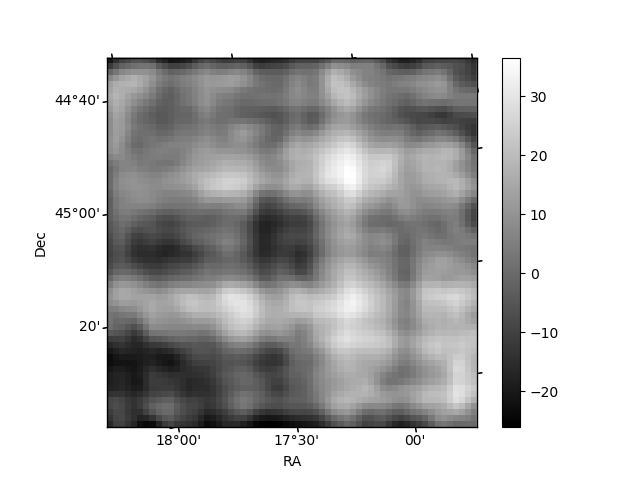
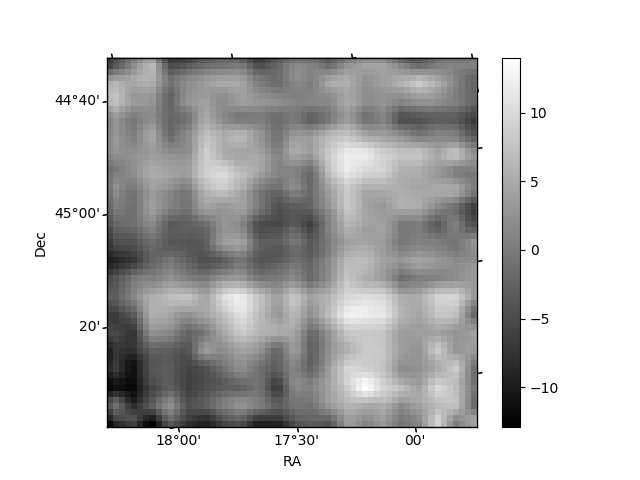
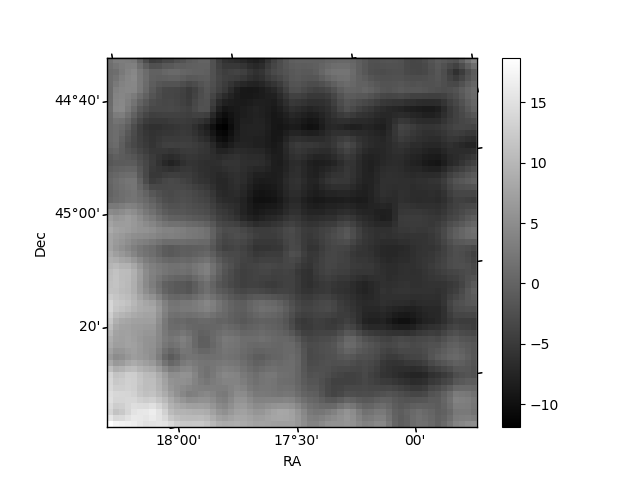
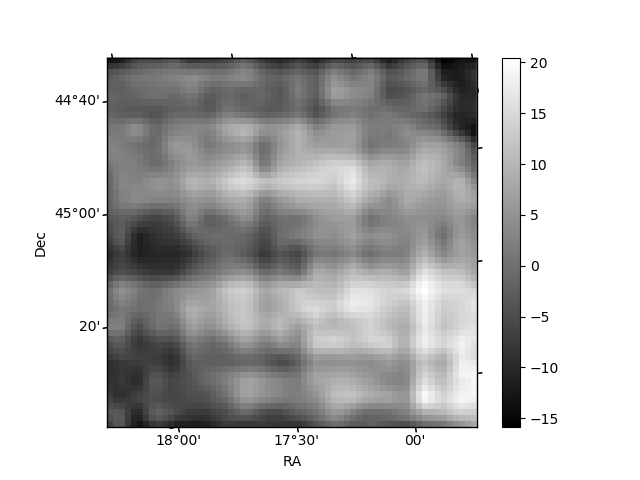
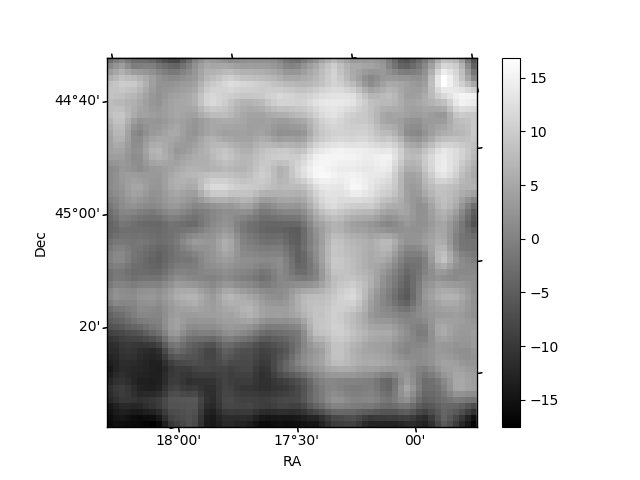
Histogram calculated using DETX and DETY for each event in the final _common_clean file
| Quadrant A | 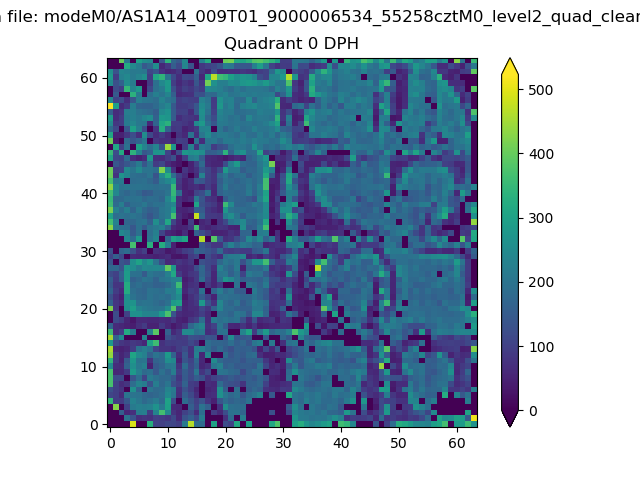 |
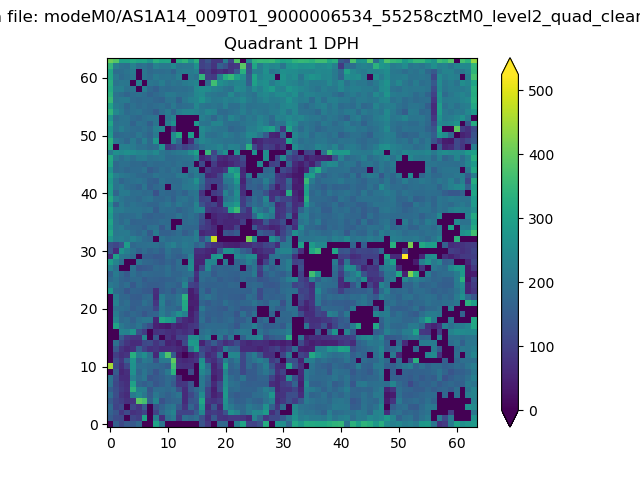 |
Quadrant B |
|---|---|---|---|
| Quadrant D | 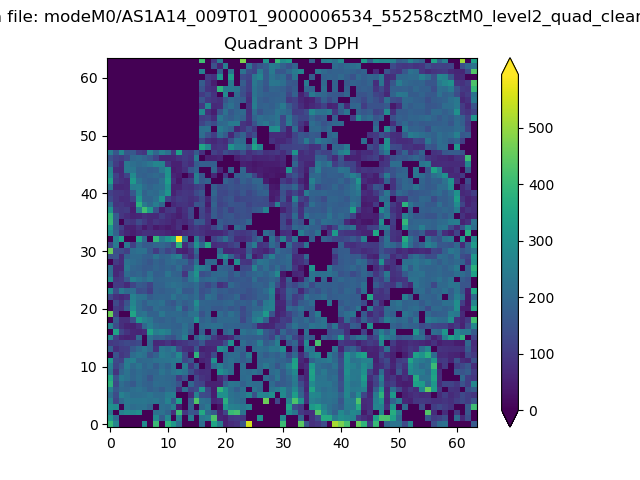 |
 |
Quadrant C |
| Plot type | Count rate plots | Images |
|---|---|---|
| Comparison with Poisson distribution Blue bars denote a histogram of data divided into 1 sec bins. Red curve is a Poisson curve with rate = median count rate of data. |
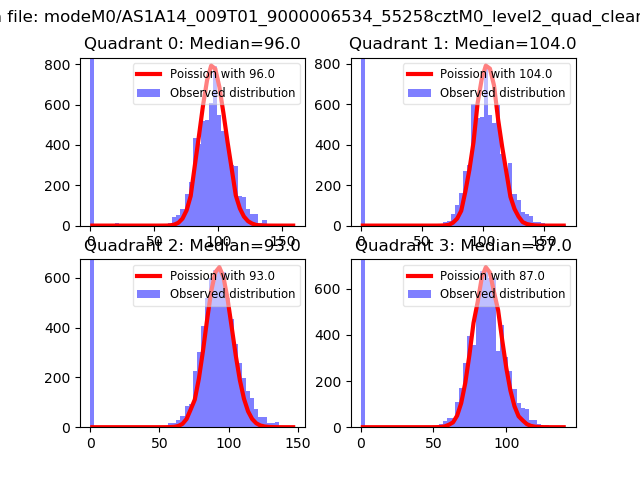 |
 |
| Quadrant-wise count rates Data is divided into 100 sec bins |
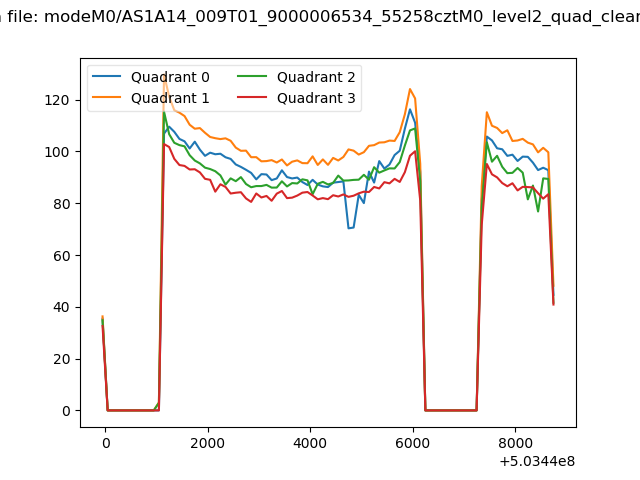 |
|
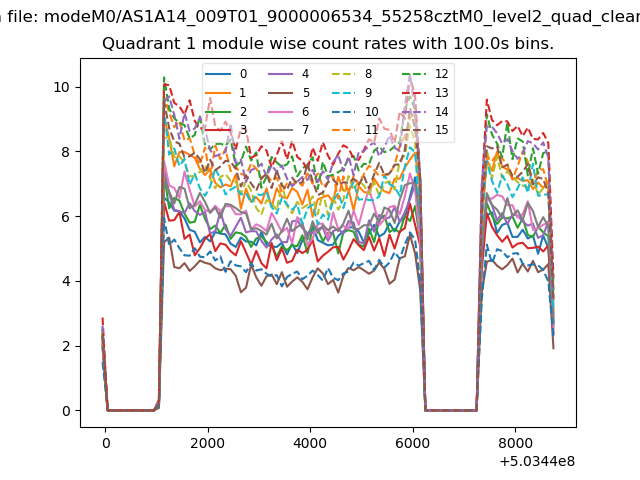
| Module-wise count rates for Quadrant A Data is divided into 100 sec bins |
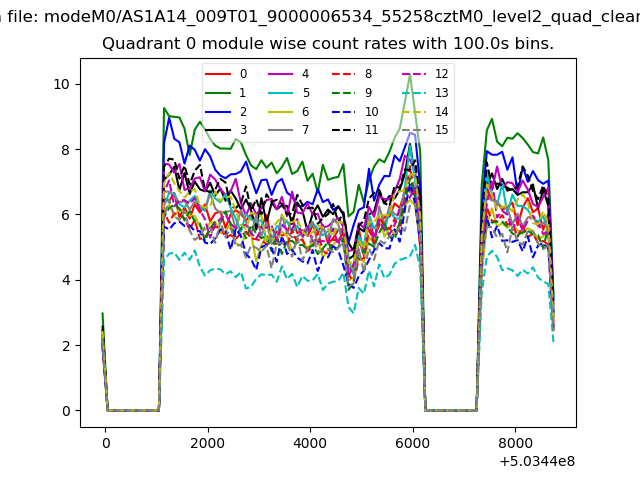 |
 |
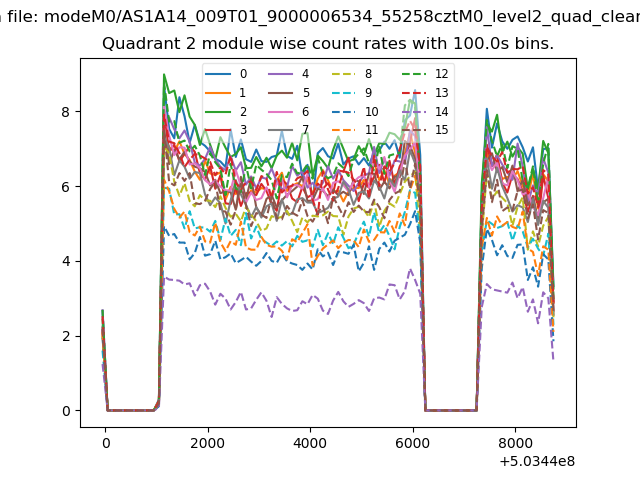
| Module-wise count rates for Quadrant B Data is divided into 100 sec bins |
 |
 |
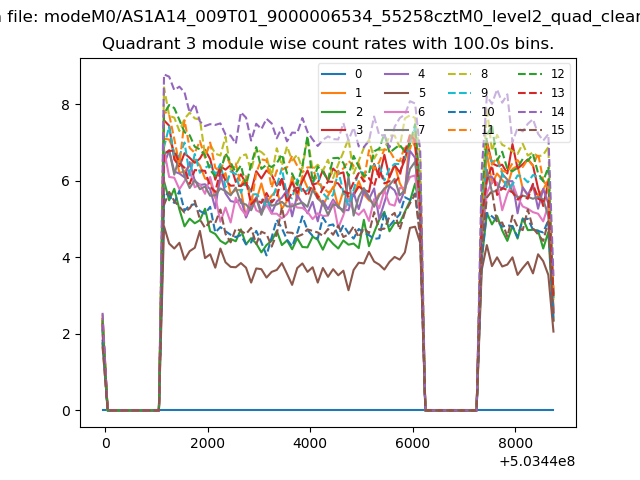
| Module-wise count rates for Quadrant C Data is divided into 100 sec bins |
 |
 |
| Module-wise count rates for Quadrant D Data is divided into 100 sec bins |
 |
 |
| Parameter | Plot |
|---|---|
| CZT HV Monitor | 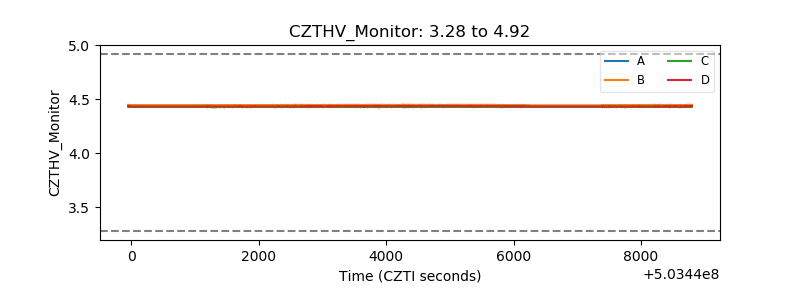 |
| D_VDD | 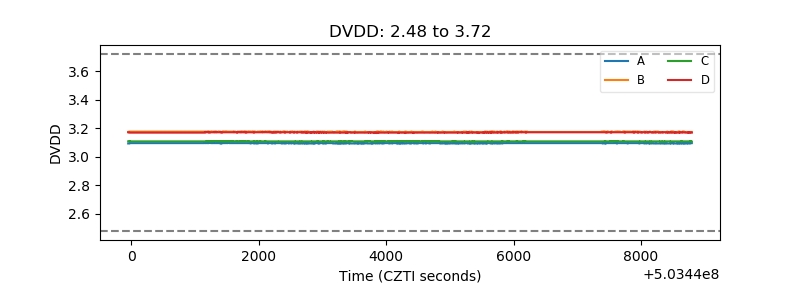 |
| Temperature 1 | 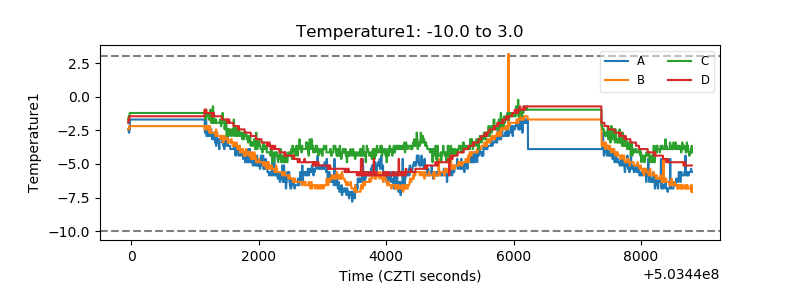 |
| Veto HV Monitor | 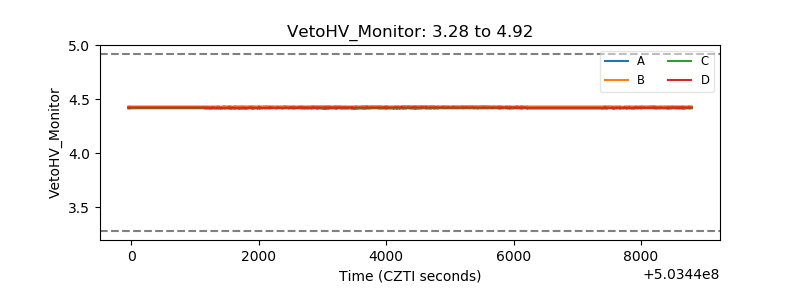 |
| Veto LLD | 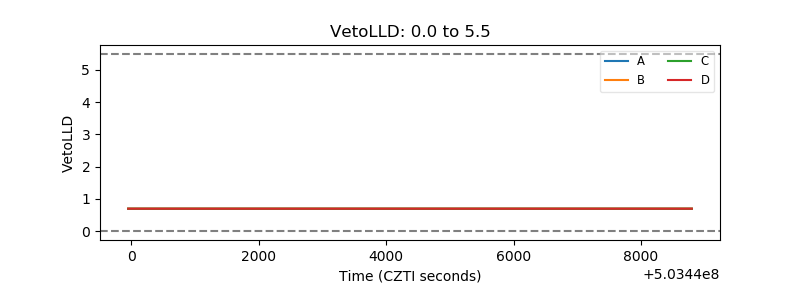 |
| Alpha Counter | 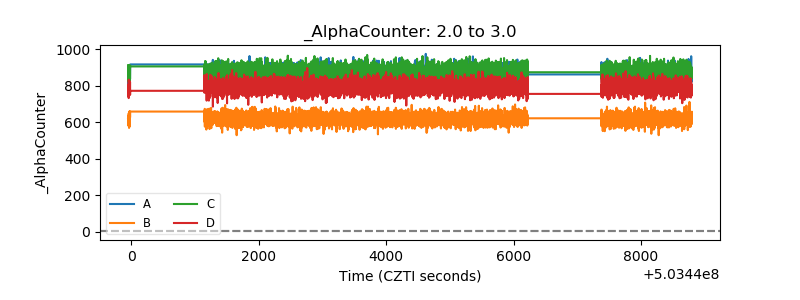 |
| _CPM_Rate | 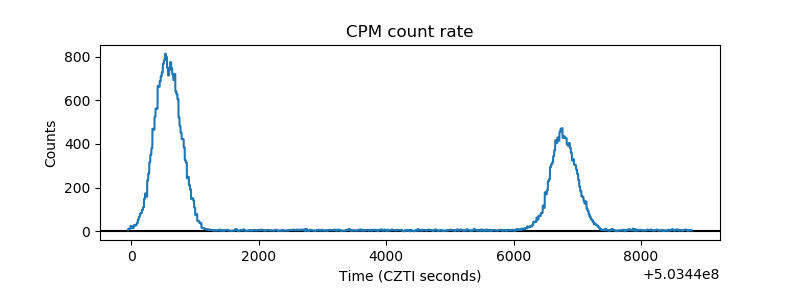 |
| CZT Counter | 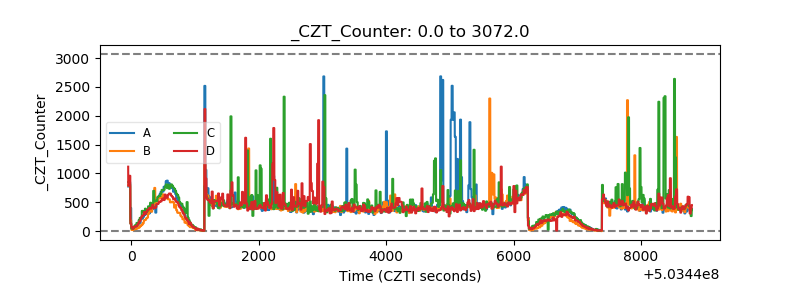 |
| +2.5 Volts monitor | 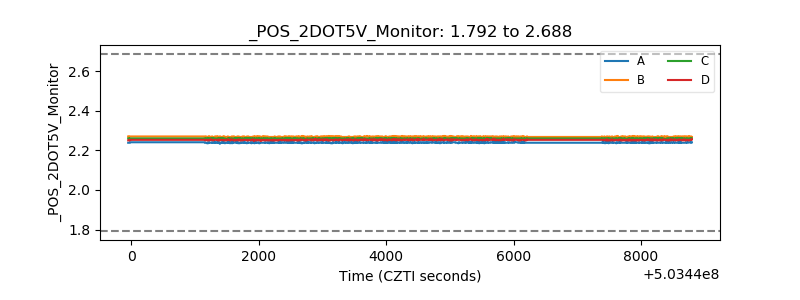 |
| +5 Volts monitor | 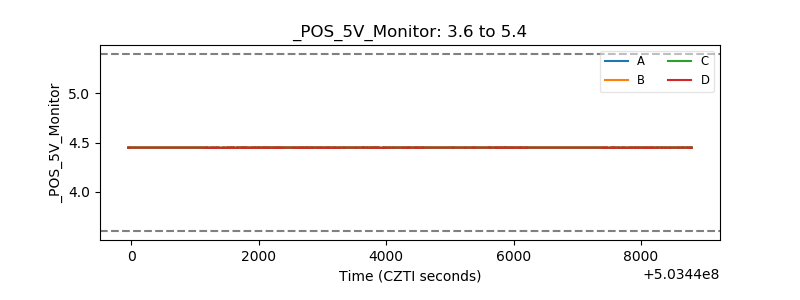 |
| _ROLL_ROT | 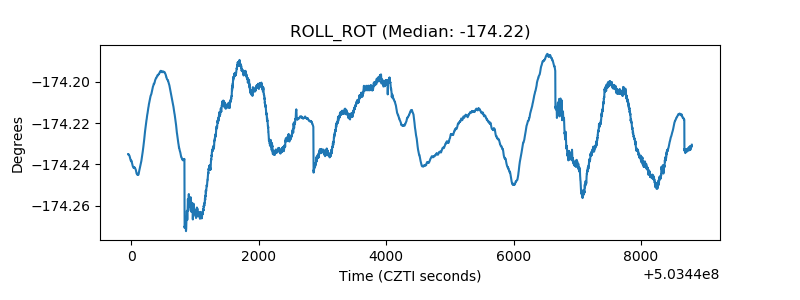 |
| _Roll_DEC | 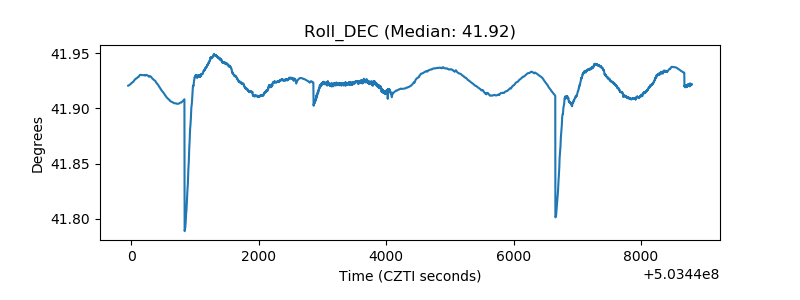 |
| _Roll_RA | 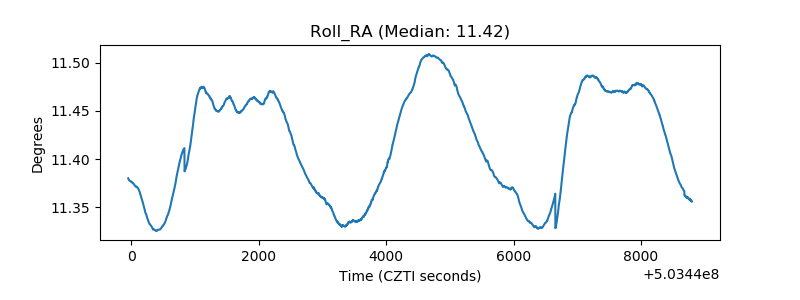 |
| Veto Counter | 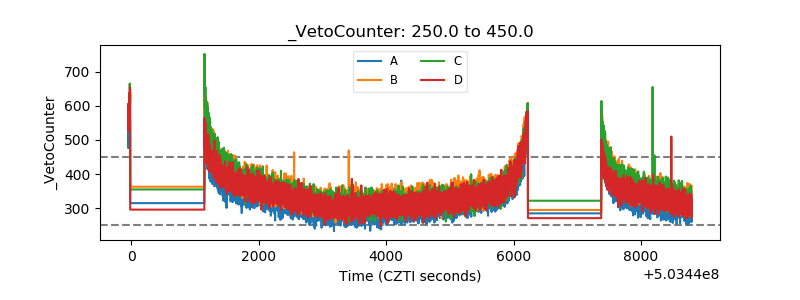 |