| Param | Original file | Final file |
|---|---|---|
| Filename | modeM0/AS1A14_009T01_9000006534_55259cztM0_level2.fits | modeM0/AS1A14_009T01_9000006534_55259cztM0_level2_quad_clean.evt |
| Size (bytes) | 354,631,680 | 96,163,200 |
| Size | 338.2 MB | 91.7 MB |
| Events in quadrant A | 2,888,282 | 620,565 |
| Events in quadrant B | 2,870,421 | 670,787 |
| Events in quadrant C | 3,551,133 | 595,226 |
| Events in quadrant D | 3,300,763 | 562,041 |
| Mode SS | |||
|---|---|---|---|
| Quadrant | BADHDUFLAG | Total packets | Discarded packets |
| A | 0 | 138 | 0 |
| B | 0 | 138 | 0 |
| C | 0 | 138 | 0 |
| D | 0 | 138 | 0 |
| Mode M0 | |||
|---|---|---|---|
| Quadrant | BADHDUFLAG | Total packets | Discarded packets |
| A | 0 | 13797 | 2 |
| B | 0 | 13757 | 2 |
| C | 0 | 15547 | 2 |
| D | 0 | 14804 | 2 |
| Mode M9 | |||
|---|---|---|---|
| Quadrant | BADHDUFLAG | Total packets | Discarded packets |
| A | 0 | 14 | 0 |
| B | 0 | 15 | 0 |
| C | 0 | 15 | 0 |
| D | 0 | 15 | 0 |
| Quadrant | Total seconds | Saturated seconds | Saturation percentage |
|---|---|---|---|
| A | 6632 | 29 | 0.437274% |
| B | 6632 | 45 | 0.678528% |
| C | 6632 | 159 | 2.397467% |
| D | 6632 | 66 | 0.995175% |
Noise dominated data is calculated using 1-second bins in cleaned event files. If a bin has >2000 counts, and if more than 50% of those come from <1% of pixels, then it is considered to be noise-dominated and hence unusable.
| Quadrant | # 1 sec bins | Bins with >0 counts | Bins with >2000 counts | High rate bins dominated by noise | Noise dominated (total time) | Noise dominated (detector-on time) | Marked lightcurve |
|---|---|---|---|---|---|---|---|
| A | 7617 | 6633 | 9 | 9 | 0.12% | 0.14% | 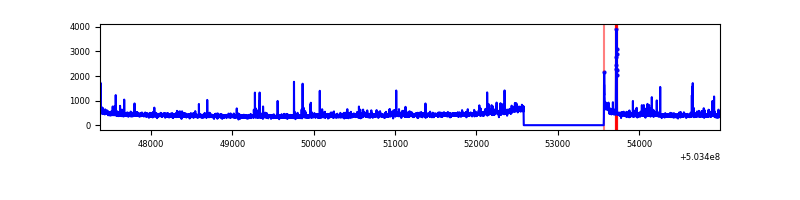 |
| B | 7617 | 6633 | 19 | 19 | 0.25% | 0.29% | 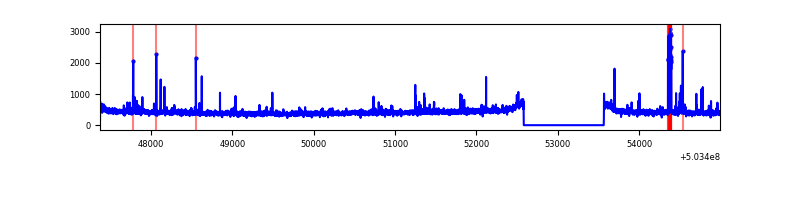 |
| C | 7617 | 6633 | 125 | 125 | 1.64% | 1.88% | 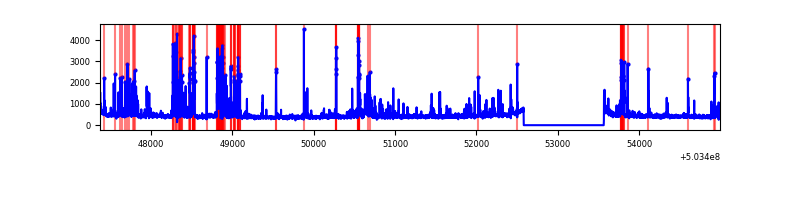 |
| D | 7617 | 6633 | 50 | 50 | 0.66% | 0.75% | 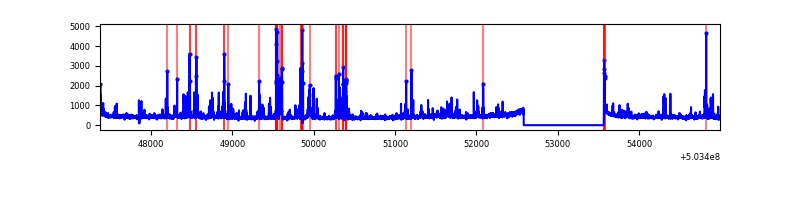 |
Top three noisy pixels from each quadrant. If the there are fewer than three noisy pixels in the level2.evt file, extra rows are filled as -1
| Pixel properties | Quadrant properties | ||||||
|---|---|---|---|---|---|---|---|
| Quadrant | DetID | PixID | Counts | Sigma | Mean | Median | Sigma |
| A | 4 | 249 | 101520 | 599.66 | 682 | 666 | 168.2 |
| A | 7 | 243 | 46726 | 273.86 | 682 | 666 | 168.2 |
| A | 4 | 3 | 28730 | 166.86 | 682 | 666 | 168.2 |
| B | 5 | 185 | 108015 | 728.94 | 683 | 656 | 147.3 |
| B | 12 | 111 | 17684 | 115.62 | 683 | 656 | 147.3 |
| B | 11 | 111 | 16369 | 106.69 | 683 | 656 | 147.3 |
| C | 13 | 3 | 551276 | 2914.6 | 673 | 665 | 188.9 |
| C | 14 | 254 | 67088 | 351.6 | 673 | 665 | 188.9 |
| C | 9 | 38 | 62113 | 325.27 | 673 | 665 | 188.9 |
| D | 7 | 96 | 236486 | 1242.12 | 667 | 639 | 189.9 |
| D | 3 | 12 | 128170 | 671.66 | 667 | 639 | 189.9 |
| D | 7 | 129 | 61775 | 321.98 | 667 | 639 | 189.9 |
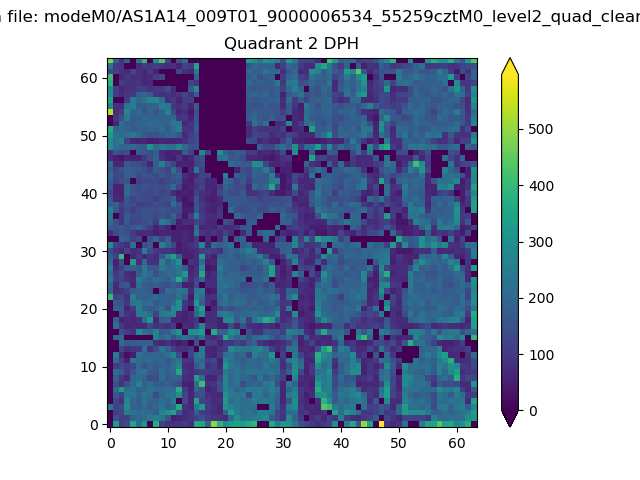
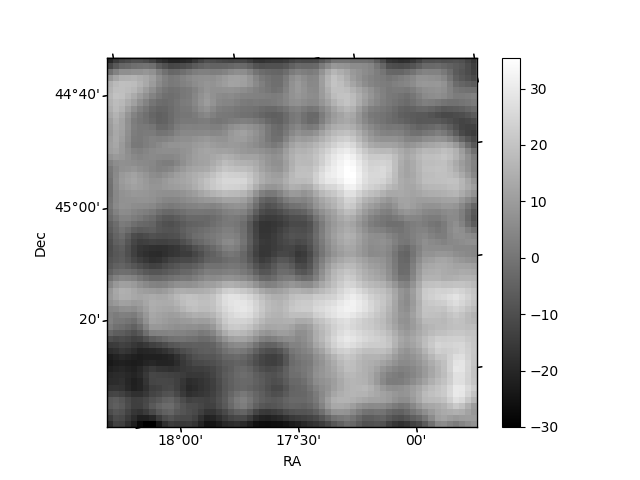
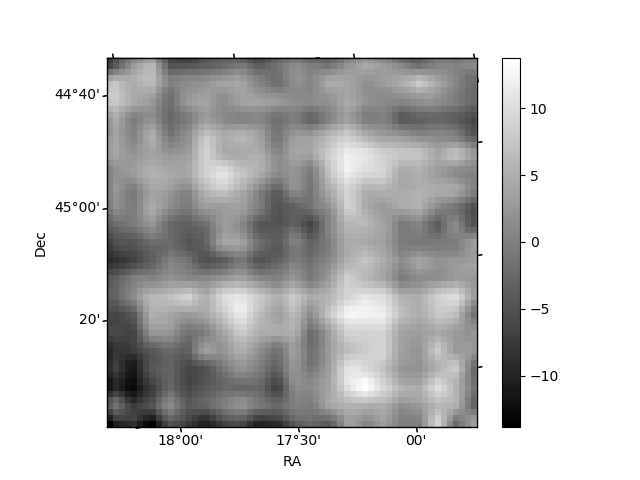
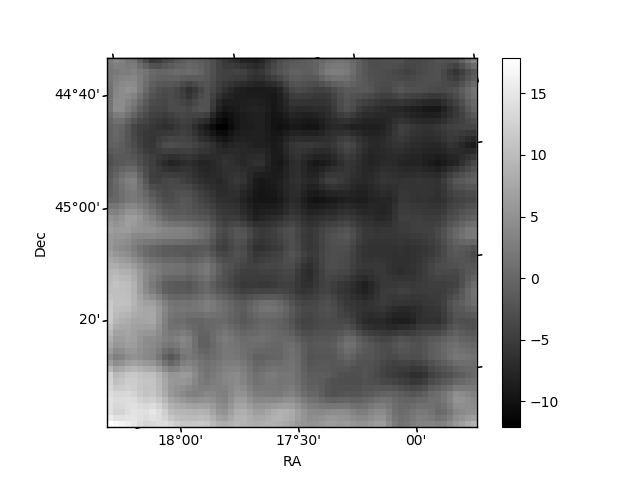
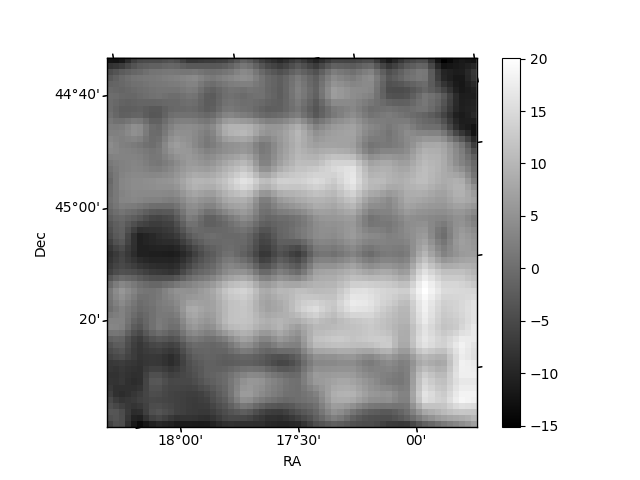
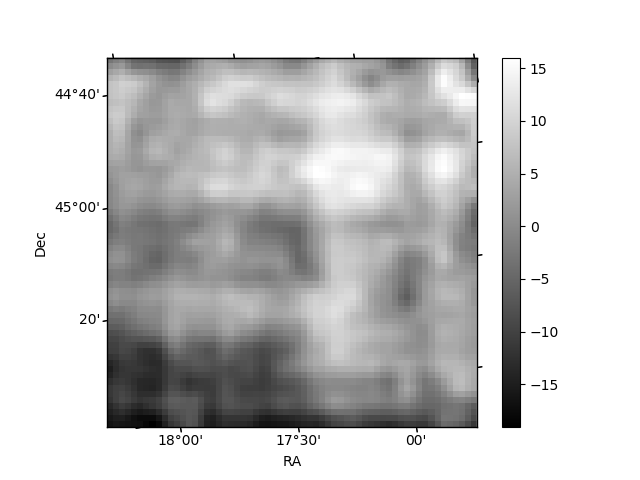
Histogram calculated using DETX and DETY for each event in the final _common_clean file
| Quadrant A | 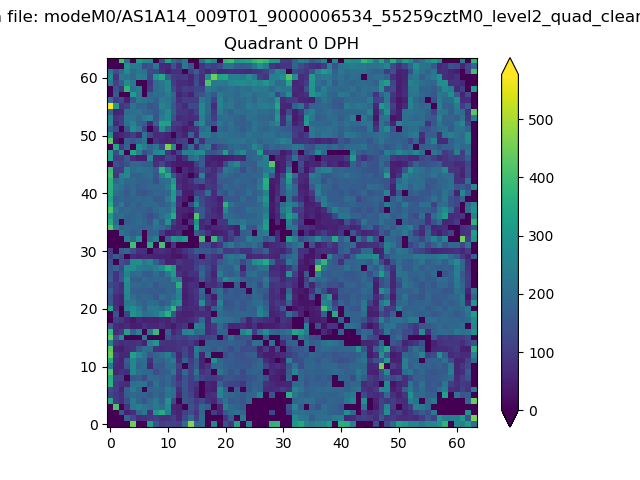 |
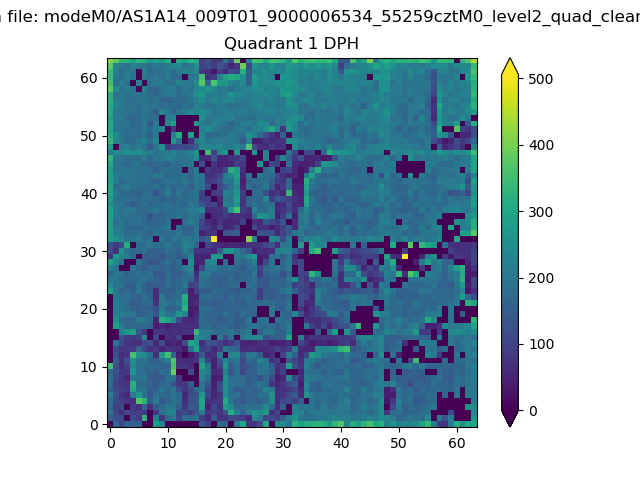 |
Quadrant B |
|---|---|---|---|
| Quadrant D | 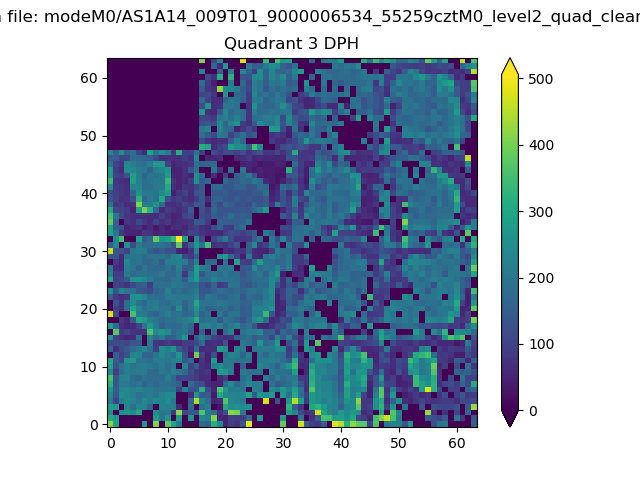 |
 |
Quadrant C |
| Plot type | Count rate plots | Images |
|---|---|---|
| Comparison with Poisson distribution Blue bars denote a histogram of data divided into 1 sec bins. Red curve is a Poisson curve with rate = median count rate of data. |
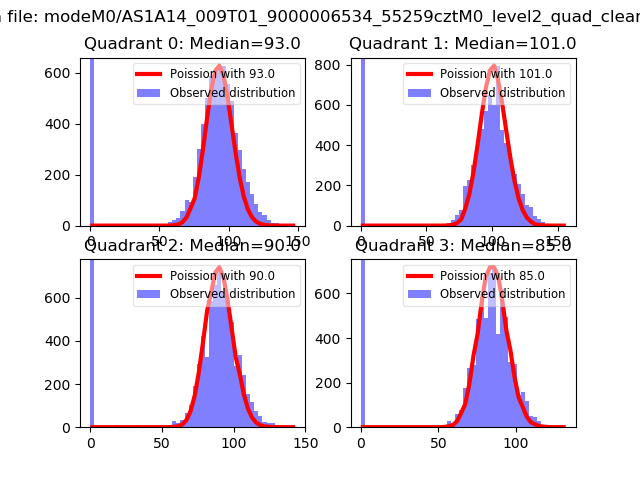 |
 |
| Quadrant-wise count rates Data is divided into 100 sec bins |
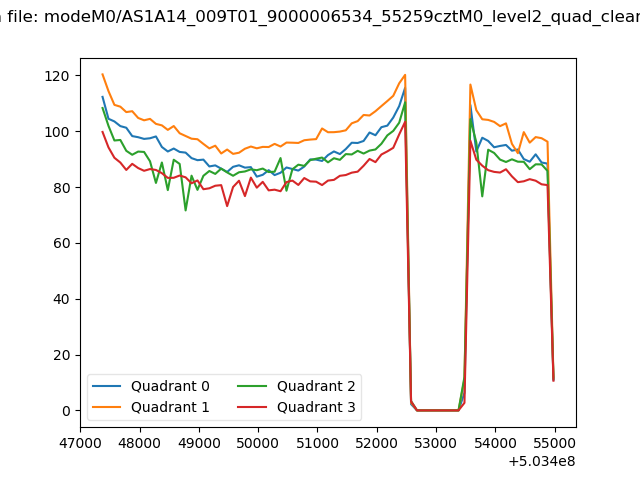 |
|
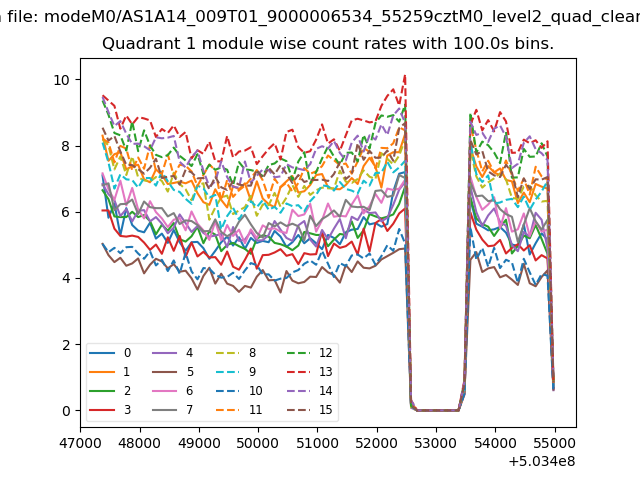
| Module-wise count rates for Quadrant A Data is divided into 100 sec bins |
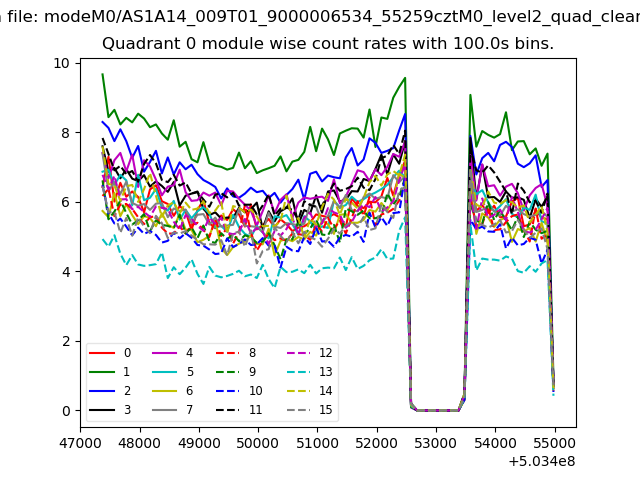 |
 |
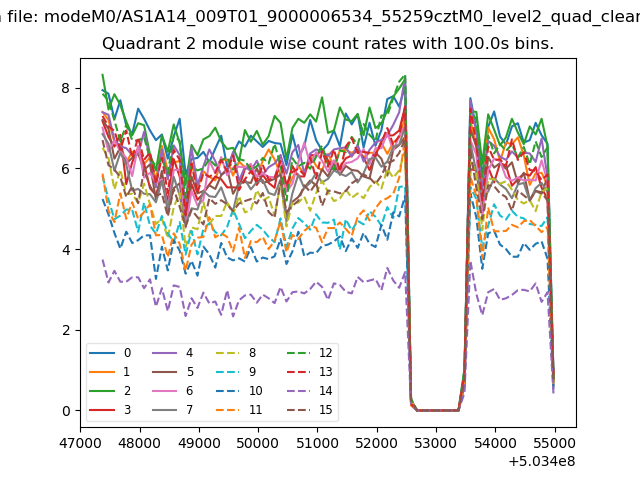
| Module-wise count rates for Quadrant B Data is divided into 100 sec bins |
 |
 |
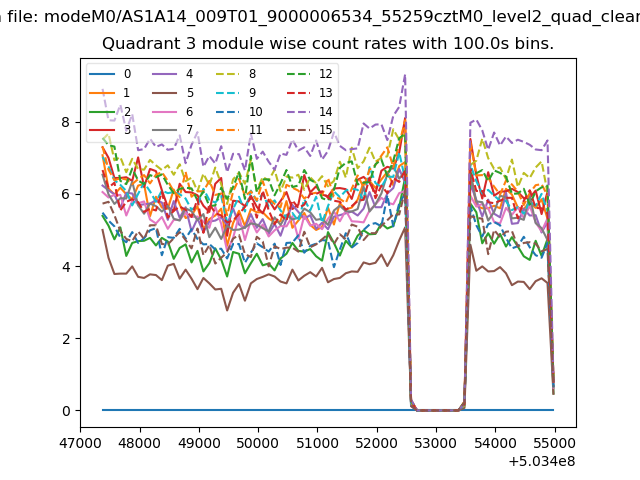
| Module-wise count rates for Quadrant C Data is divided into 100 sec bins |
 |
 |
| Module-wise count rates for Quadrant D Data is divided into 100 sec bins |
 |
 |
| Parameter | Plot |
|---|---|
| CZT HV Monitor | 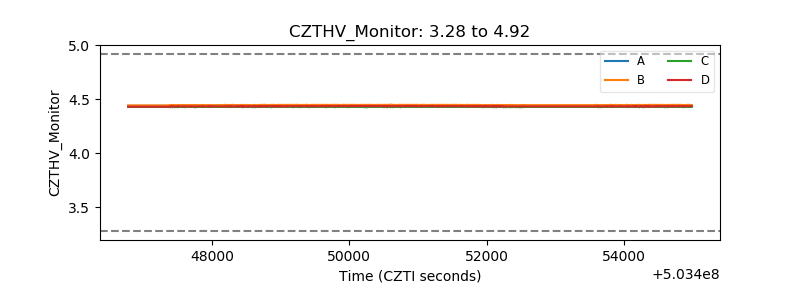 |
| D_VDD | 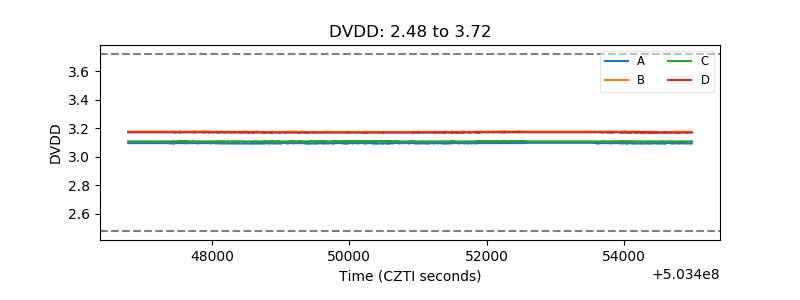 |
| Temperature 1 | 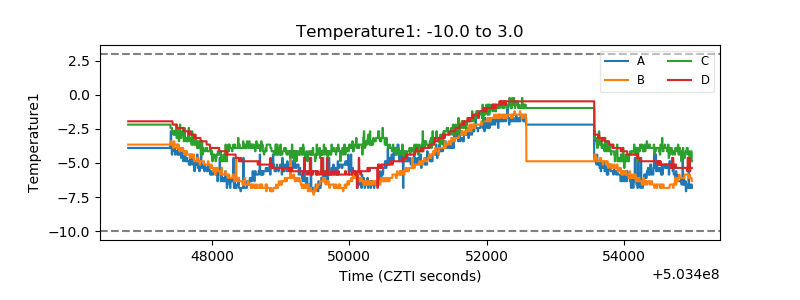 |
| Veto HV Monitor | 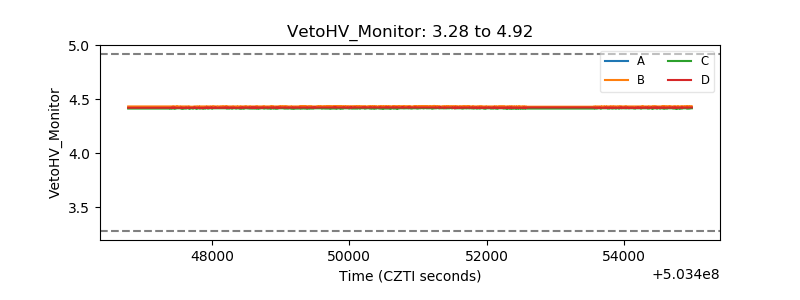 |
| Veto LLD | 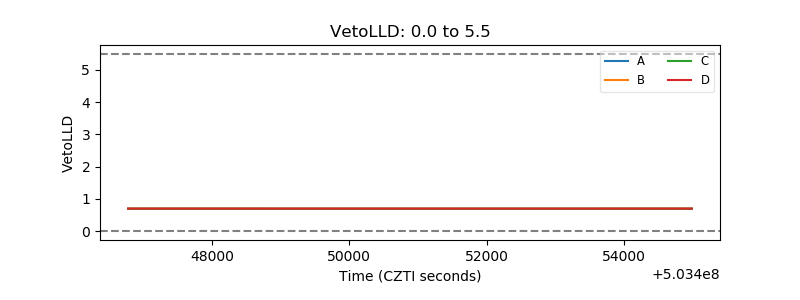 |
| Alpha Counter | 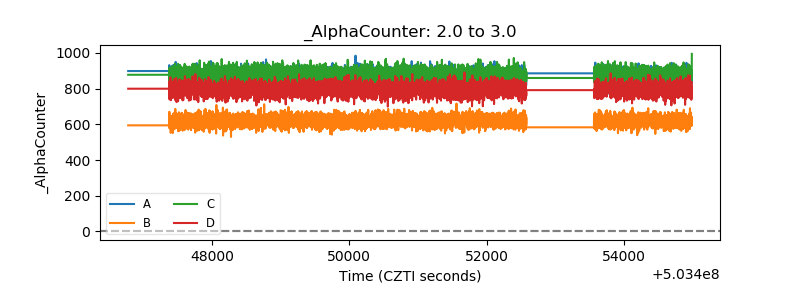 |
| _CPM_Rate | 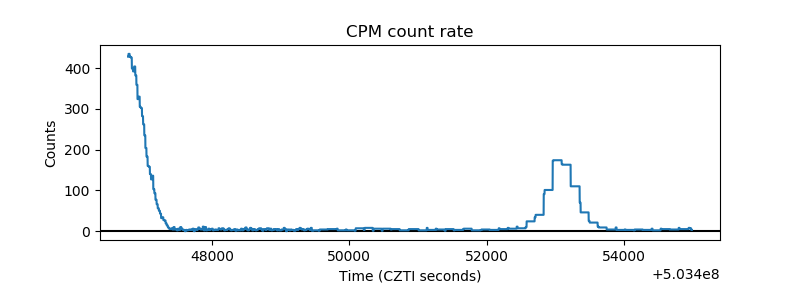 |
| CZT Counter | 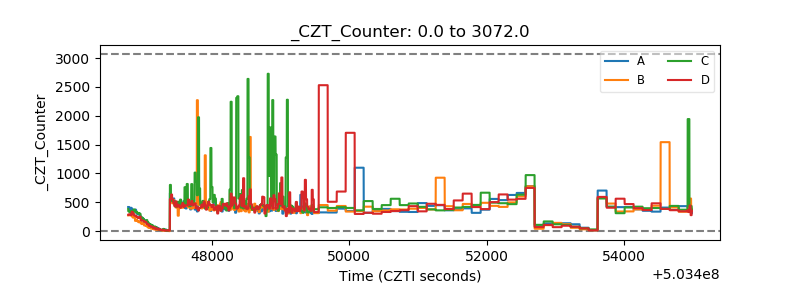 |
| +2.5 Volts monitor |  |
| +5 Volts monitor |  |
| _ROLL_ROT | 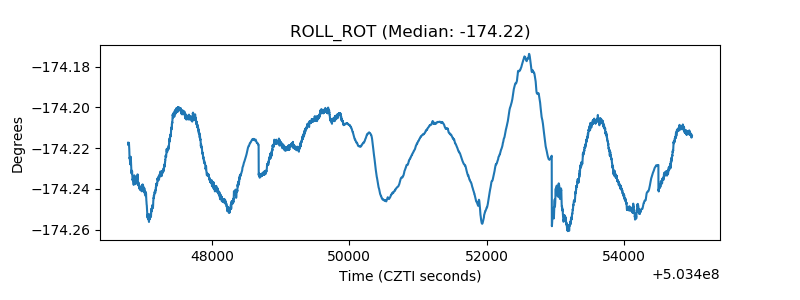 |
| _Roll_DEC | 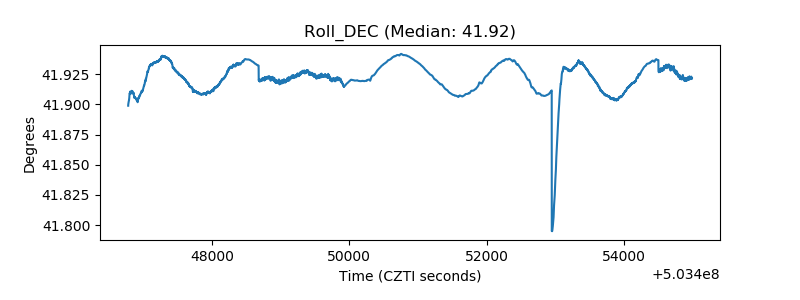 |
| _Roll_RA | 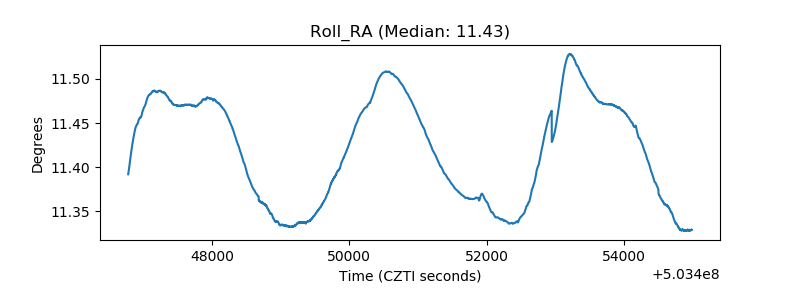 |
| Veto Counter | 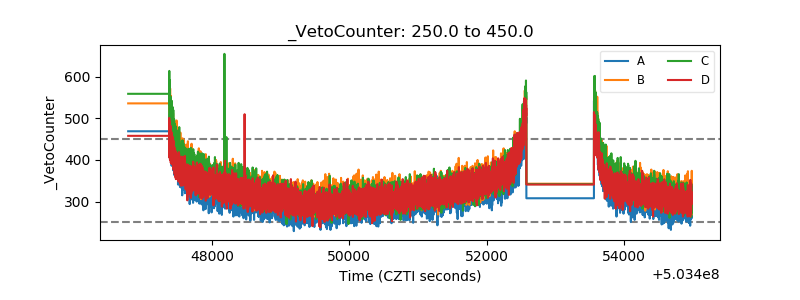 |