| Param | Original file | Final file |
|---|---|---|
| Filename | modeM0/AS1A14_009T01_9000006534_55260cztM0_level2.fits | modeM0/AS1A14_009T01_9000006534_55260cztM0_level2_quad_clean.evt |
| Size (bytes) | 401,817,600 | 103,394,880 |
| Size | 383.2 MB | 98.6 MB |
| Events in quadrant A | 3,520,096 | 660,204 |
| Events in quadrant B | 3,237,200 | 718,020 |
| Events in quadrant C | 3,952,328 | 642,721 |
| Events in quadrant D | 3,603,370 | 607,685 |
| Mode SS | |||
|---|---|---|---|
| Quadrant | BADHDUFLAG | Total packets | Discarded packets |
| A | 0 | 150 | 0 |
| B | 0 | 150 | 0 |
| C | 0 | 150 | 0 |
| D | 0 | 150 | 0 |
| Mode M0 | |||
|---|---|---|---|
| Quadrant | BADHDUFLAG | Total packets | Discarded packets |
| A | 0 | 16032 | 2 |
| B | 0 | 15340 | 2 |
| C | 0 | 17143 | 2 |
| D | 0 | 16121 | 2 |
| Mode M9 | |||
|---|---|---|---|
| Quadrant | BADHDUFLAG | Total packets | Discarded packets |
| A | 0 | 16 | 0 |
| B | 0 | 16 | 0 |
| C | 0 | 16 | 0 |
| D | 0 | 16 | 0 |
| Quadrant | Total seconds | Saturated seconds | Saturation percentage |
|---|---|---|---|
| A | 7206 | 121 | 1.679156% |
| B | 7206 | 87 | 1.207327% |
| C | 7206 | 156 | 2.164863% |
| D | 7207 | 66 | 0.915776% |
Noise dominated data is calculated using 1-second bins in cleaned event files. If a bin has >2000 counts, and if more than 50% of those come from <1% of pixels, then it is considered to be noise-dominated and hence unusable.
| Quadrant | # 1 sec bins | Bins with >0 counts | Bins with >2000 counts | High rate bins dominated by noise | Noise dominated (total time) | Noise dominated (detector-on time) | Marked lightcurve |
|---|---|---|---|---|---|---|---|
| A | 8871 | 7208 | 61 | 61 | 0.69% | 0.85% | 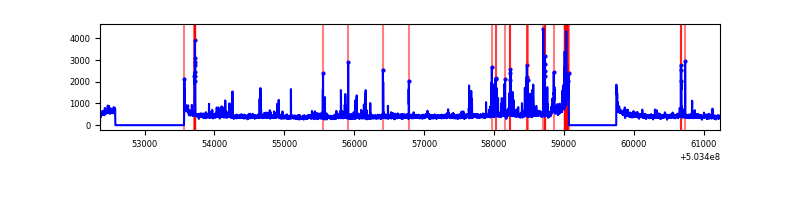 |
| B | 8871 | 7208 | 37 | 37 | 0.42% | 0.51% | 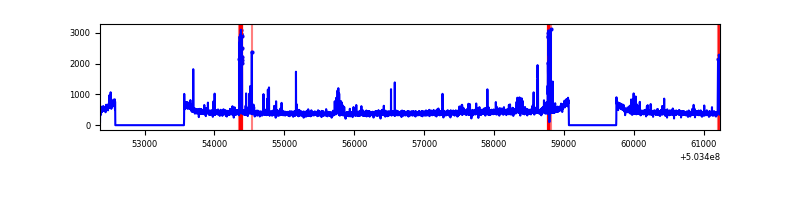 |
| C | 8871 | 7208 | 119 | 119 | 1.34% | 1.65% | 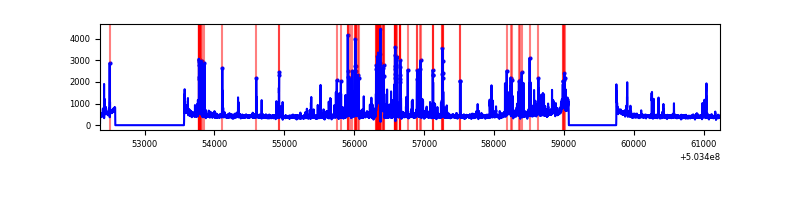 |
| D | 8872 | 7209 | 66 | 66 | 0.74% | 0.92% | 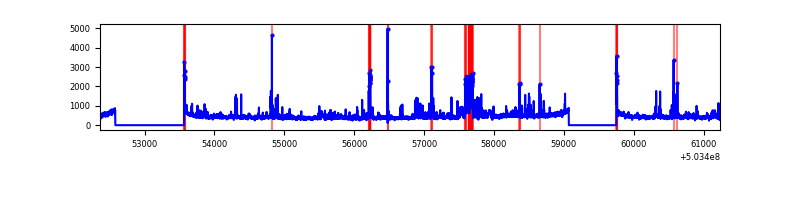 |
Top three noisy pixels from each quadrant. If the there are fewer than three noisy pixels in the level2.evt file, extra rows are filled as -1
| Pixel properties | Quadrant properties | ||||||
|---|---|---|---|---|---|---|---|
| Quadrant | DetID | PixID | Counts | Sigma | Mean | Median | Sigma |
| A | 4 | 249 | 401836 | 2175.35 | 746 | 726 | 184.4 |
| A | 7 | 243 | 86170 | 463.39 | 746 | 726 | 184.4 |
| A | 11 | 191 | 44233 | 235.95 | 746 | 726 | 184.4 |
| B | 5 | 185 | 163058 | 1005.56 | 748 | 720 | 161.4 |
| B | 10 | 245 | 57915 | 354.28 | 748 | 720 | 161.4 |
| B | 0 | 182 | 27395 | 165.23 | 748 | 720 | 161.4 |
| C | 13 | 3 | 403240 | 1973.48 | 739 | 732 | 204.0 |
| C | 12 | 250 | 180334 | 880.58 | 739 | 732 | 204.0 |
| C | 10 | 22 | 174123 | 850.13 | 739 | 732 | 204.0 |
| D | 8 | 160 | 212209 | 1021.4 | 733 | 703 | 207.1 |
| D | 2 | 31 | 114957 | 551.75 | 733 | 703 | 207.1 |
| D | 3 | 12 | 102034 | 489.35 | 733 | 703 | 207.1 |
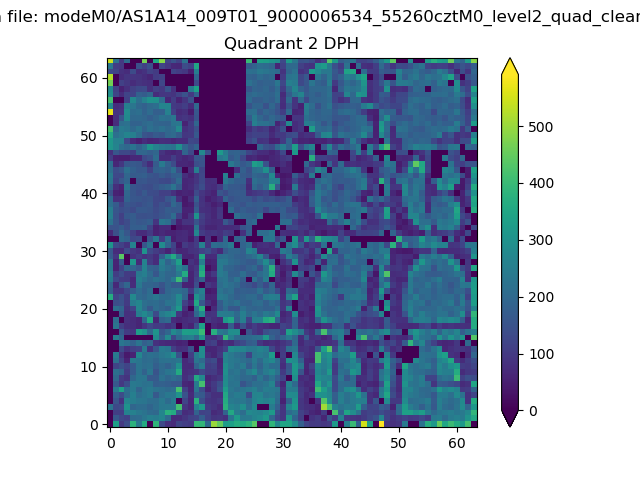
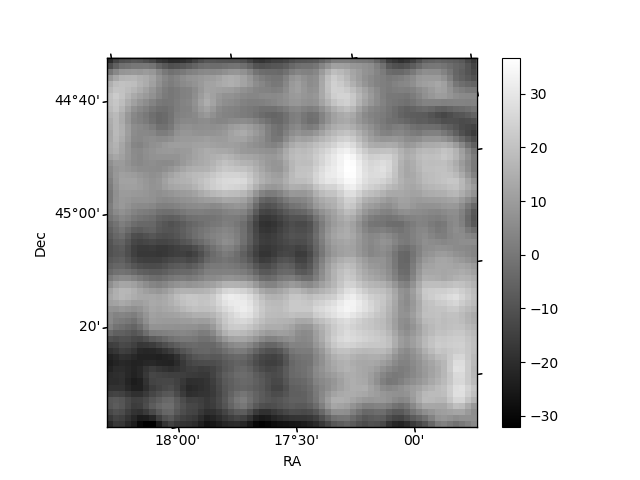
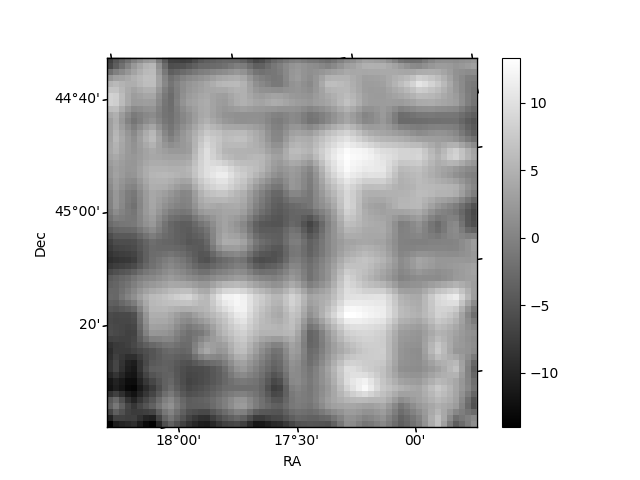
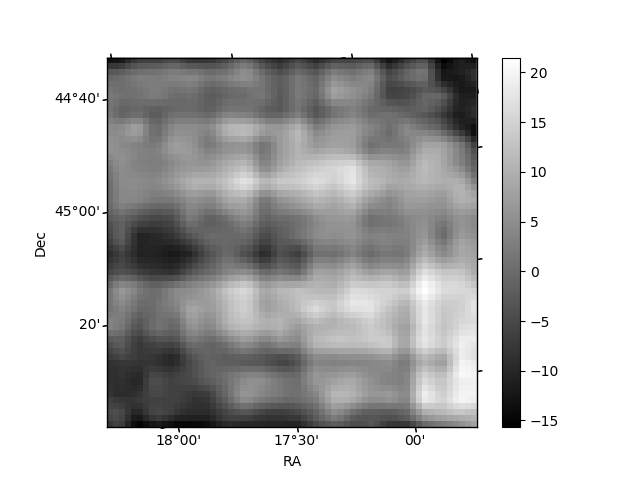
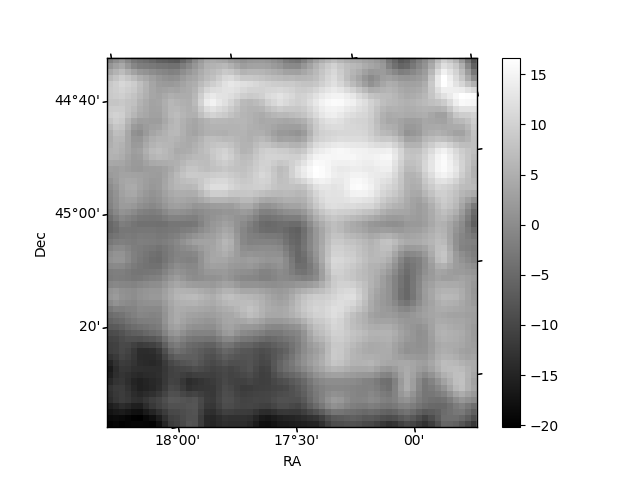
Histogram calculated using DETX and DETY for each event in the final _common_clean file
| Quadrant A | 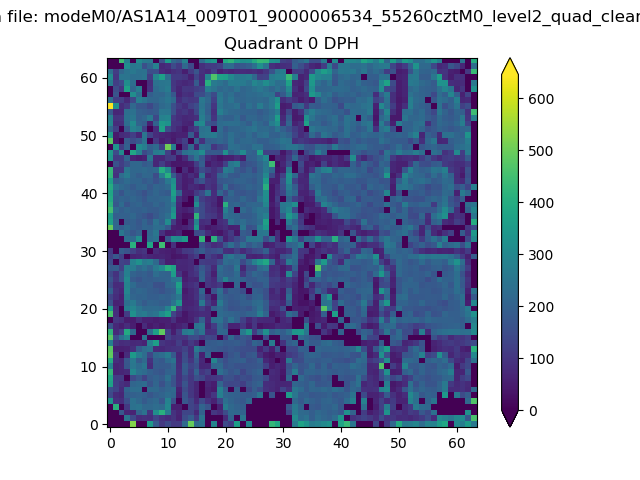 |
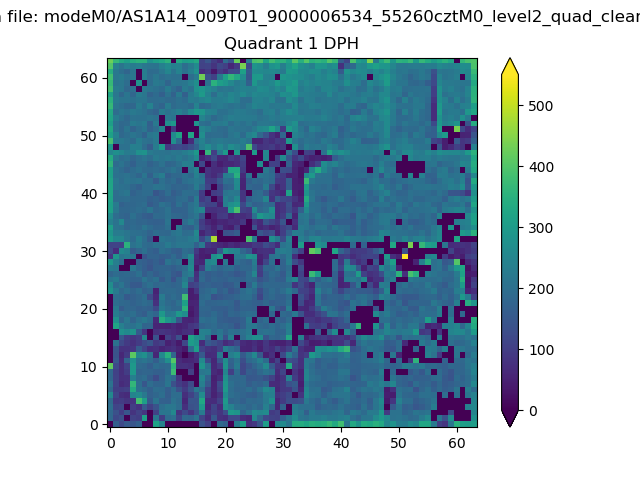 |
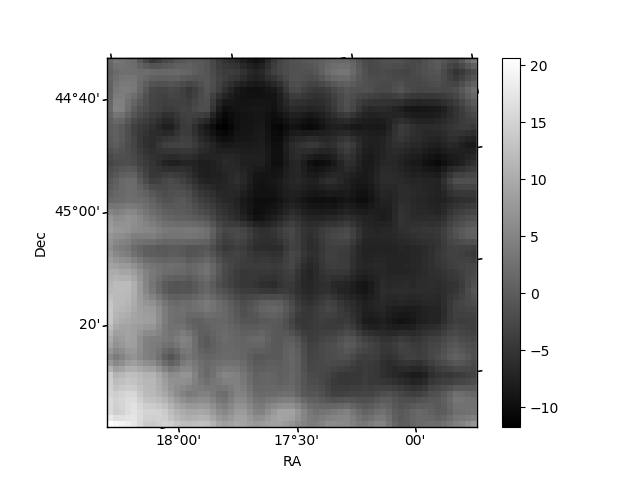
Quadrant B |
|---|---|---|---|
| Quadrant D | 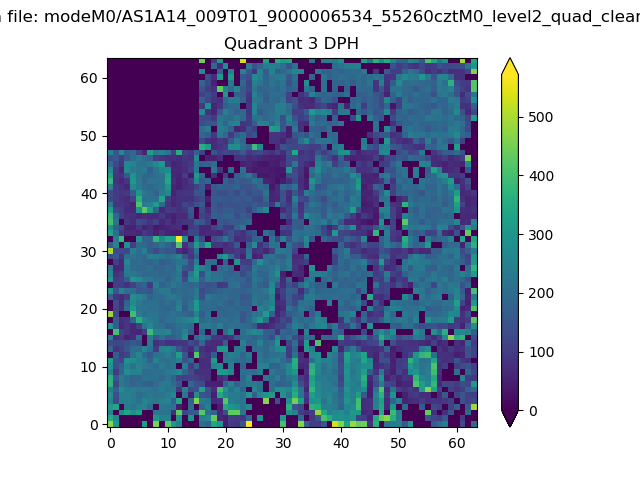 |
 |
Quadrant C |
| Plot type | Count rate plots | Images |
|---|---|---|
| Comparison with Poisson distribution Blue bars denote a histogram of data divided into 1 sec bins. Red curve is a Poisson curve with rate = median count rate of data. |
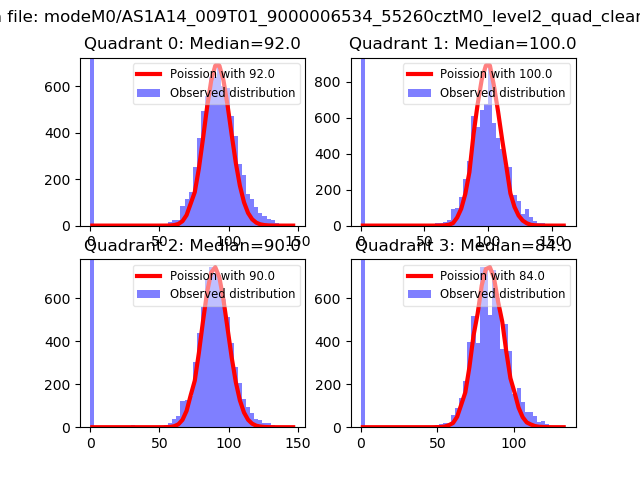 |
 |
| Quadrant-wise count rates Data is divided into 100 sec bins |
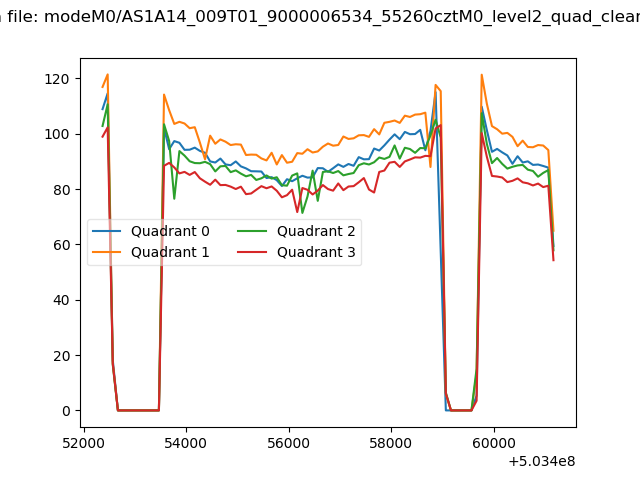 |
|
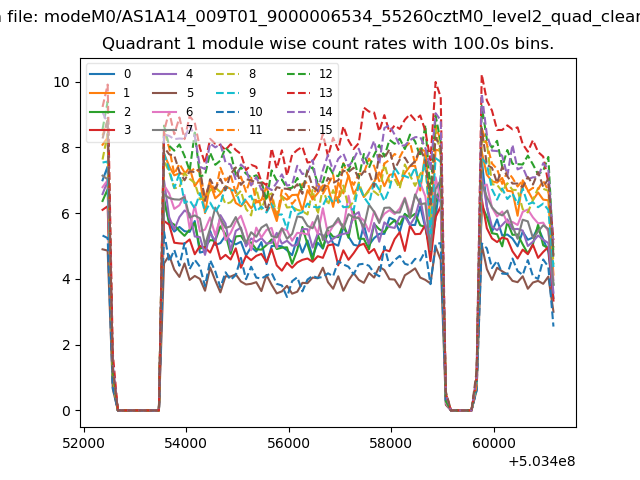
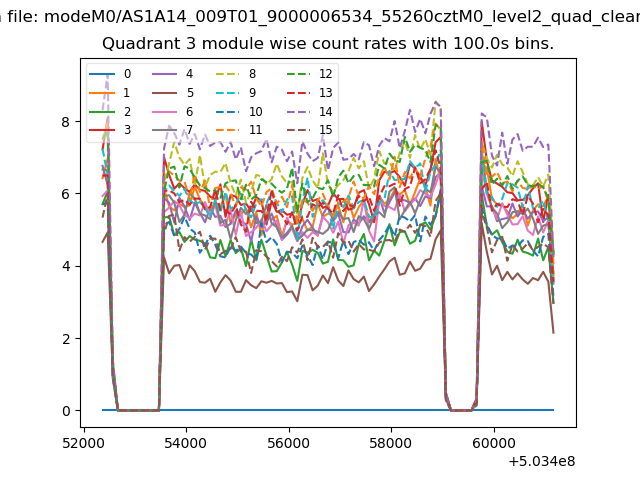
| Module-wise count rates for Quadrant A Data is divided into 100 sec bins |
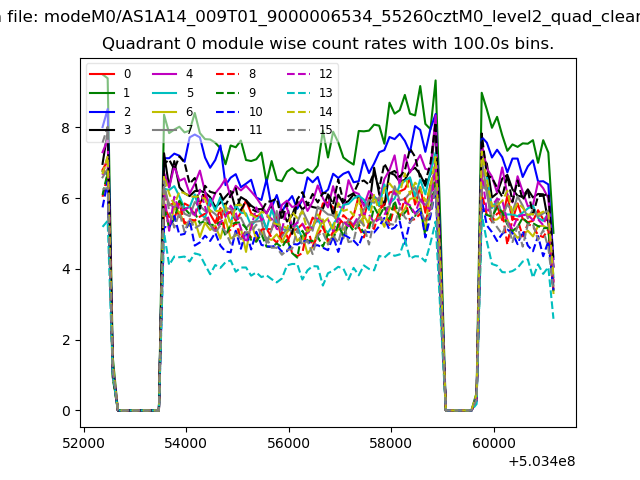 |
 |
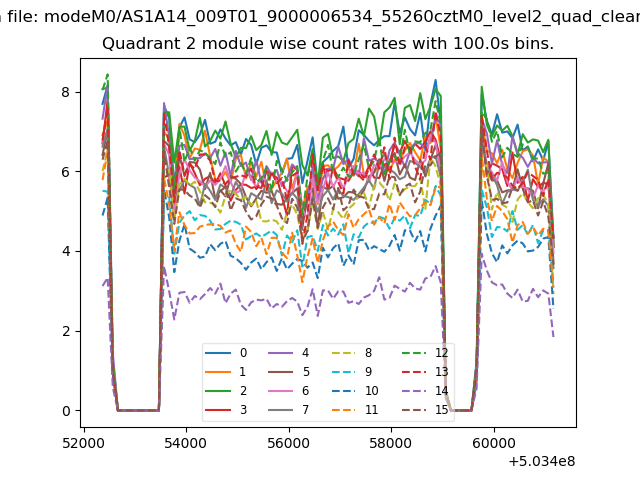
| Module-wise count rates for Quadrant B Data is divided into 100 sec bins |
 |
 |
| Module-wise count rates for Quadrant C Data is divided into 100 sec bins |
 |
 |
| Module-wise count rates for Quadrant D Data is divided into 100 sec bins |
 |
 |
| Parameter | Plot |
|---|---|
| CZT HV Monitor | 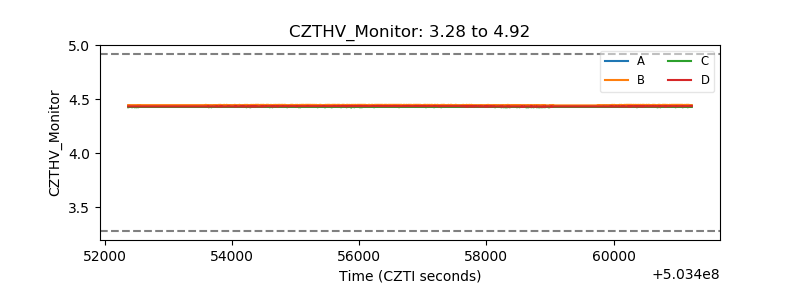 |
| D_VDD | 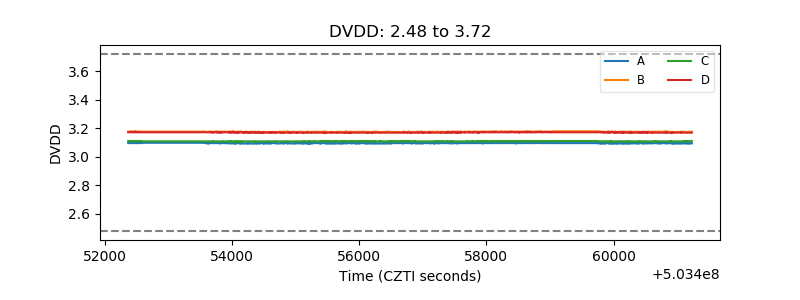 |
| Temperature 1 | 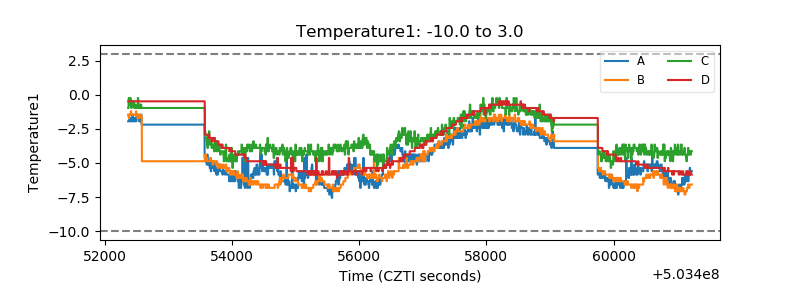 |
| Veto HV Monitor | 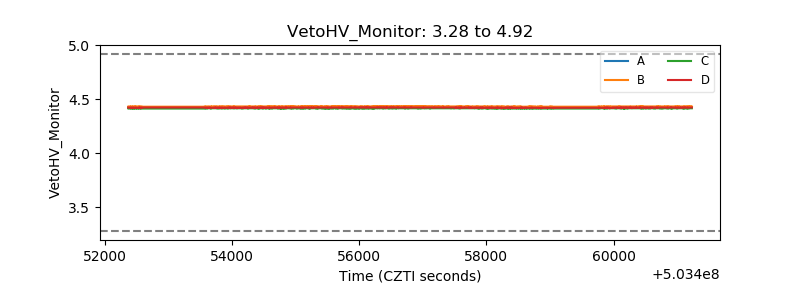 |
| Veto LLD | 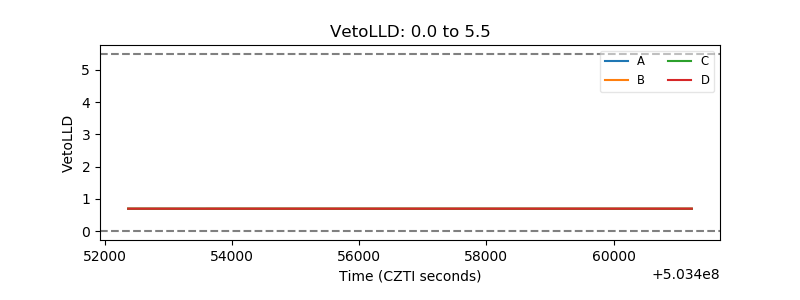 |
| Alpha Counter | 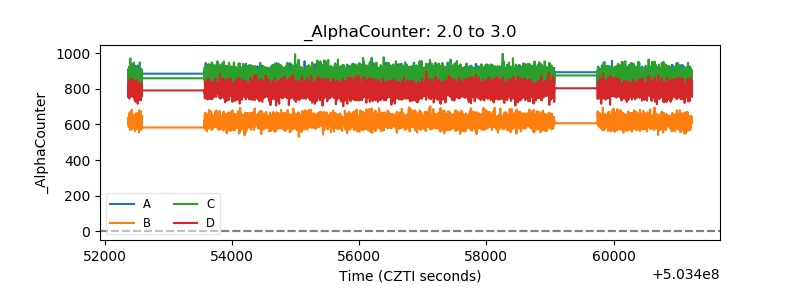 |
| _CPM_Rate | 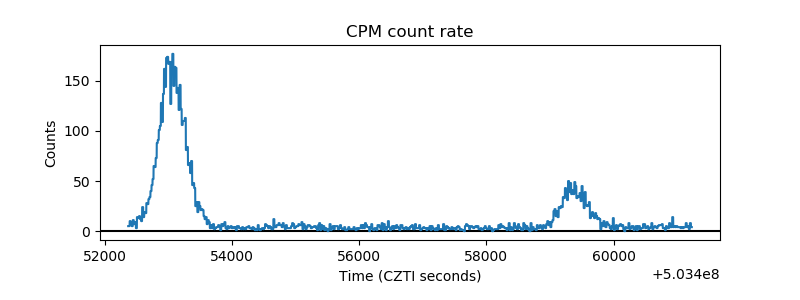 |
| CZT Counter | 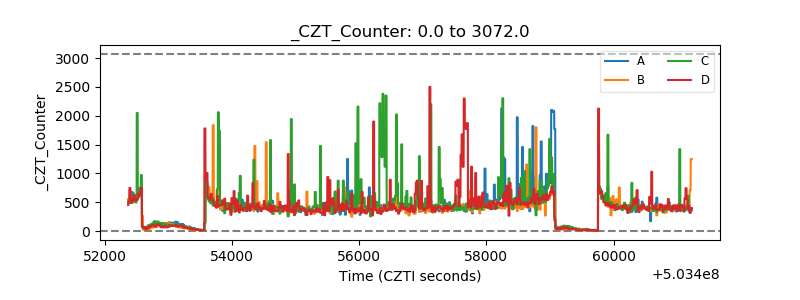 |
| +2.5 Volts monitor |  |
| +5 Volts monitor |  |
| _ROLL_ROT | 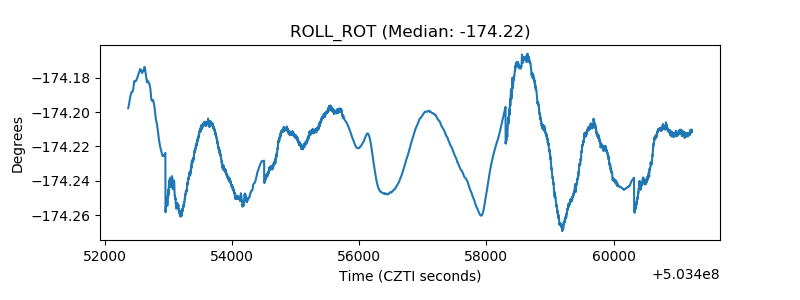 |
| _Roll_DEC | 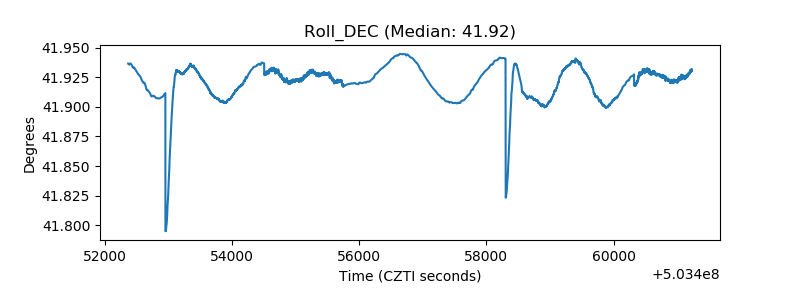 |
| _Roll_RA | 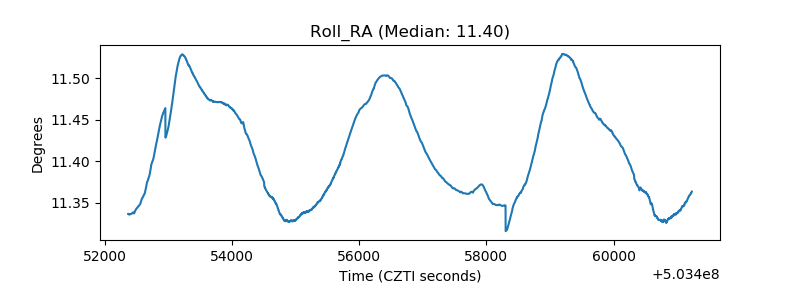 |
| Veto Counter | 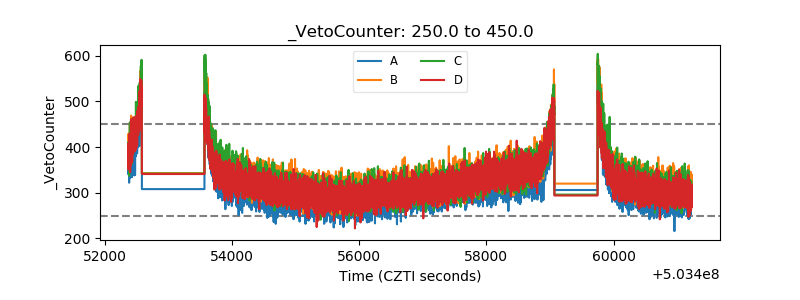 |