| Param | Original file | Final file |
|---|---|---|
| Filename | modeM0/AS1A14_009T01_9000006534_55261cztM0_level2.fits | modeM0/AS1A14_009T01_9000006534_55261cztM0_level2_quad_clean.evt |
| Size (bytes) | 505,224,000 | 126,192,960 |
| Size | 481.8 MB | 120.3 MB |
| Events in quadrant A | 4,334,770 | 809,599 |
| Events in quadrant B | 4,078,173 | 872,630 |
| Events in quadrant C | 4,806,241 | 785,031 |
| Events in quadrant D | 4,799,755 | 744,075 |
| Mode SS | |||
|---|---|---|---|
| Quadrant | BADHDUFLAG | Total packets | Discarded packets |
| A | 0 | 178 | 0 |
| B | 0 | 178 | 0 |
| C | 0 | 178 | 0 |
| D | 0 | 178 | 0 |
| Mode M0 | |||
|---|---|---|---|
| Quadrant | BADHDUFLAG | Total packets | Discarded packets |
| A | 0 | 19622 | 2 |
| B | 0 | 18923 | 2 |
| C | 0 | 20933 | 2 |
| D | 0 | 20757 | 2 |
| Mode M9 | |||
|---|---|---|---|
| Quadrant | BADHDUFLAG | Total packets | Discarded packets |
| A | 0 | 7 | 0 |
| B | 0 | 7 | 0 |
| C | 0 | 7 | 0 |
| D | 0 | 7 | 0 |
| Quadrant | Total seconds | Saturated seconds | Saturation percentage |
|---|---|---|---|
| A | 8784 | 138 | 1.571038% |
| B | 8784 | 192 | 2.185792% |
| C | 8783 | 190 | 2.163270% |
| D | 8784 | 98 | 1.115665% |
Noise dominated data is calculated using 1-second bins in cleaned event files. If a bin has >2000 counts, and if more than 50% of those come from <1% of pixels, then it is considered to be noise-dominated and hence unusable.
| Quadrant | # 1 sec bins | Bins with >0 counts | Bins with >2000 counts | High rate bins dominated by noise | Noise dominated (total time) | Noise dominated (detector-on time) | Marked lightcurve |
|---|---|---|---|---|---|---|---|
| A | 9479 | 8786 | 60 | 60 | 0.63% | 0.68% | 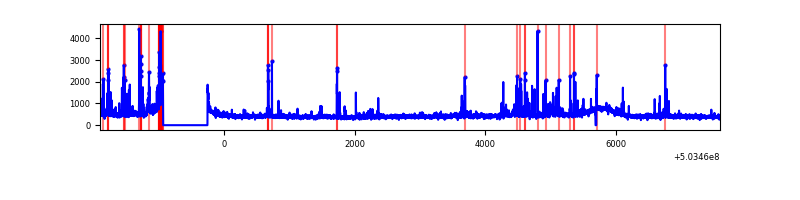 |
| B | 9479 | 8786 | 33 | 33 | 0.35% | 0.38% | 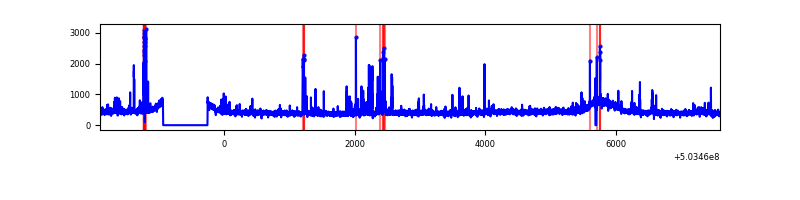 |
| C | 9478 | 8785 | 130 | 130 | 1.37% | 1.48% | 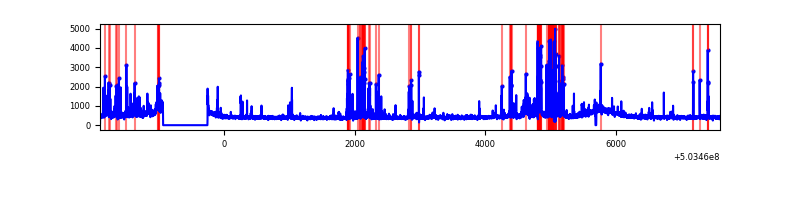 |
| D | 9479 | 8786 | 67 | 67 | 0.71% | 0.76% | 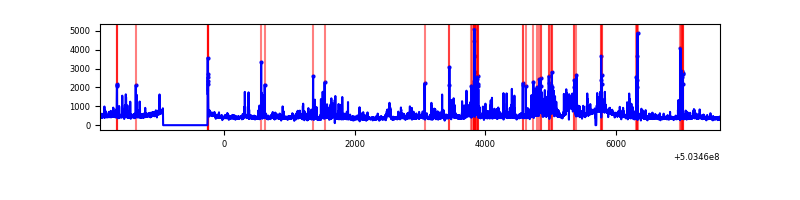 |
Top three noisy pixels from each quadrant. If the there are fewer than three noisy pixels in the level2.evt file, extra rows are filled as -1
| Pixel properties | Quadrant properties | ||||||
|---|---|---|---|---|---|---|---|
| Quadrant | DetID | PixID | Counts | Sigma | Mean | Median | Sigma |
| A | 4 | 249 | 349142 | 1522.57 | 940 | 918 | 228.7 |
| A | 11 | 191 | 76371 | 329.91 | 940 | 918 | 228.7 |
| A | 0 | 8 | 69477 | 299.77 | 940 | 918 | 228.7 |
| B | 5 | 185 | 256514 | 1273.45 | 939 | 905 | 200.7 |
| B | 10 | 245 | 60110 | 294.96 | 939 | 905 | 200.7 |
| B | 0 | 182 | 25785 | 123.95 | 939 | 905 | 200.7 |
| C | 13 | 3 | 624252 | 2444.0 | 929 | 918 | 255.0 |
| C | 10 | 22 | 173264 | 675.74 | 929 | 918 | 255.0 |
| C | 12 | 252 | 111522 | 433.66 | 929 | 918 | 255.0 |
| D | 3 | 12 | 495302 | 1925.97 | 921 | 881 | 256.7 |
| D | 7 | 96 | 214595 | 832.5 | 921 | 881 | 256.7 |
| D | 2 | 207 | 107894 | 416.86 | 921 | 881 | 256.7 |
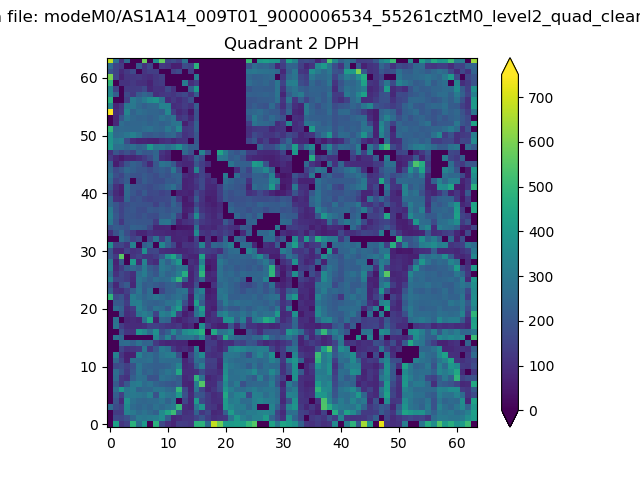
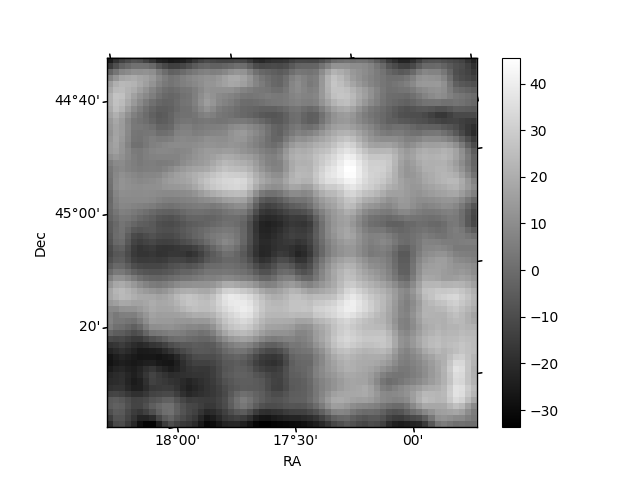
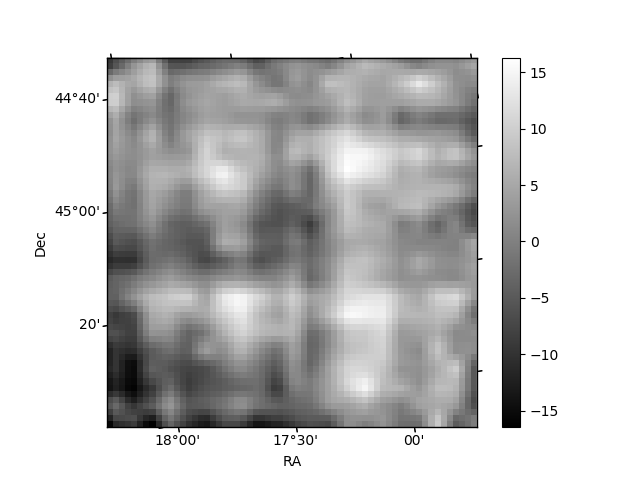
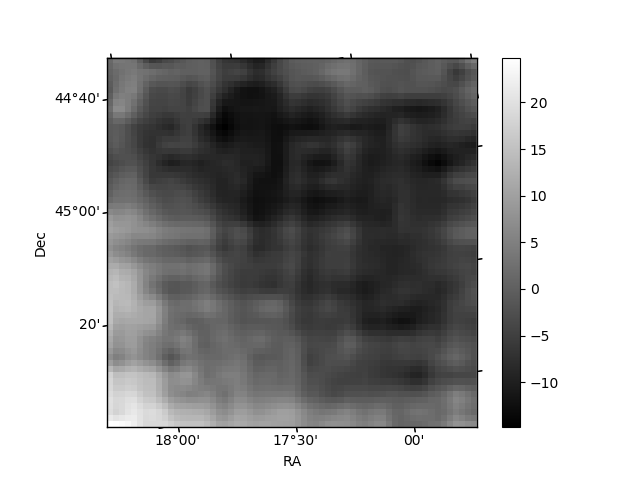
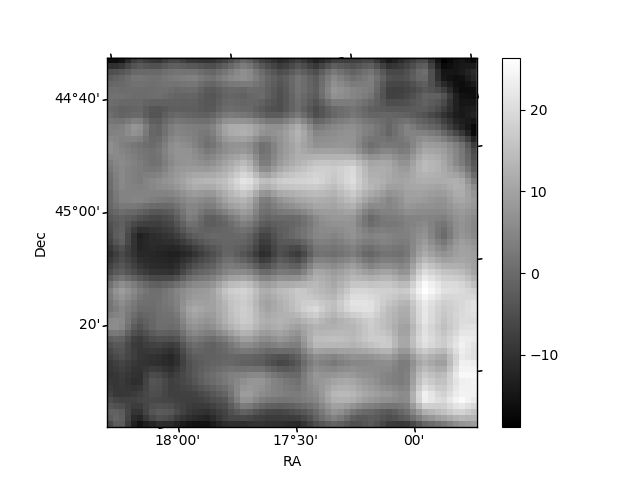
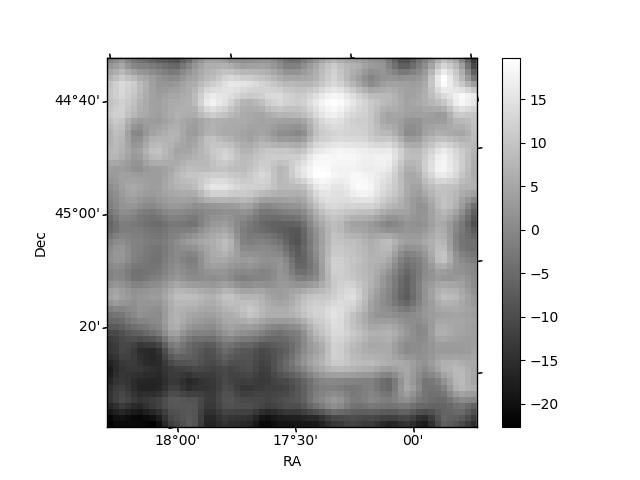
Histogram calculated using DETX and DETY for each event in the final _common_clean file
| Quadrant A | 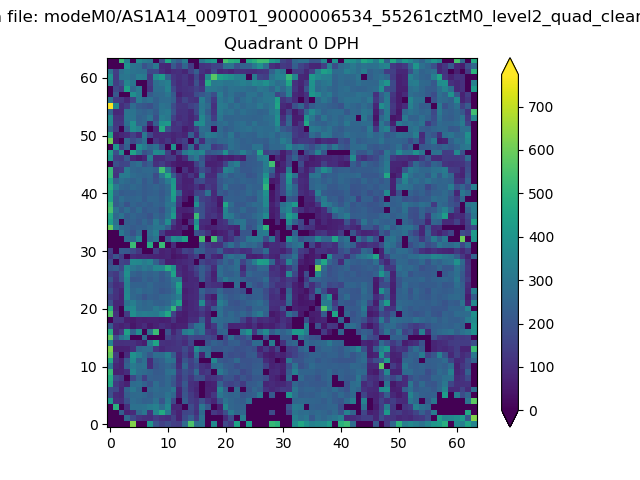 |
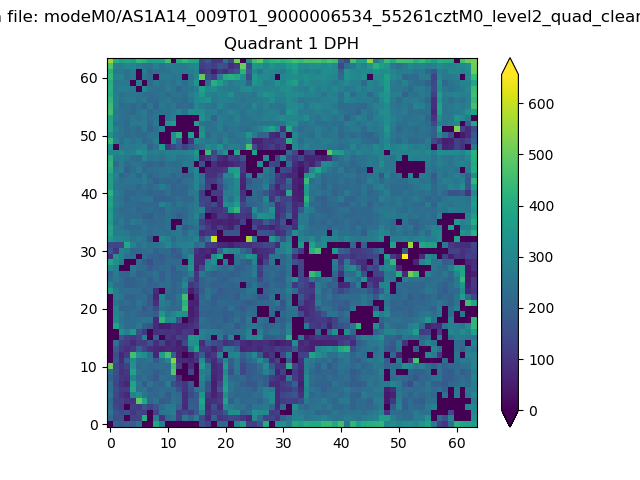 |
Quadrant B |
|---|---|---|---|
| Quadrant D | 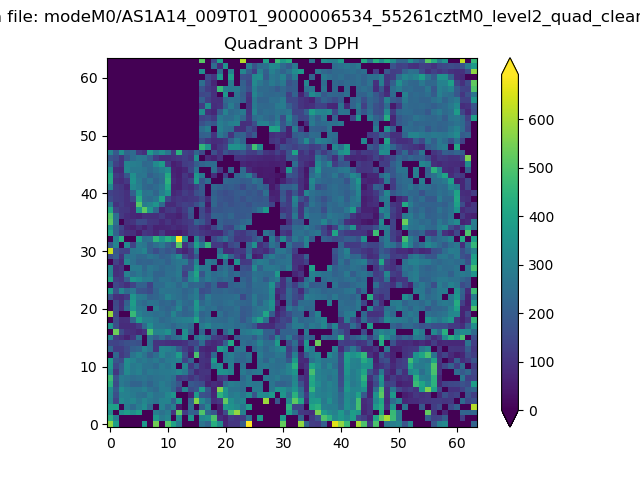 |
 |
Quadrant C |
| Plot type | Count rate plots | Images |
|---|---|---|
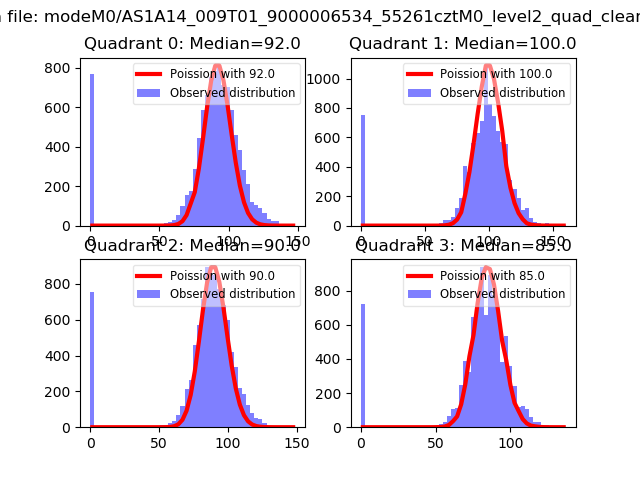
| Comparison with Poisson distribution Blue bars denote a histogram of data divided into 1 sec bins. Red curve is a Poisson curve with rate = median count rate of data. |
 |
 |
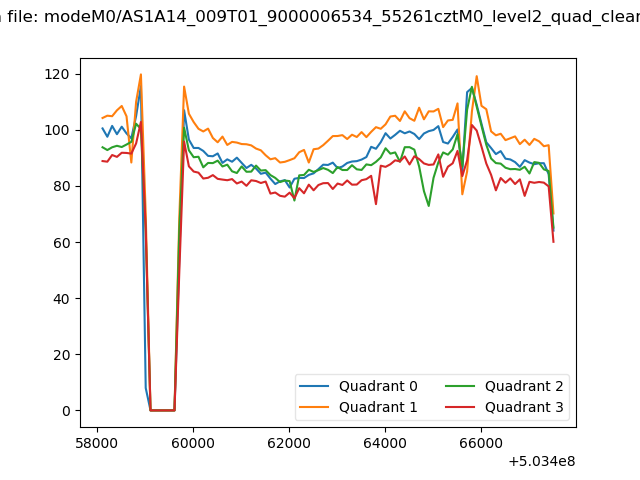
| Quadrant-wise count rates Data is divided into 100 sec bins |
 |
|
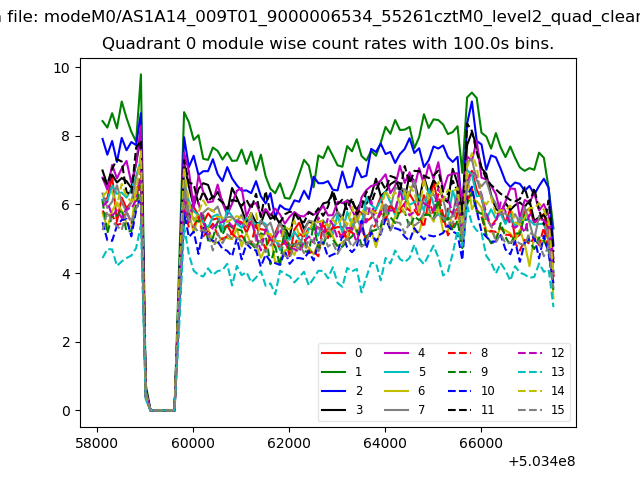
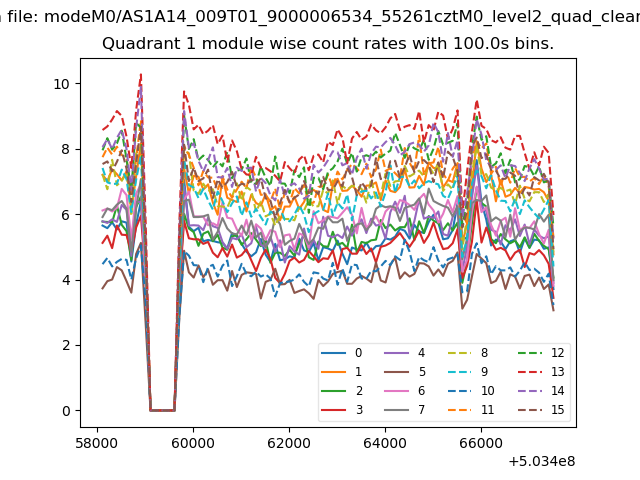
| Module-wise count rates for Quadrant A Data is divided into 100 sec bins |
 |
 |
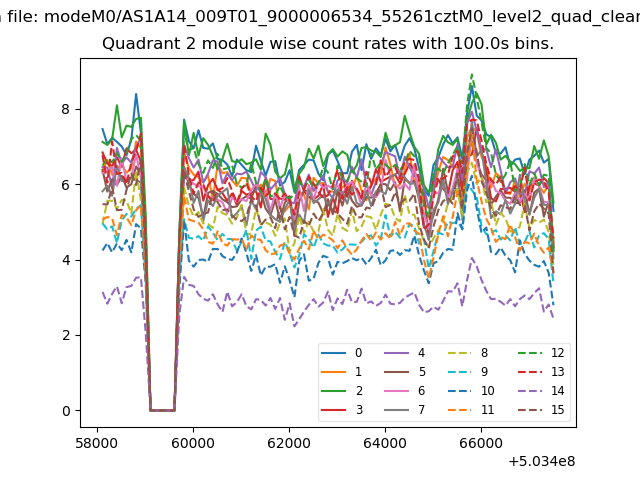
| Module-wise count rates for Quadrant B Data is divided into 100 sec bins |
 |
 |
| Module-wise count rates for Quadrant C Data is divided into 100 sec bins |
 |
 |
| Module-wise count rates for Quadrant D Data is divided into 100 sec bins |
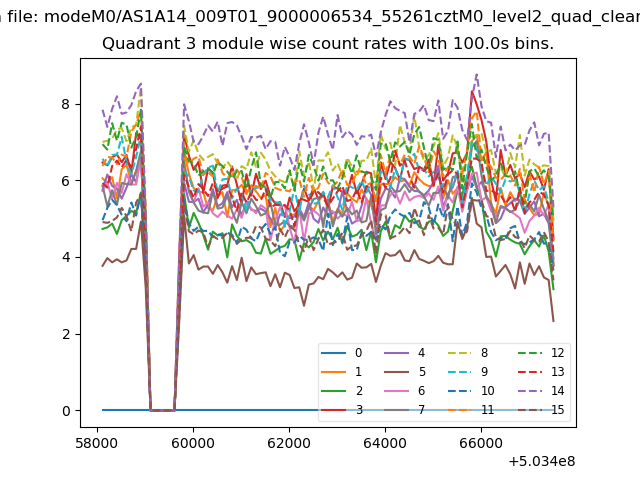 |
 |
| Parameter | Plot |
|---|---|
| CZT HV Monitor | 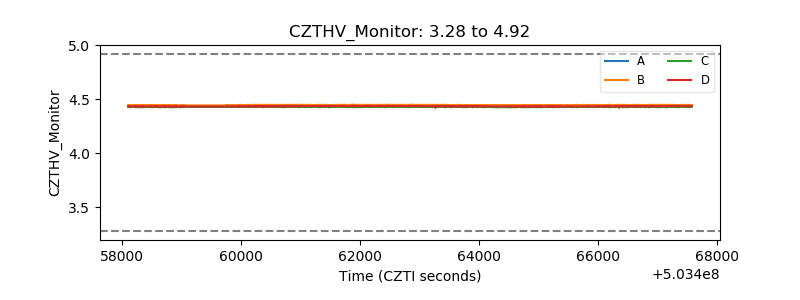 |
| D_VDD | 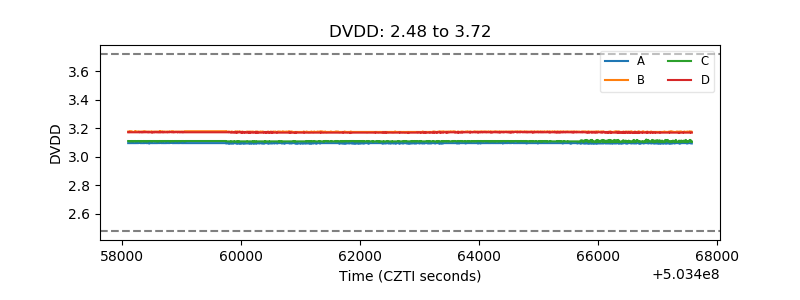 |
| Temperature 1 | 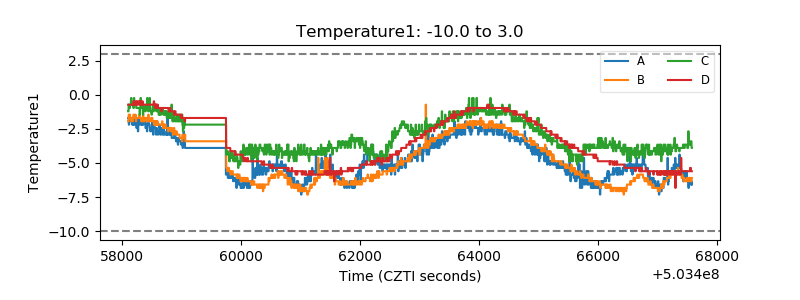 |
| Veto HV Monitor | 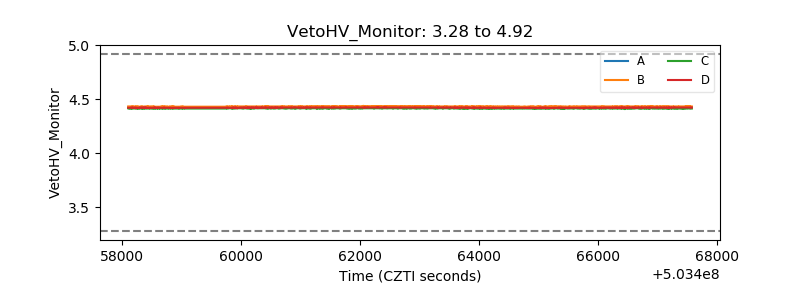 |
| Veto LLD | 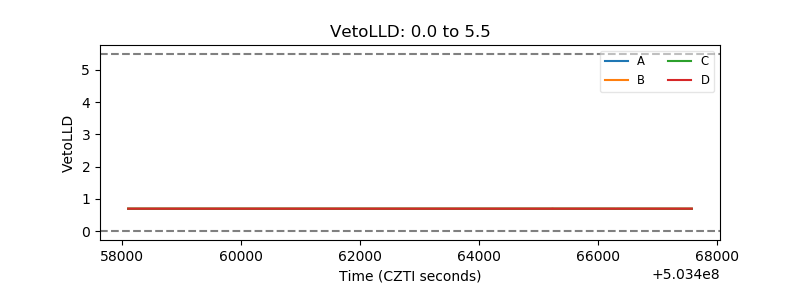 |
| Alpha Counter | 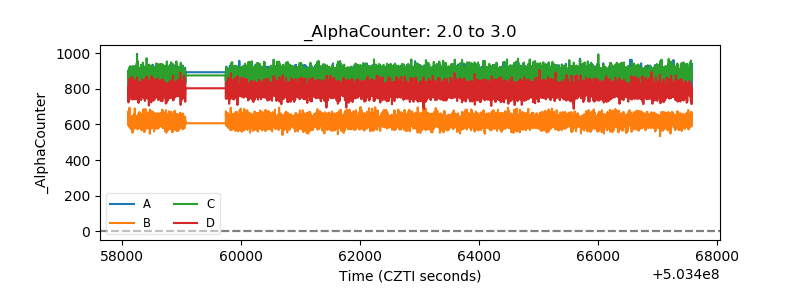 |
| _CPM_Rate | 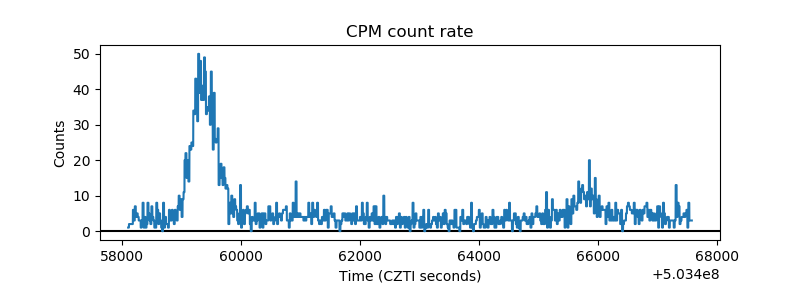 |
| CZT Counter | 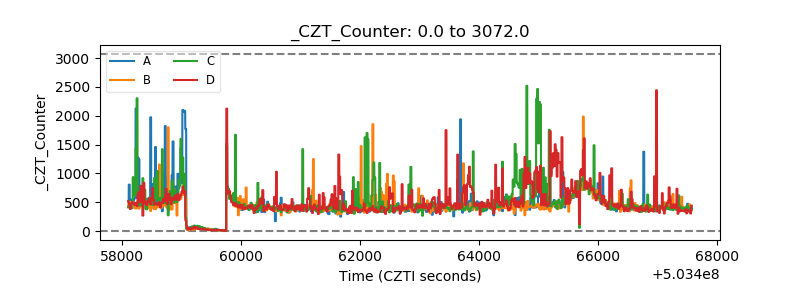 |
| +2.5 Volts monitor |  |
| +5 Volts monitor |  |
| _ROLL_ROT | 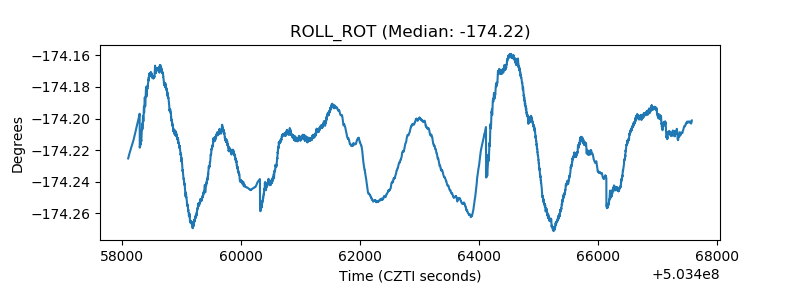 |
| _Roll_DEC | 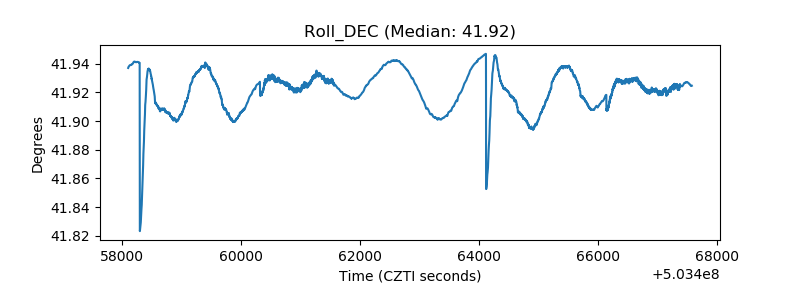 |
| _Roll_RA | 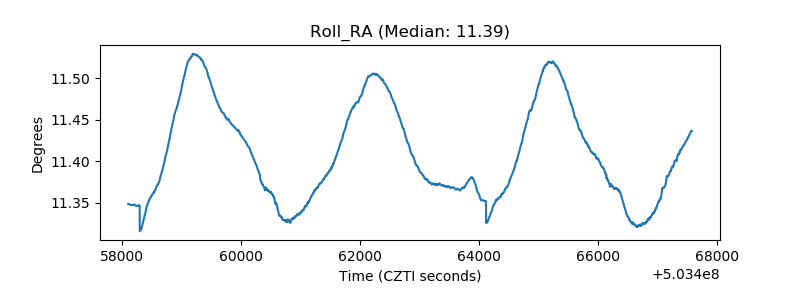 |
| Veto Counter | 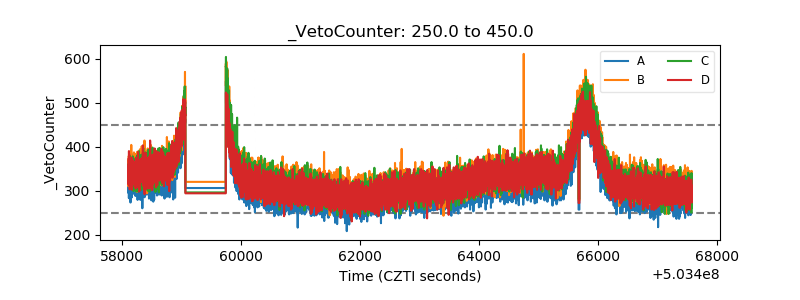 |