| Param | Original file | Final file |
|---|---|---|
| Filename | modeM0/AS1A14_009T01_9000006534_55262cztM0_level2.fits | modeM0/AS1A14_009T01_9000006534_55262cztM0_level2_quad_clean.evt |
| Size (bytes) | 469,235,520 | 121,633,920 |
| Size | 447.5 MB | 116.0 MB |
| Events in quadrant A | 3,830,362 | 785,200 |
| Events in quadrant B | 4,046,635 | 830,438 |
| Events in quadrant C | 4,635,288 | 757,569 |
| Events in quadrant D | 4,193,929 | 717,282 |
| Mode SS | |||
|---|---|---|---|
| Quadrant | BADHDUFLAG | Total packets | Discarded packets |
| A | 0 | 172 | 0 |
| B | 0 | 172 | 0 |
| C | 0 | 172 | 0 |
| D | 0 | 172 | 0 |
| Mode M0 | |||
|---|---|---|---|
| Quadrant | BADHDUFLAG | Total packets | Discarded packets |
| A | 0 | 18000 | 1 |
| B | 0 | 18635 | 1 |
| C | 0 | 20112 | 1 |
| D | 0 | 19045 | 1 |
| Quadrant | Total seconds | Saturated seconds | Saturation percentage |
|---|---|---|---|
| A | 8527 | 47 | 0.551190% |
| B | 8527 | 255 | 2.990501% |
| C | 8528 | 149 | 1.747186% |
| D | 8527 | 89 | 1.043743% |
Noise dominated data is calculated using 1-second bins in cleaned event files. If a bin has >2000 counts, and if more than 50% of those come from <1% of pixels, then it is considered to be noise-dominated and hence unusable.
| Quadrant | # 1 sec bins | Bins with >0 counts | Bins with >2000 counts | High rate bins dominated by noise | Noise dominated (total time) | Noise dominated (detector-on time) | Marked lightcurve |
|---|---|---|---|---|---|---|---|
| A | 8542 | 8528 | 13 | 13 | 0.15% | 0.15% | 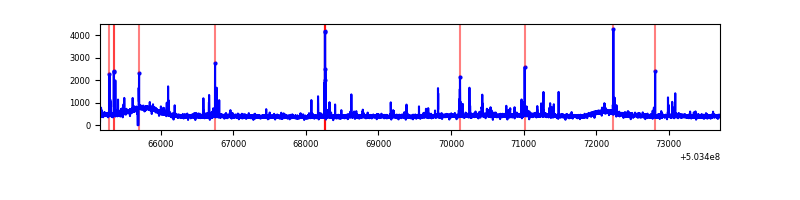 |
| B | 8542 | 8528 | 50 | 50 | 0.59% | 0.59% | 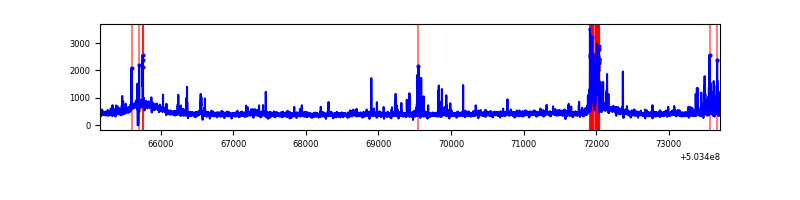 |
| C | 8543 | 8529 | 120 | 120 | 1.40% | 1.41% | 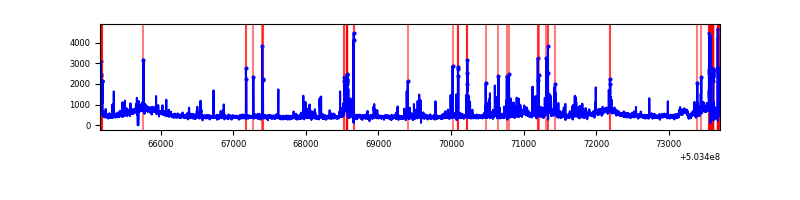 |
| D | 8542 | 8528 | 48 | 48 | 0.56% | 0.56% | 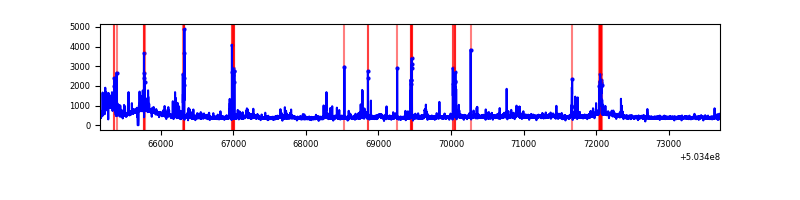 |
Top three noisy pixels from each quadrant. If the there are fewer than three noisy pixels in the level2.evt file, extra rows are filled as -1
| Pixel properties | Quadrant properties | ||||||
|---|---|---|---|---|---|---|---|
| Quadrant | DetID | PixID | Counts | Sigma | Mean | Median | Sigma |
| A | 4 | 249 | 91275 | 401.47 | 917 | 893 | 225.1 |
| A | 0 | 8 | 50364 | 219.74 | 917 | 893 | 225.1 |
| A | 4 | 3 | 46811 | 203.96 | 917 | 893 | 225.1 |
| B | 5 | 185 | 399065 | 2032.85 | 907 | 873 | 195.9 |
| B | 10 | 247 | 36671 | 182.76 | 907 | 873 | 195.9 |
| B | 12 | 111 | 24299 | 119.59 | 907 | 873 | 195.9 |
| C | 10 | 22 | 286964 | 1159.89 | 899 | 890 | 246.6 |
| C | 13 | 3 | 285279 | 1153.06 | 899 | 890 | 246.6 |
| C | 12 | 252 | 164023 | 661.43 | 899 | 890 | 246.6 |
| D | 3 | 12 | 123852 | 493.66 | 893 | 855 | 249.2 |
| D | 7 | 96 | 120798 | 481.41 | 893 | 855 | 249.2 |
| D | 6 | 46 | 115415 | 459.8 | 893 | 855 | 249.2 |
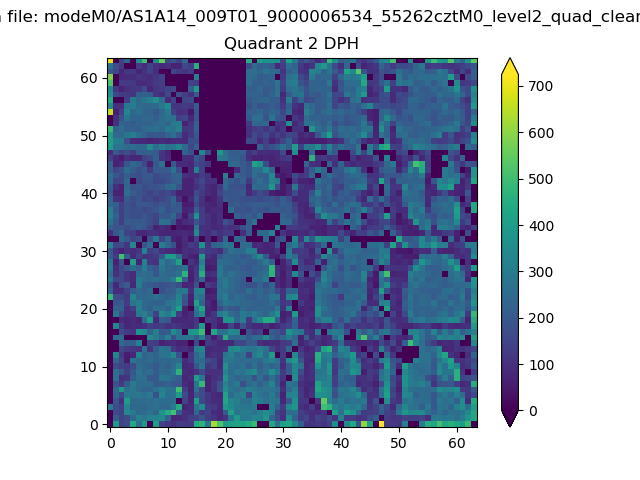
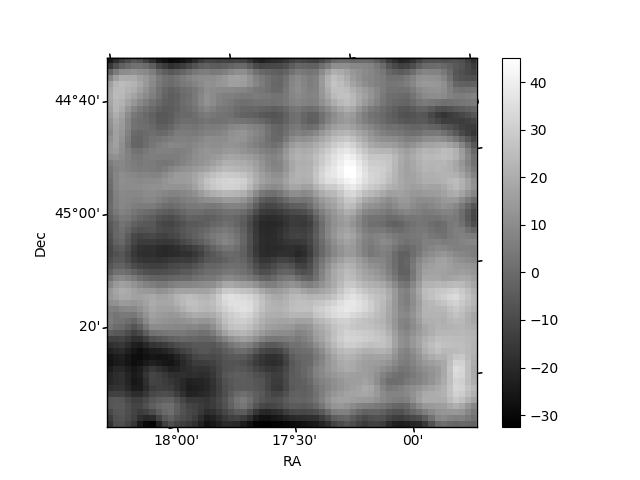
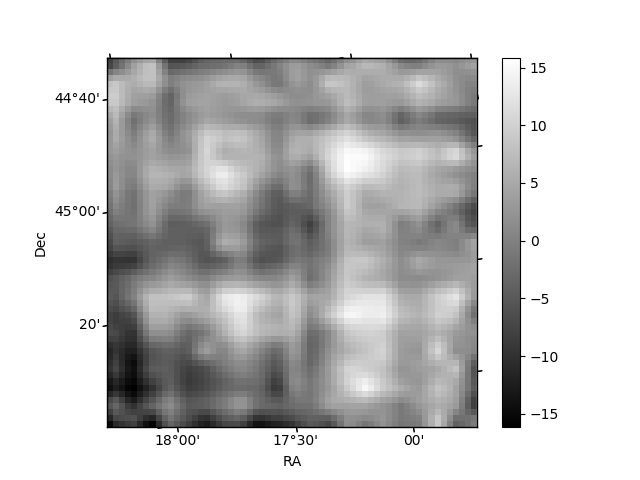
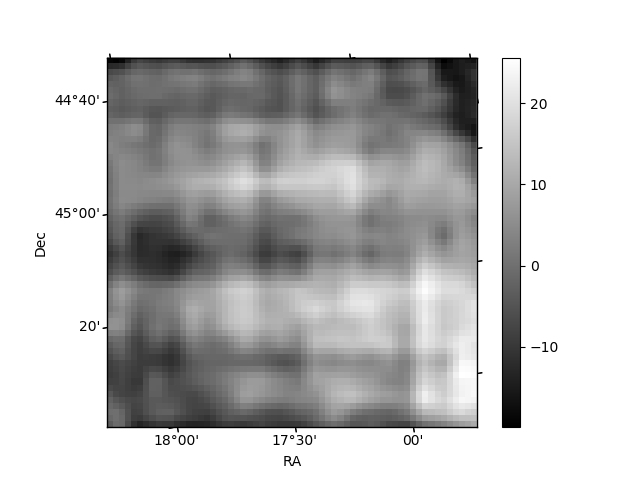
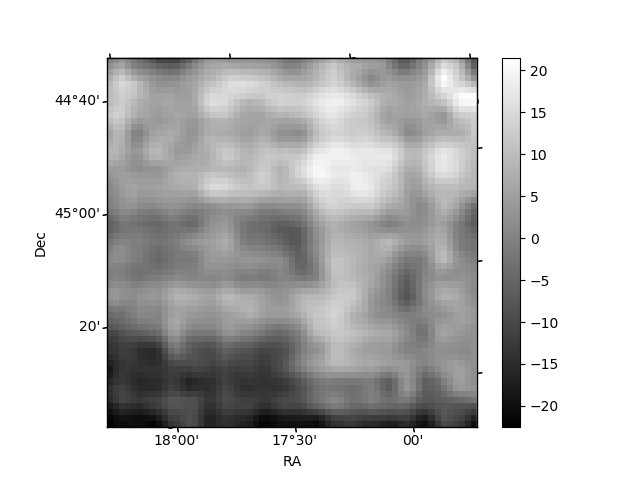
Histogram calculated using DETX and DETY for each event in the final _common_clean file
| Quadrant A | 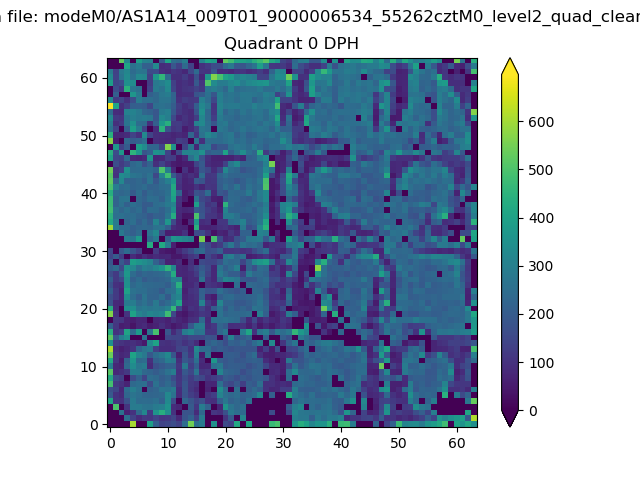 |
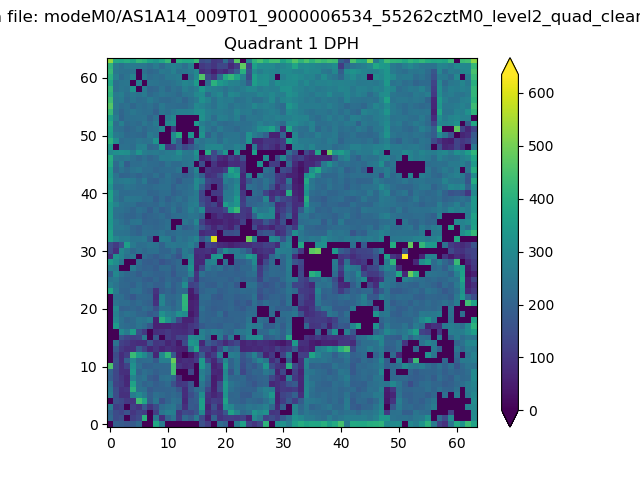 |
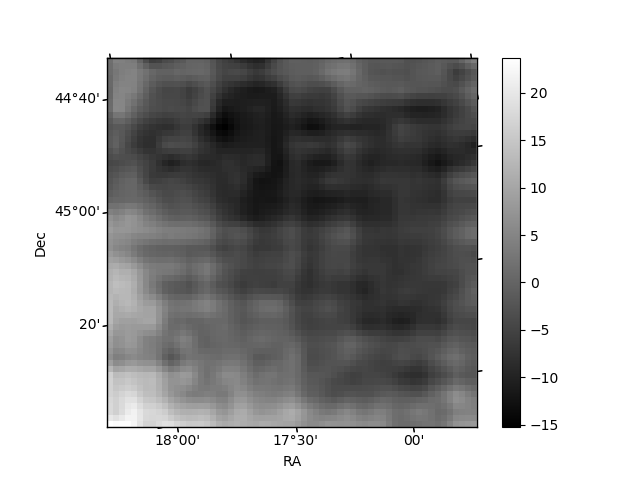
Quadrant B |
|---|---|---|---|
| Quadrant D | 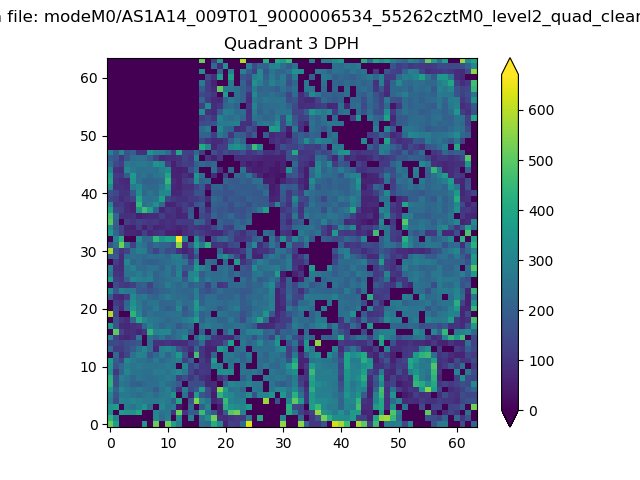 |
 |
Quadrant C |
| Plot type | Count rate plots | Images |
|---|---|---|
| Comparison with Poisson distribution Blue bars denote a histogram of data divided into 1 sec bins. Red curve is a Poisson curve with rate = median count rate of data. |
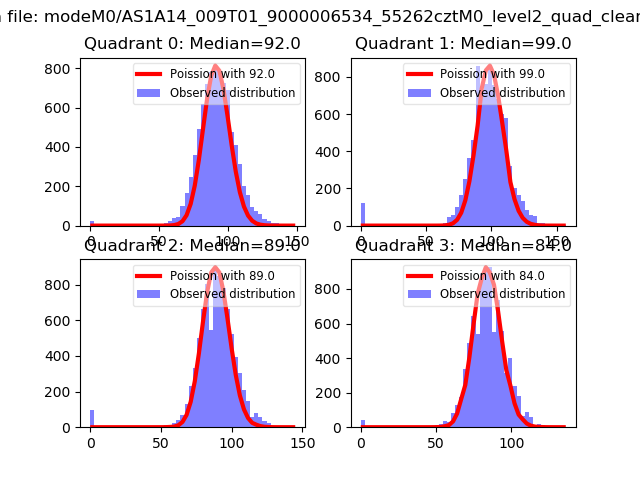 |
 |
| Quadrant-wise count rates Data is divided into 100 sec bins |
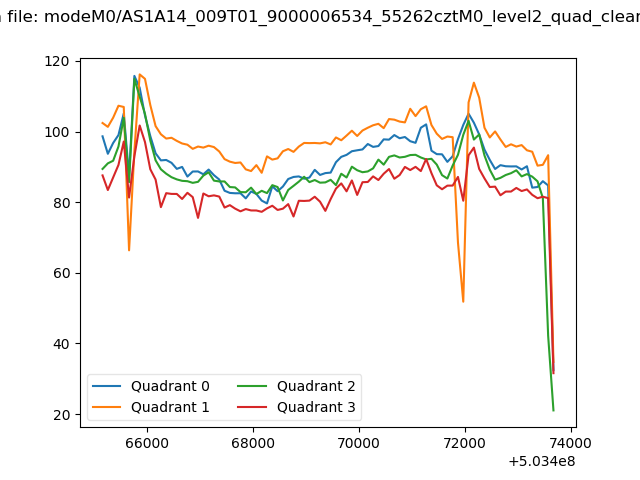 |
|
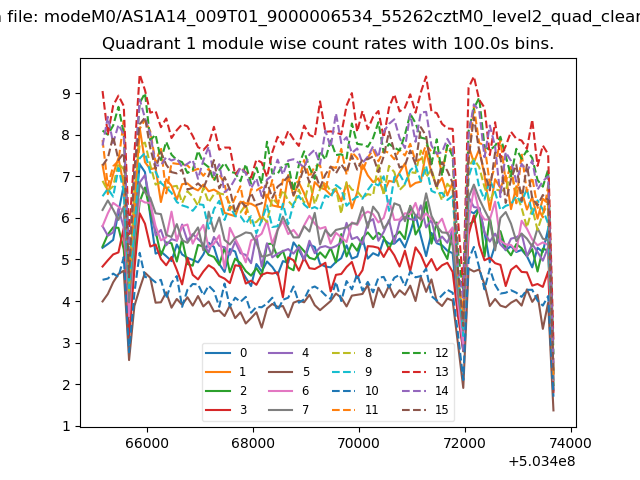
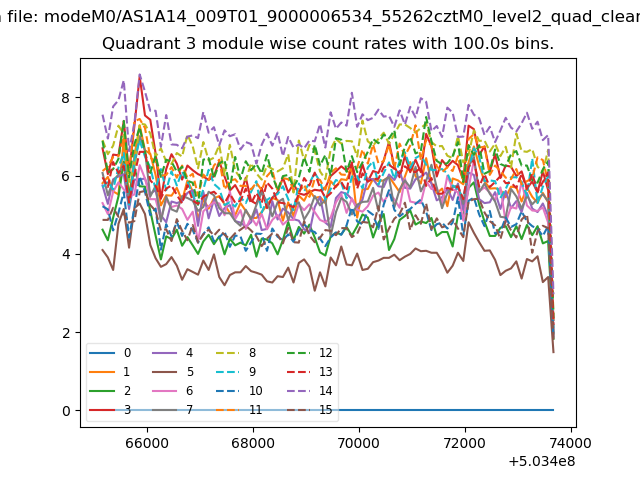
| Module-wise count rates for Quadrant A Data is divided into 100 sec bins |
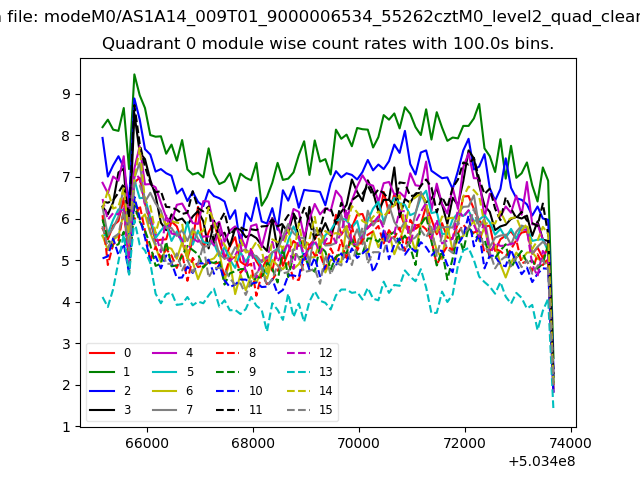 |
 |
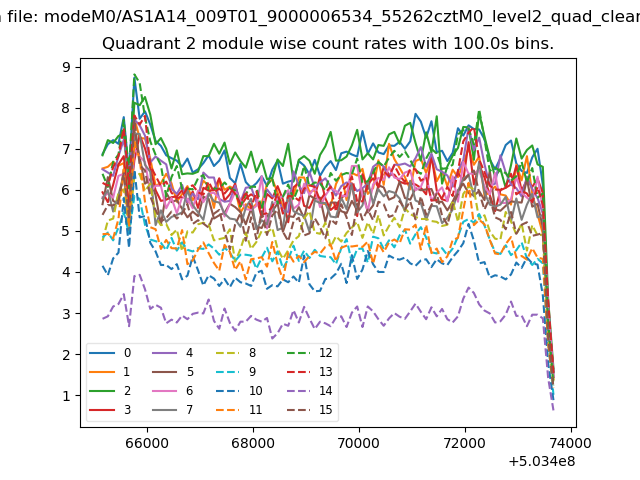
| Module-wise count rates for Quadrant B Data is divided into 100 sec bins |
 |
 |
| Module-wise count rates for Quadrant C Data is divided into 100 sec bins |
 |
 |
| Module-wise count rates for Quadrant D Data is divided into 100 sec bins |
 |
 |
| Parameter | Plot |
|---|---|
| CZT HV Monitor | 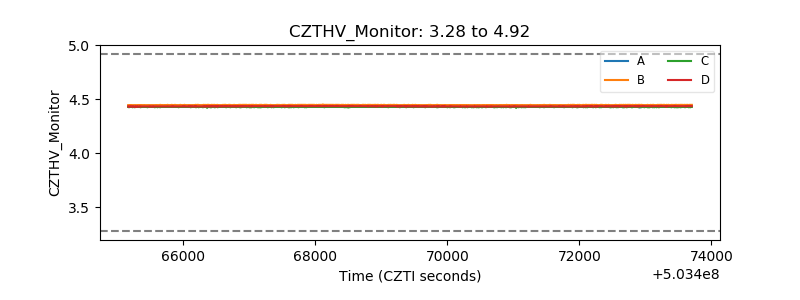 |
| D_VDD | 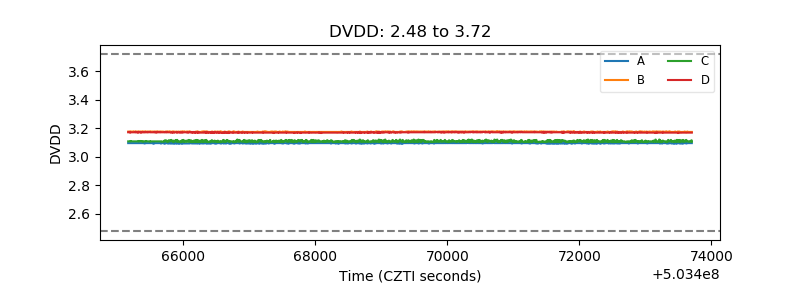 |
| Temperature 1 | 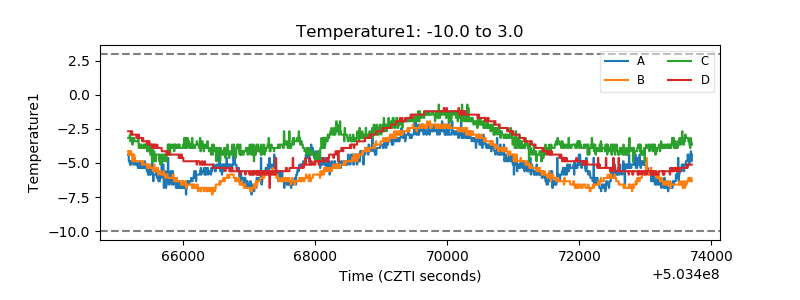 |
| Veto HV Monitor | 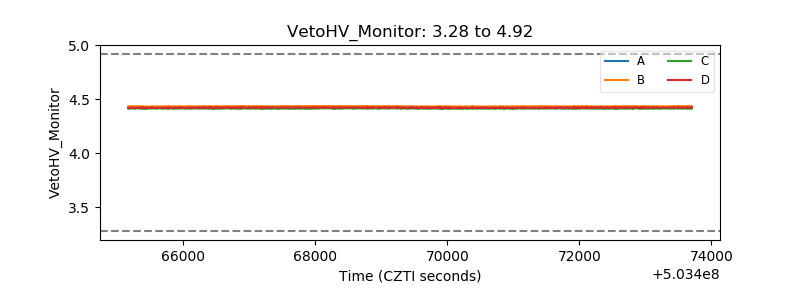 |
| Veto LLD | 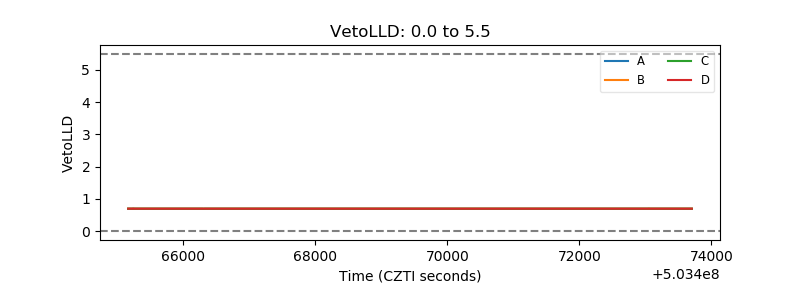 |
| Alpha Counter | 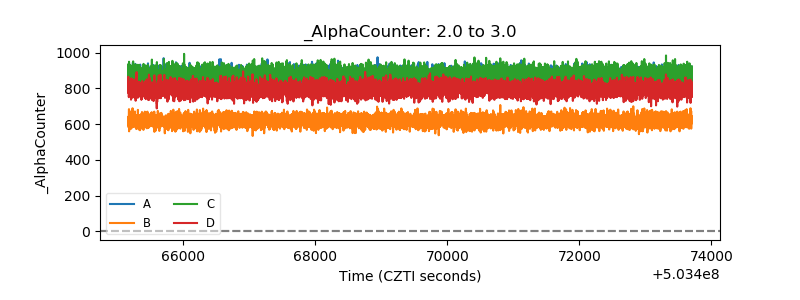 |
| _CPM_Rate | 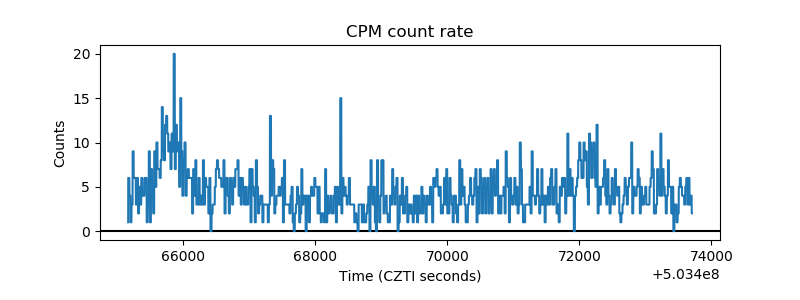 |
| CZT Counter | 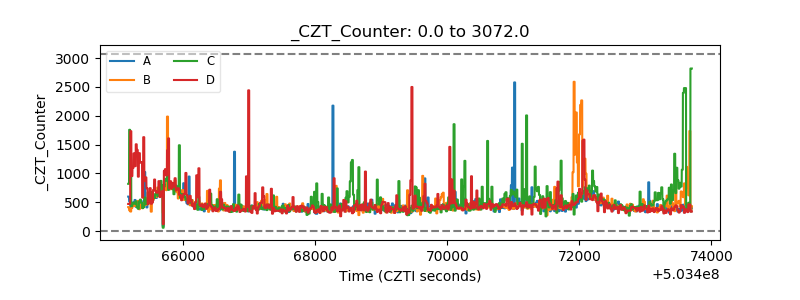 |
| +2.5 Volts monitor | 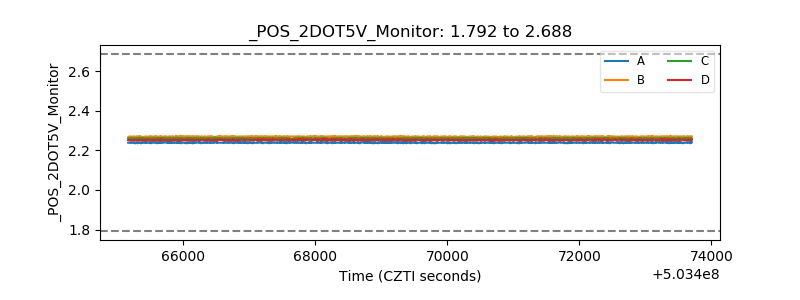 |
| +5 Volts monitor | 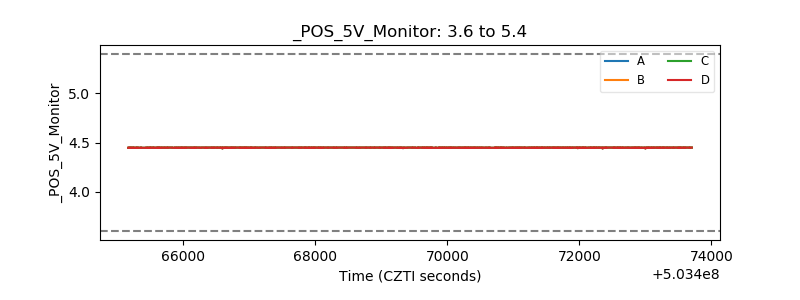 |
| _ROLL_ROT | 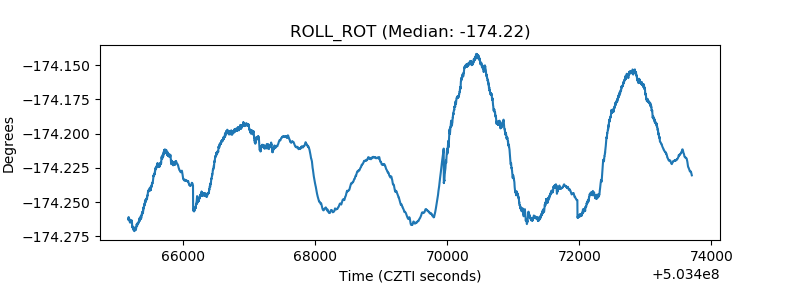 |
| _Roll_DEC | 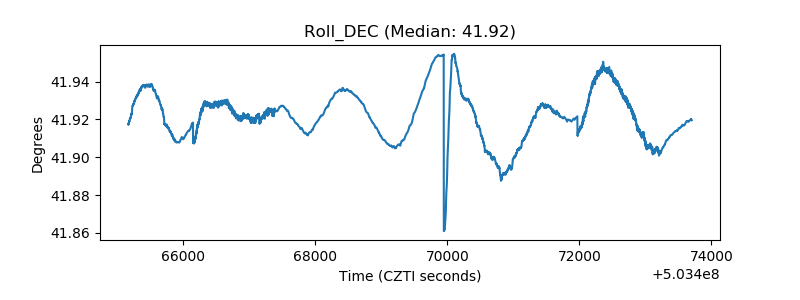 |
| _Roll_RA | 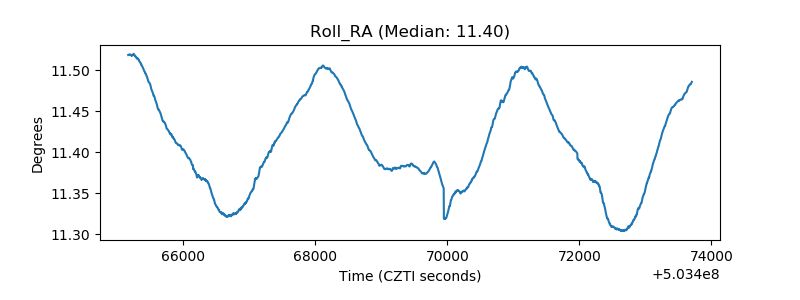 |
| Veto Counter | 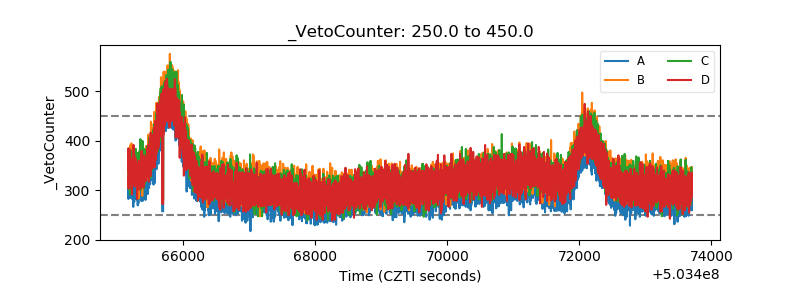 |