| Param | Original file | Final file |
|---|---|---|
| Filename | modeM0/AS1A14_009T01_9000006534_55263cztM0_level2.fits | modeM0/AS1A14_009T01_9000006534_55263cztM0_level2_quad_clean.evt |
| Size (bytes) | 434,851,200 | 115,257,600 |
| Size | 414.7 MB | 109.9 MB |
| Events in quadrant A | 3,516,557 | 739,392 |
| Events in quadrant B | 3,944,617 | 790,674 |
| Events in quadrant C | 4,298,016 | 717,007 |
| Events in quadrant D | 3,706,341 | 679,100 |
| Mode SS | |||
|---|---|---|---|
| Quadrant | BADHDUFLAG | Total packets | Discarded packets |
| A | 0 | 162 | 0 |
| B | 0 | 162 | 0 |
| C | 0 | 162 | 0 |
| D | 0 | 162 | 0 |
| Mode M0 | |||
|---|---|---|---|
| Quadrant | BADHDUFLAG | Total packets | Discarded packets |
| A | 0 | 16797 | 0 |
| B | 0 | 17871 | 0 |
| C | 0 | 18785 | 0 |
| D | 0 | 17399 | 0 |
| Quadrant | Total seconds | Saturated seconds | Saturation percentage |
|---|---|---|---|
| A | 8112 | 31 | 0.382150% |
| B | 8112 | 171 | 2.107988% |
| C | 8112 | 121 | 1.491617% |
| D | 8112 | 28 | 0.345168% |
Noise dominated data is calculated using 1-second bins in cleaned event files. If a bin has >2000 counts, and if more than 50% of those come from <1% of pixels, then it is considered to be noise-dominated and hence unusable.
| Quadrant | # 1 sec bins | Bins with >0 counts | Bins with >2000 counts | High rate bins dominated by noise | Noise dominated (total time) | Noise dominated (detector-on time) | Marked lightcurve |
|---|---|---|---|---|---|---|---|
| A | 8112 | 8112 | 3 | 3 | 0.04% | 0.04% | 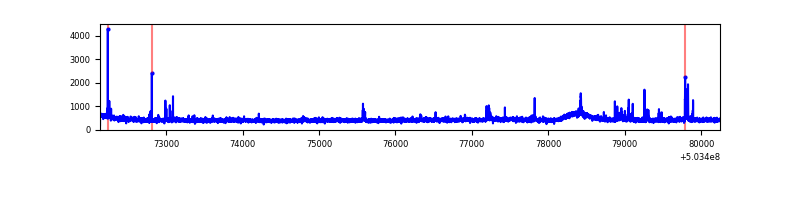 |
| B | 8112 | 8112 | 31 | 31 | 0.38% | 0.38% | 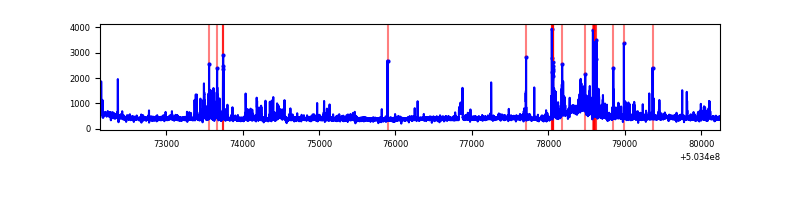 |
| C | 8112 | 8112 | 95 | 95 | 1.17% | 1.17% | 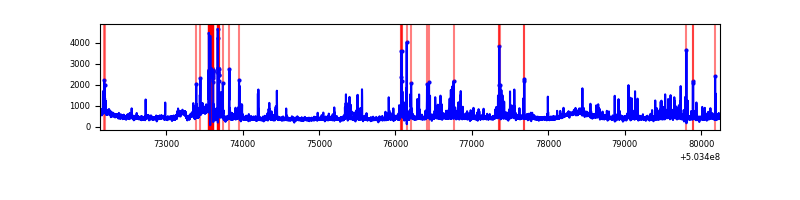 |
| D | 8112 | 8112 | 21 | 21 | 0.26% | 0.26% | 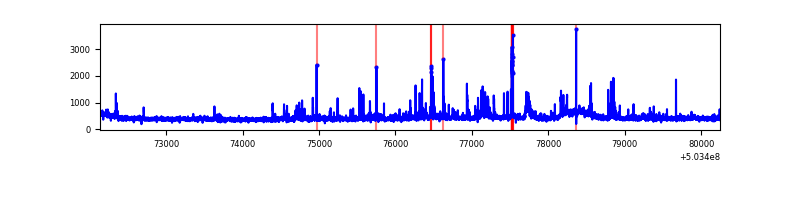 |
Top three noisy pixels from each quadrant. If the there are fewer than three noisy pixels in the level2.evt file, extra rows are filled as -1
| Pixel properties | Quadrant properties | ||||||
|---|---|---|---|---|---|---|---|
| Quadrant | DetID | PixID | Counts | Sigma | Mean | Median | Sigma |
| A | 3 | 78 | 59646 | 280.45 | 853 | 830 | 209.7 |
| A | 0 | 8 | 55135 | 258.94 | 853 | 830 | 209.7 |
| A | 4 | 3 | 37472 | 174.72 | 853 | 830 | 209.7 |
| B | 5 | 185 | 460460 | 2524.66 | 845 | 813 | 182.1 |
| B | 10 | 189 | 79074 | 429.86 | 845 | 813 | 182.1 |
| B | 12 | 111 | 23108 | 122.46 | 845 | 813 | 182.1 |
| C | 10 | 22 | 334190 | 1449.87 | 833 | 826 | 229.9 |
| C | 13 | 3 | 277675 | 1204.07 | 833 | 826 | 229.9 |
| C | 12 | 252 | 163241 | 706.37 | 833 | 826 | 229.9 |
| D | 3 | 12 | 82505 | 350.86 | 829 | 792 | 232.9 |
| D | 7 | 96 | 79950 | 339.89 | 829 | 792 | 232.9 |
| D | 11 | 129 | 79043 | 336.0 | 829 | 792 | 232.9 |
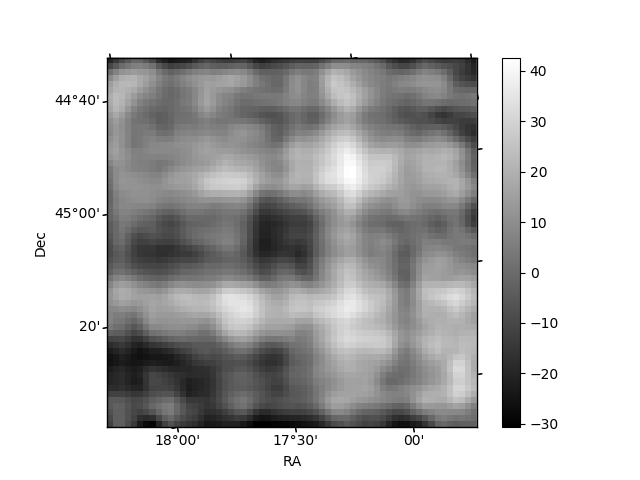
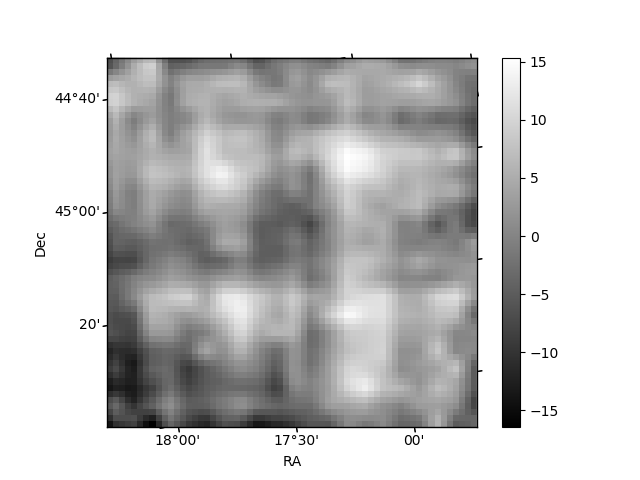
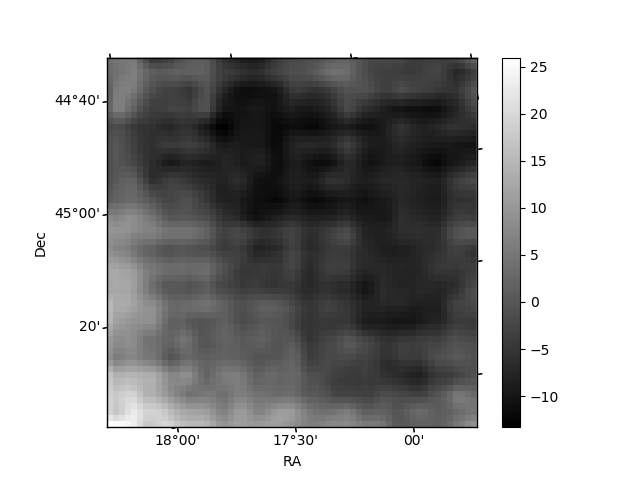
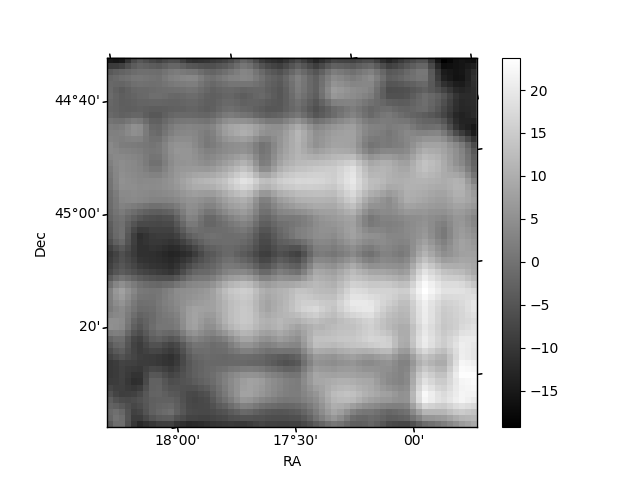
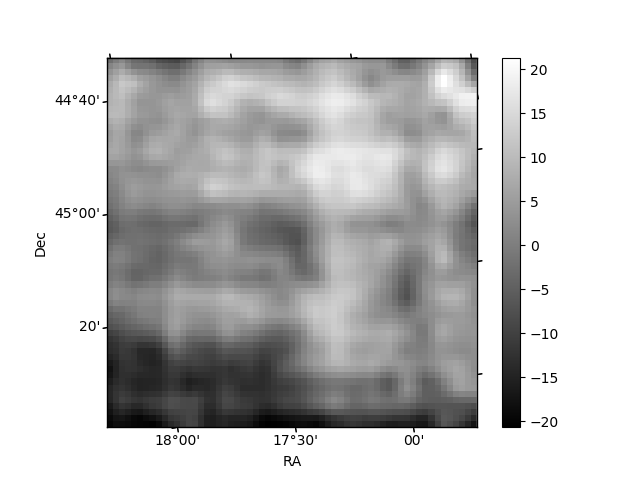
Histogram calculated using DETX and DETY for each event in the final _common_clean file
| Quadrant A | 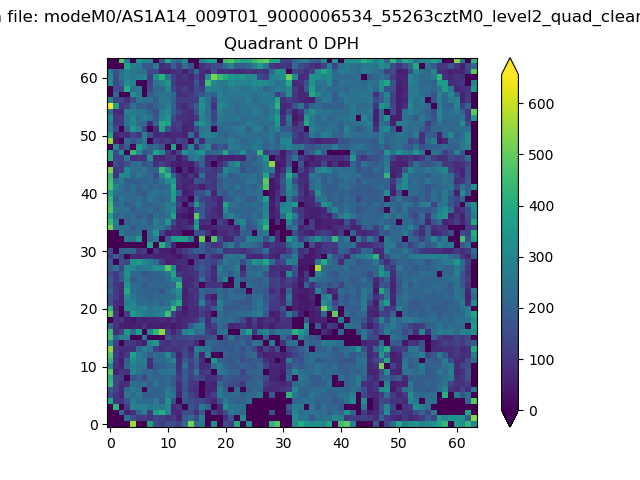 |
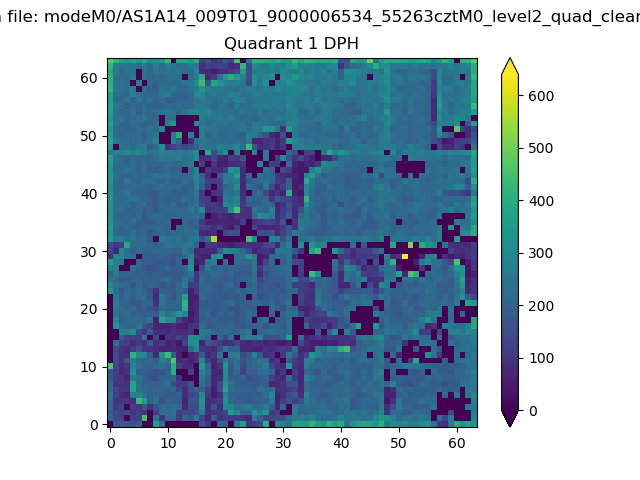 |
Quadrant B |
|---|---|---|---|
| Quadrant D | 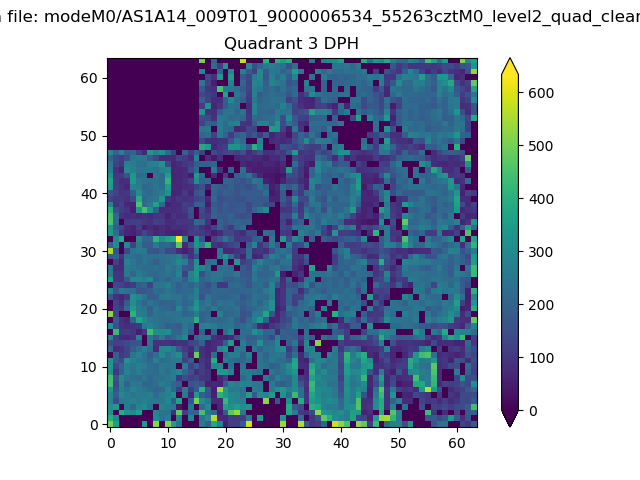 |
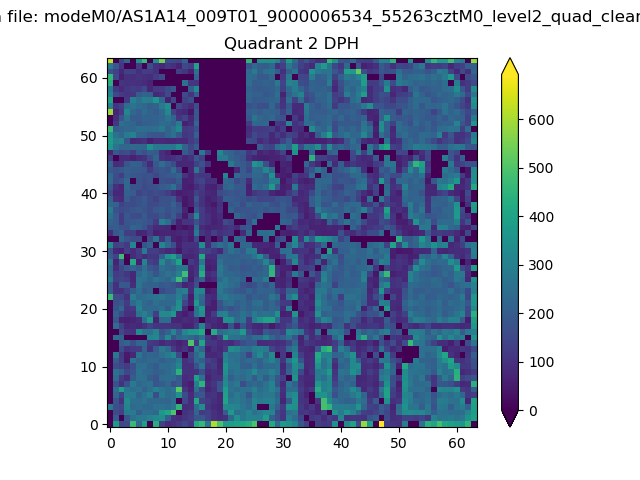 |
Quadrant C |
| Plot type | Count rate plots | Images |
|---|---|---|
| Comparison with Poisson distribution Blue bars denote a histogram of data divided into 1 sec bins. Red curve is a Poisson curve with rate = median count rate of data. |
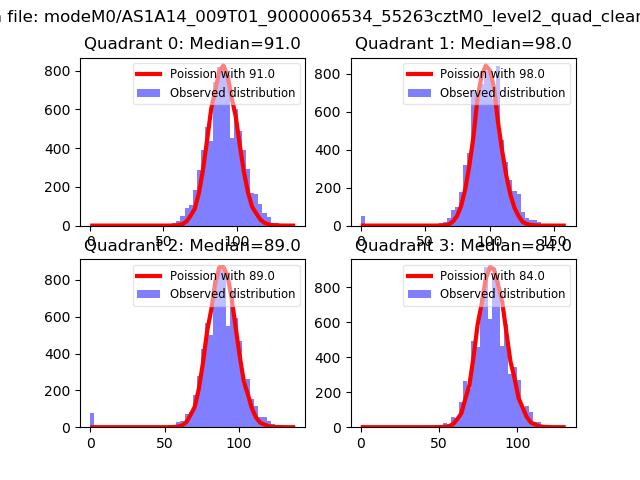 |
 |
| Quadrant-wise count rates Data is divided into 100 sec bins |
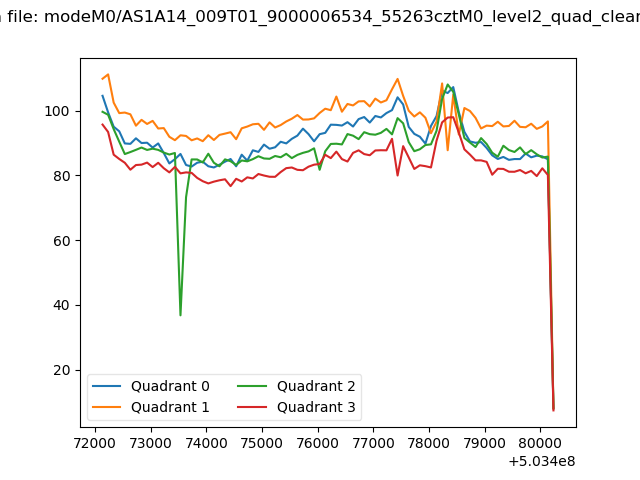 |
|
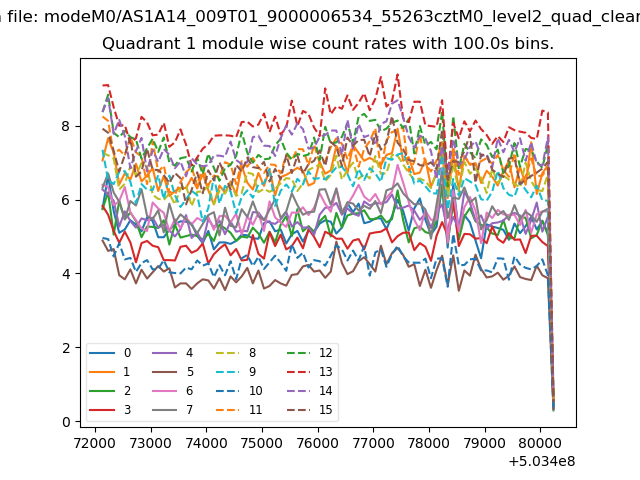
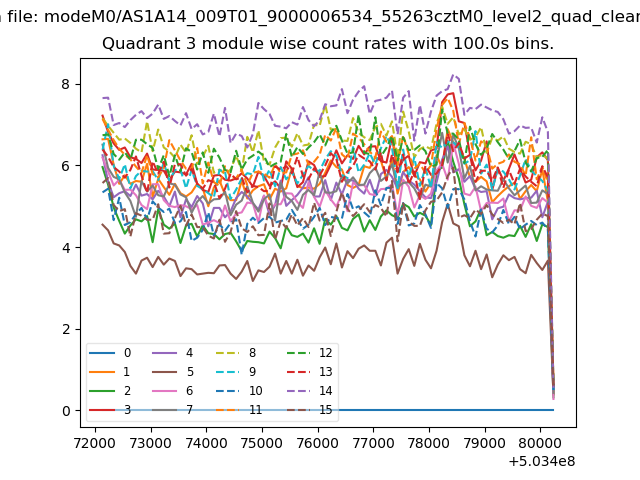
| Module-wise count rates for Quadrant A Data is divided into 100 sec bins |
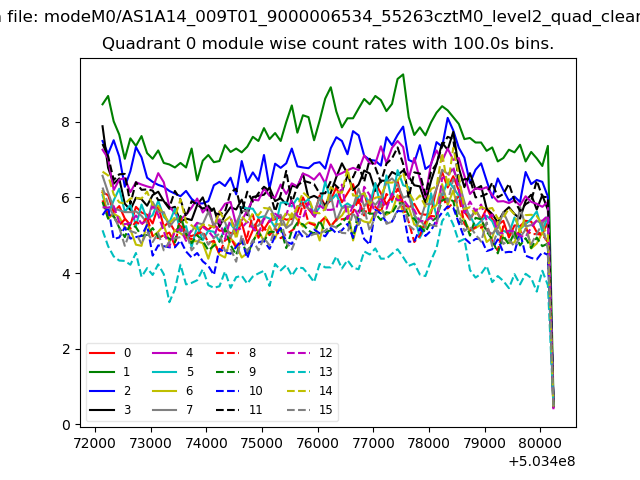 |
 |
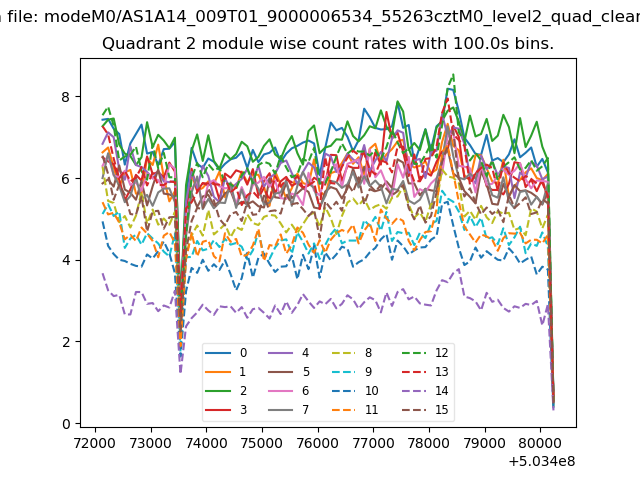
| Module-wise count rates for Quadrant B Data is divided into 100 sec bins |
 |
 |
| Module-wise count rates for Quadrant C Data is divided into 100 sec bins |
 |
 |
| Module-wise count rates for Quadrant D Data is divided into 100 sec bins |
 |
 |
| Parameter | Plot |
|---|---|
| CZT HV Monitor | 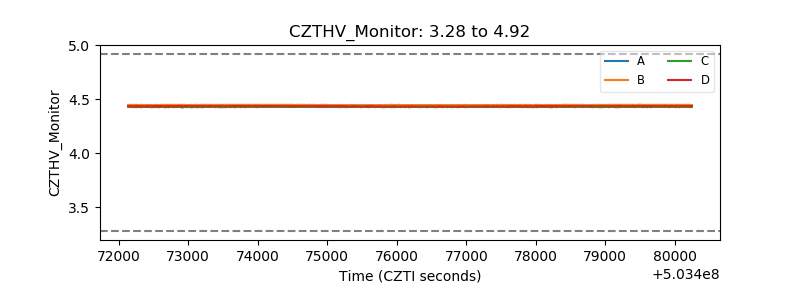 |
| D_VDD | 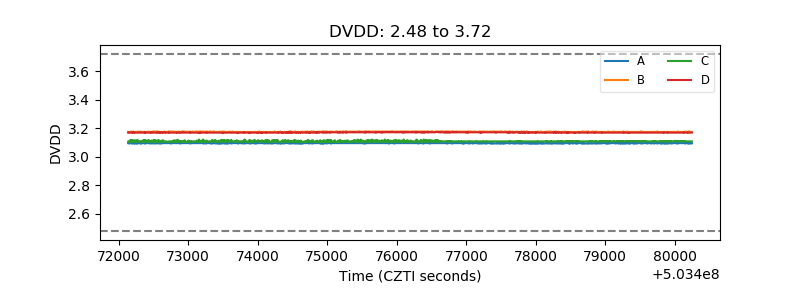 |
| Temperature 1 | 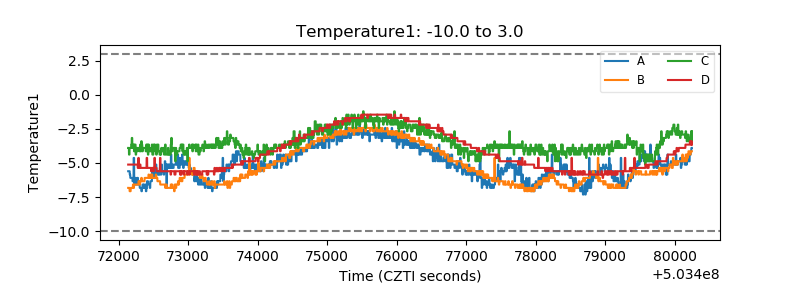 |
| Veto HV Monitor | 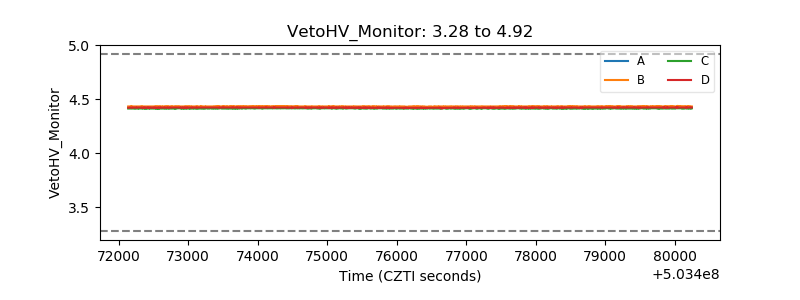 |
| Veto LLD | 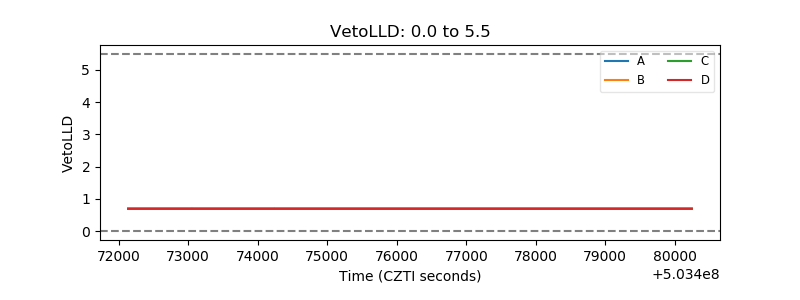 |
| Alpha Counter | 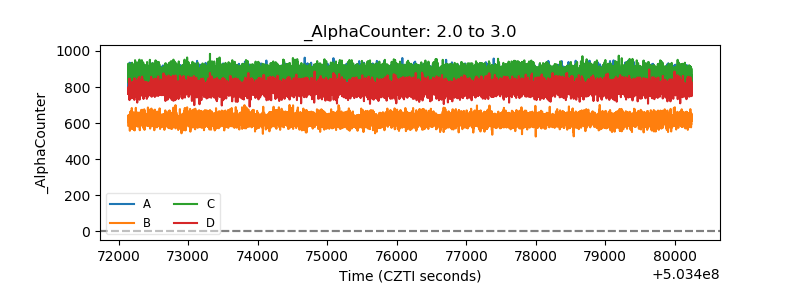 |
| _CPM_Rate | 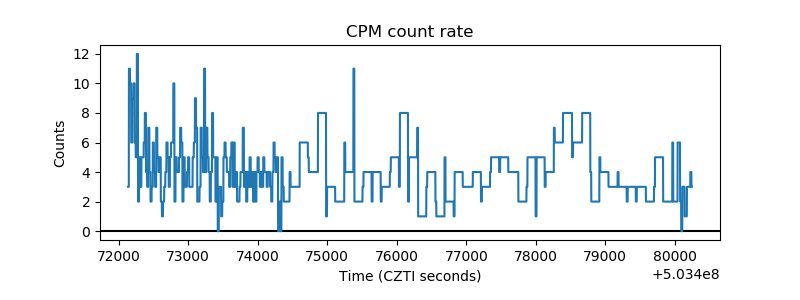 |
| CZT Counter | 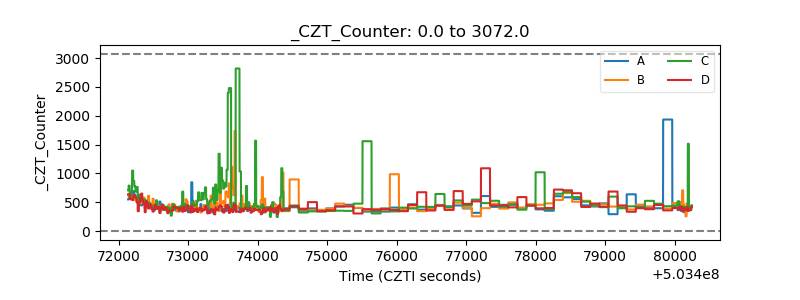 |
| +2.5 Volts monitor |  |
| +5 Volts monitor |  |
| _ROLL_ROT | 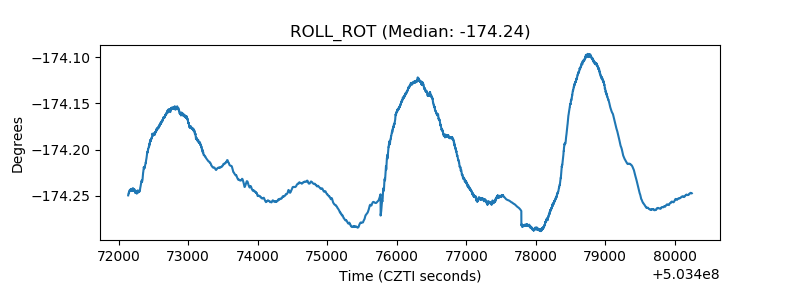 |
| _Roll_DEC | 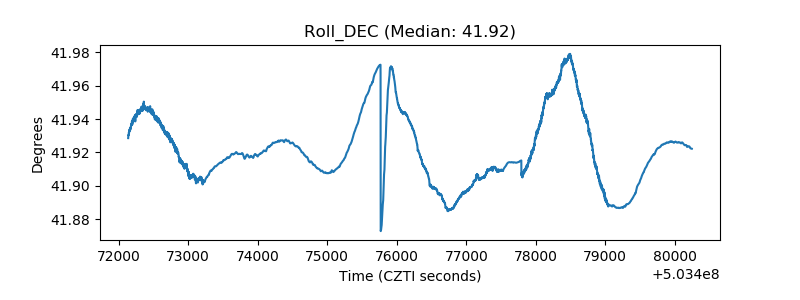 |
| _Roll_RA | 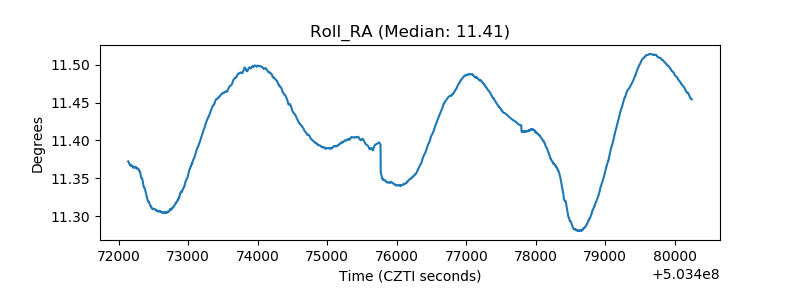 |
| Veto Counter | 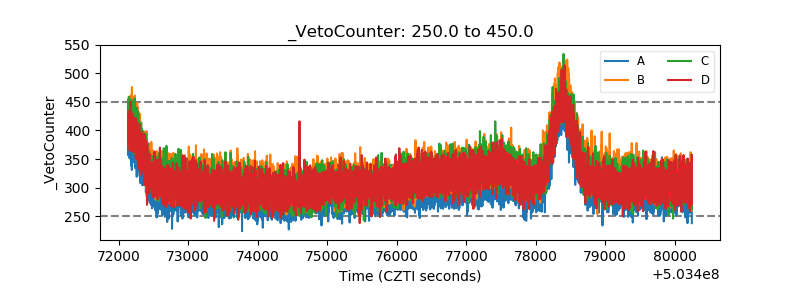 |