| Param | Original file | Final file |
|---|---|---|
| Filename | modeM0/AS1A14_009T01_9000006534_55266cztM0_level2.fits | modeM0/AS1A14_009T01_9000006534_55266cztM0_level2_quad_clean.evt |
| Size (bytes) | 1,155,329,280 | 283,559,040 |
| Size | 1.1 GB | 270.4 MB |
| Events in quadrant A | 10,268,373 | 1,815,101 |
| Events in quadrant B | 9,262,821 | 1,967,007 |
| Events in quadrant C | 10,666,988 | 1,782,167 |
| Events in quadrant D | 10,993,946 | 1,623,221 |
| Mode SS | |||
|---|---|---|---|
| Quadrant | BADHDUFLAG | Total packets | Discarded packets |
| A | 0 | 410 | 0 |
| B | 0 | 410 | 0 |
| C | 0 | 410 | 0 |
| D | 0 | 410 | 0 |
| Mode M0 | |||
|---|---|---|---|
| Quadrant | BADHDUFLAG | Total packets | Discarded packets |
| A | 0 | 45973 | 4 |
| B | 0 | 43161 | 3 |
| C | 0 | 46753 | 3 |
| D | 0 | 47648 | 3 |
| Mode M9 | |||
|---|---|---|---|
| Quadrant | BADHDUFLAG | Total packets | Discarded packets |
| A | 0 | 14 | 0 |
| B | 0 | 14 | 0 |
| C | 0 | 14 | 0 |
| D | 0 | 14 | 0 |
| Quadrant | Total seconds | Saturated seconds | Saturation percentage |
|---|---|---|---|
| A | 20303 | 667 | 3.285229% |
| B | 20304 | 566 | 2.787628% |
| C | 20304 | 471 | 2.319740% |
| D | 20304 | 634 | 3.122537% |
Noise dominated data is calculated using 1-second bins in cleaned event files. If a bin has >2000 counts, and if more than 50% of those come from <1% of pixels, then it is considered to be noise-dominated and hence unusable.
| Quadrant | # 1 sec bins | Bins with >0 counts | Bins with >2000 counts | High rate bins dominated by noise | Noise dominated (total time) | Noise dominated (detector-on time) | Marked lightcurve |
|---|---|---|---|---|---|---|---|
| A | 21568 | 20306 | 236 | 236 | 1.09% | 1.16% | 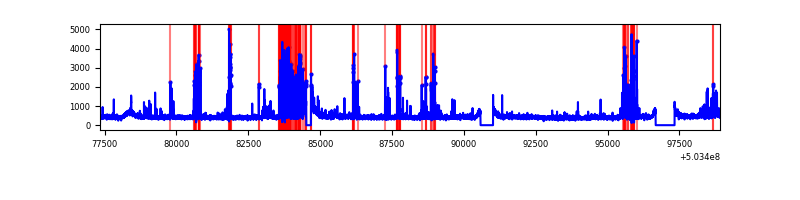 |
| B | 21569 | 20307 | 59 | 59 | 0.27% | 0.29% | 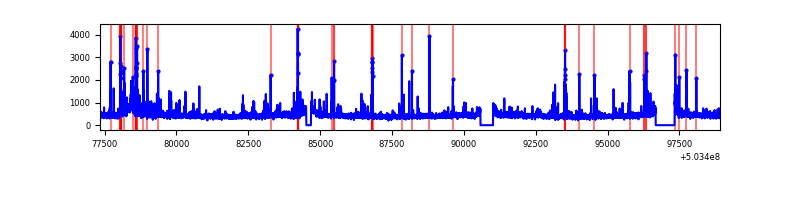 |
| C | 21569 | 20307 | 235 | 235 | 1.09% | 1.16% | 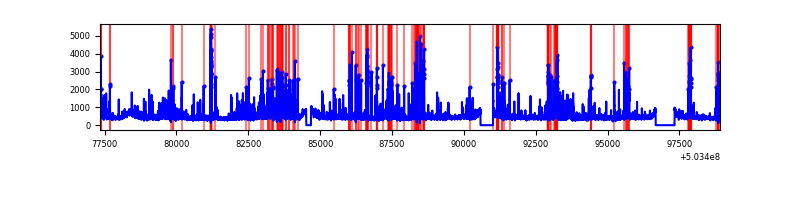 |
| D | 21569 | 20307 | 315 | 315 | 1.46% | 1.55% | 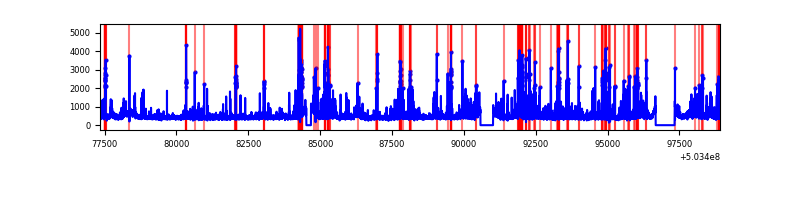 |
Top three noisy pixels from each quadrant. If the there are fewer than three noisy pixels in the level2.evt file, extra rows are filled as -1
| Pixel properties | Quadrant properties | ||||||
|---|---|---|---|---|---|---|---|
| Quadrant | DetID | PixID | Counts | Sigma | Mean | Median | Sigma |
| A | 0 | 8 | 1253635 | 2381.28 | 2145 | 2084 | 525.6 |
| A | 12 | 115 | 364939 | 690.39 | 2145 | 2084 | 525.6 |
| A | 3 | 78 | 168379 | 316.4 | 2145 | 2084 | 525.6 |
| B | 5 | 185 | 534359 | 1161.89 | 2129 | 2041 | 458.1 |
| B | 10 | 189 | 59902 | 126.29 | 2129 | 2041 | 458.1 |
| B | 0 | 182 | 59492 | 125.4 | 2129 | 2041 | 458.1 |
| C | 13 | 3 | 769999 | 1340.79 | 2103 | 2079 | 572.7 |
| C | 12 | 249 | 459476 | 798.62 | 2103 | 2079 | 572.7 |
| C | 14 | 254 | 318115 | 551.8 | 2103 | 2079 | 572.7 |
| D | 7 | 96 | 880480 | 1494.93 | 2090 | 1997 | 587.6 |
| D | 11 | 129 | 604177 | 1024.74 | 2090 | 1997 | 587.6 |
| D | 15 | 122 | 278270 | 470.14 | 2090 | 1997 | 587.6 |
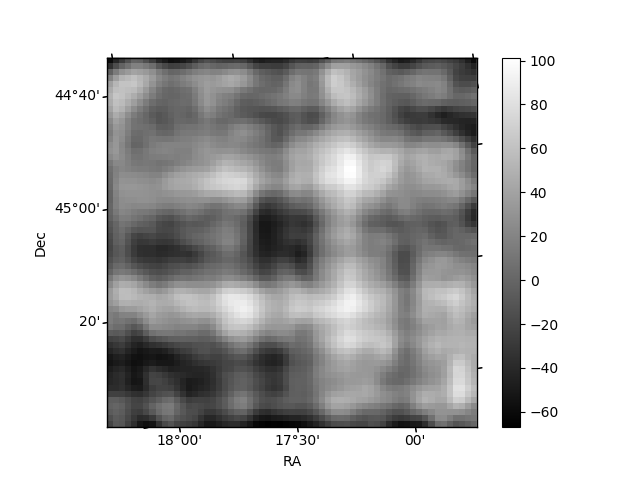
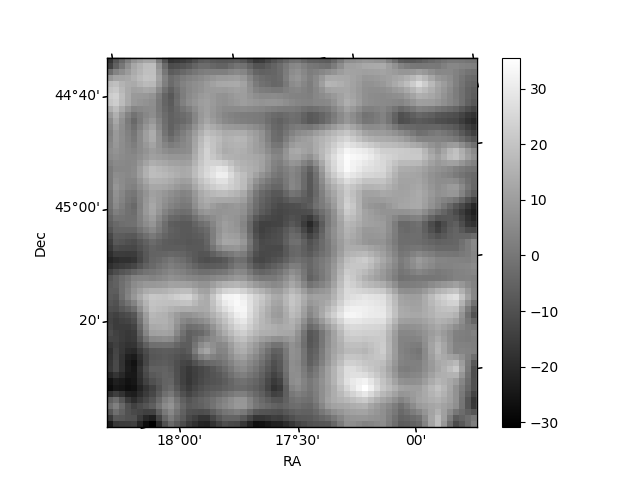
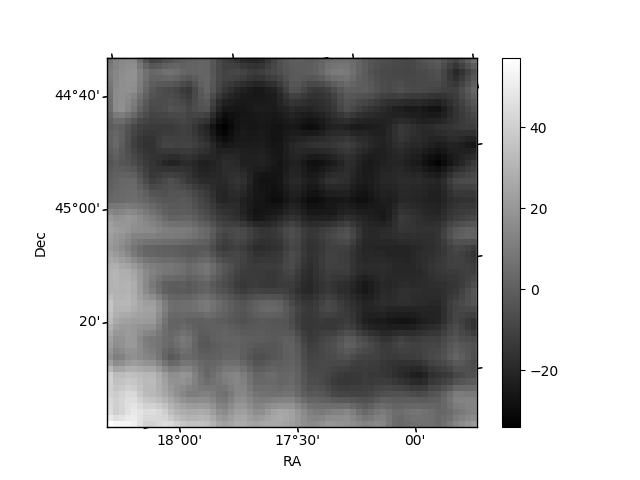
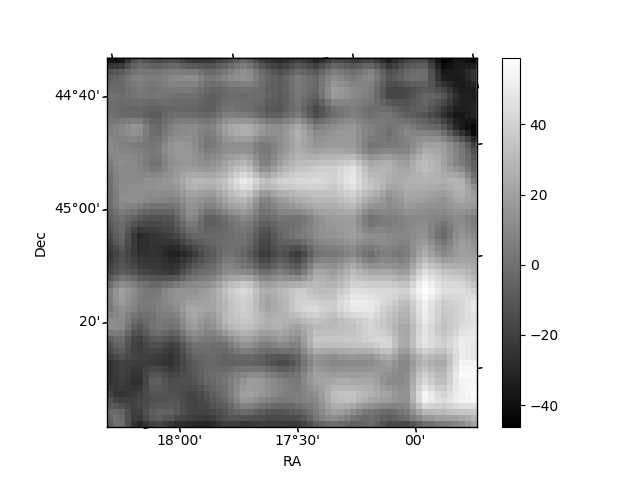
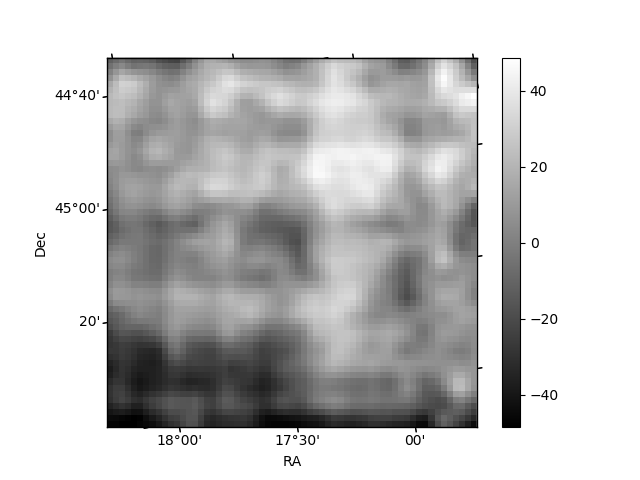
Histogram calculated using DETX and DETY for each event in the final _common_clean file
| Quadrant A | 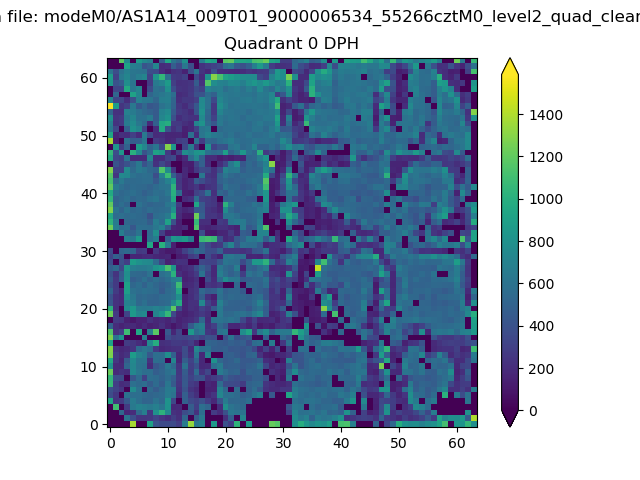 |
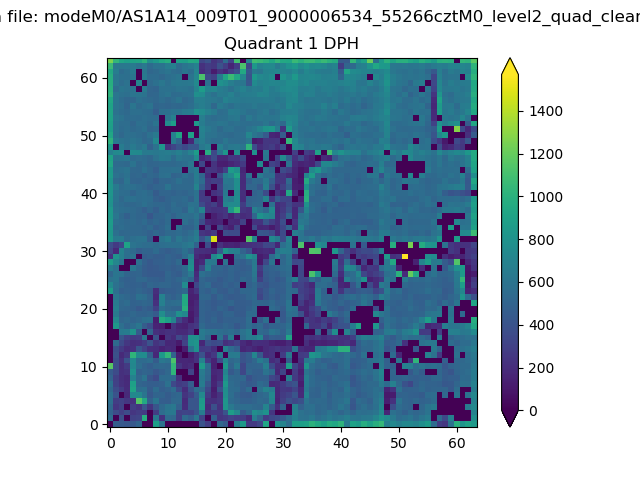 |
Quadrant B |
|---|---|---|---|
| Quadrant D | 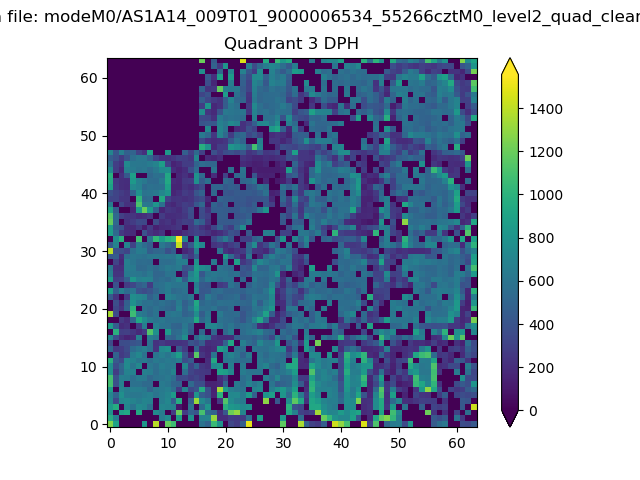 |
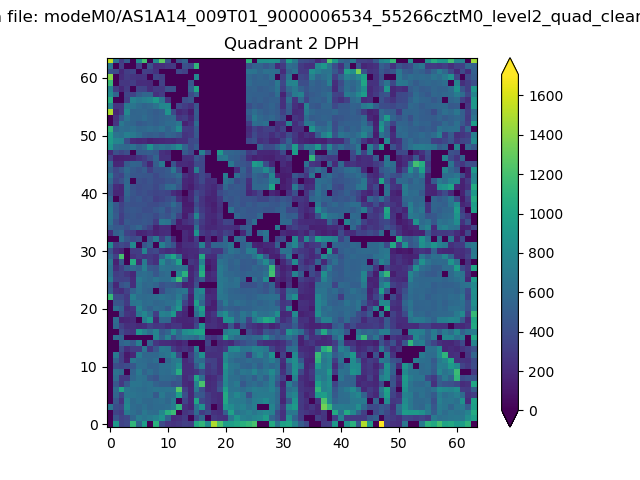 |
Quadrant C |
| Plot type | Count rate plots | Images |
|---|---|---|
| Comparison with Poisson distribution Blue bars denote a histogram of data divided into 1 sec bins. Red curve is a Poisson curve with rate = median count rate of data. |
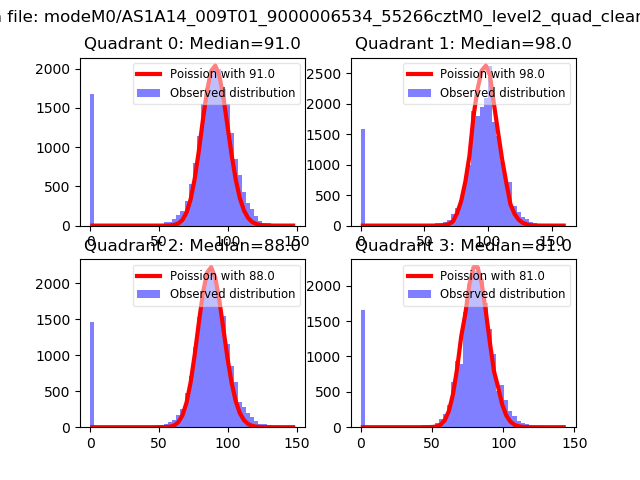 |
 |
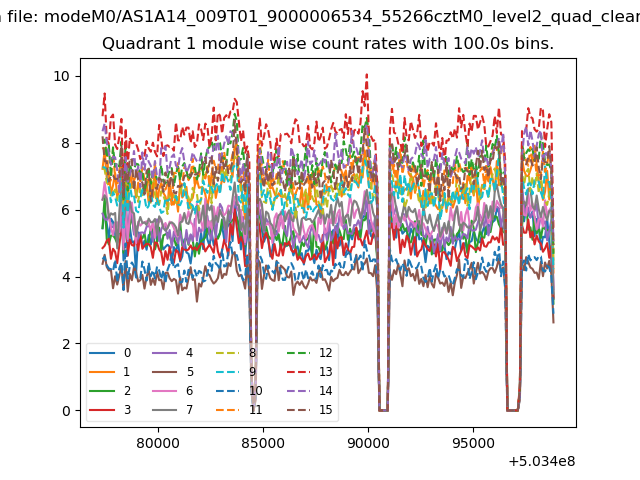
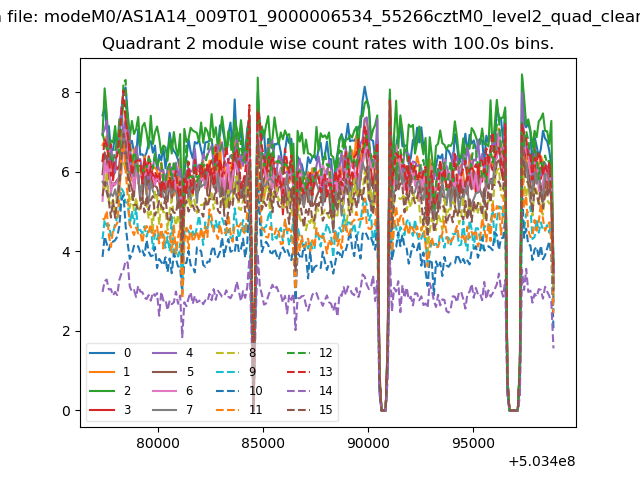
| Quadrant-wise count rates Data is divided into 100 sec bins |
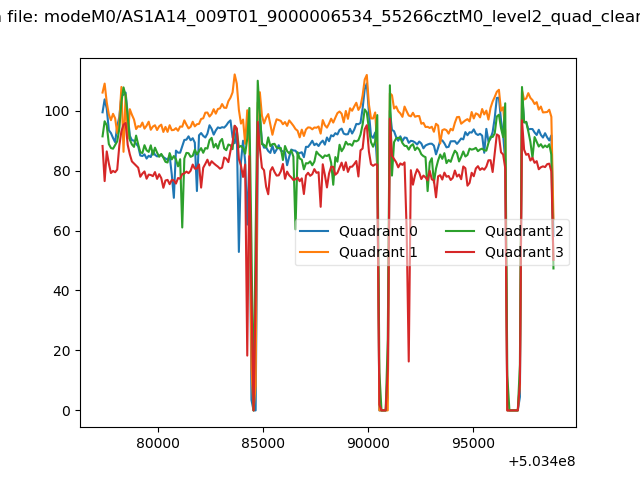 |
|
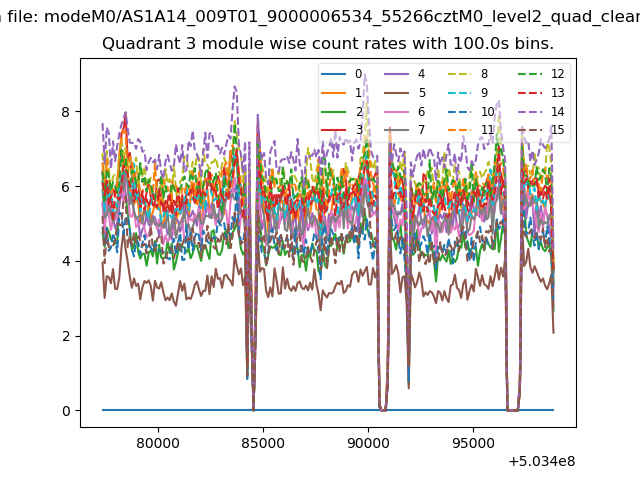
| Module-wise count rates for Quadrant A Data is divided into 100 sec bins |
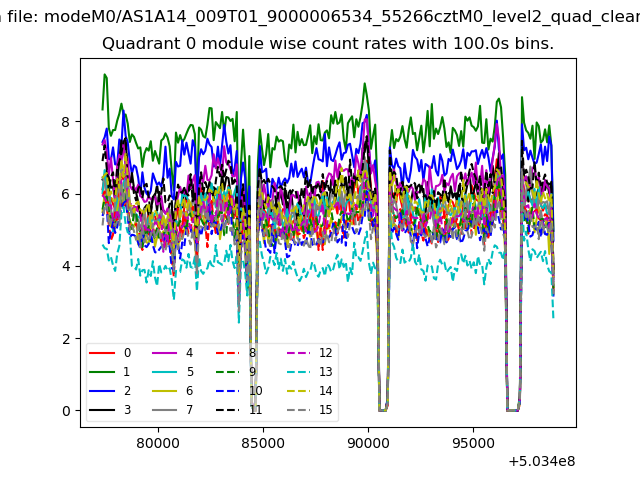 |
 |
| Module-wise count rates for Quadrant B Data is divided into 100 sec bins |
 |
 |
| Module-wise count rates for Quadrant C Data is divided into 100 sec bins |
 |
 |
| Module-wise count rates for Quadrant D Data is divided into 100 sec bins |
 |
 |
| Parameter | Plot |
|---|---|
| CZT HV Monitor | 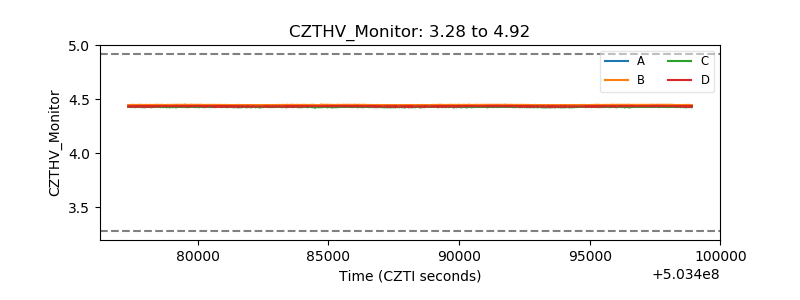 |
| D_VDD | 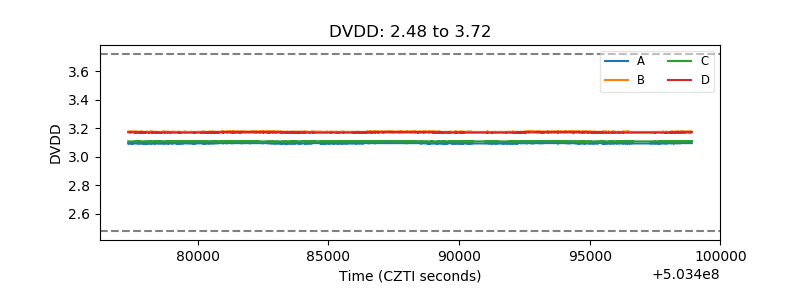 |
| Temperature 1 | 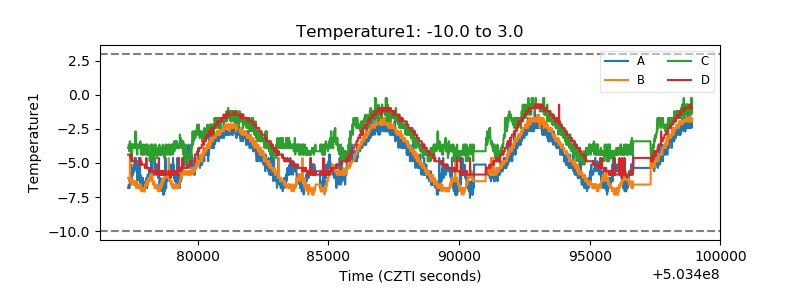 |
| Veto HV Monitor | 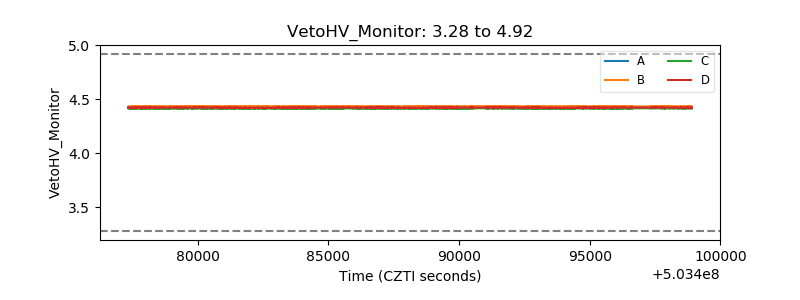 |
| Veto LLD | 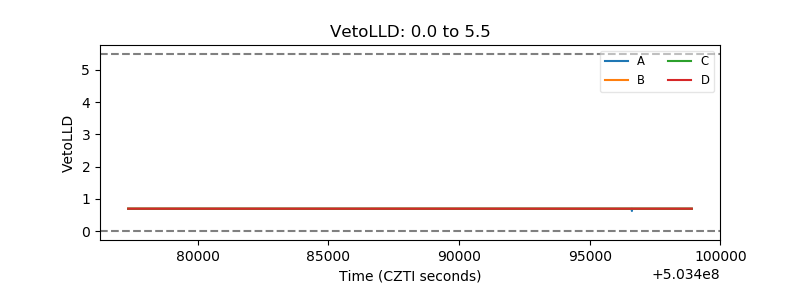 |
| Alpha Counter | 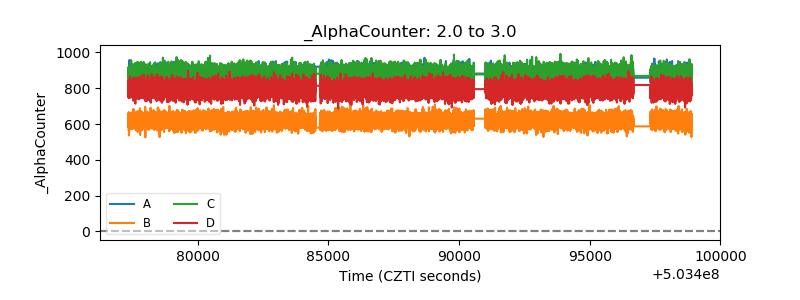 |
| _CPM_Rate | 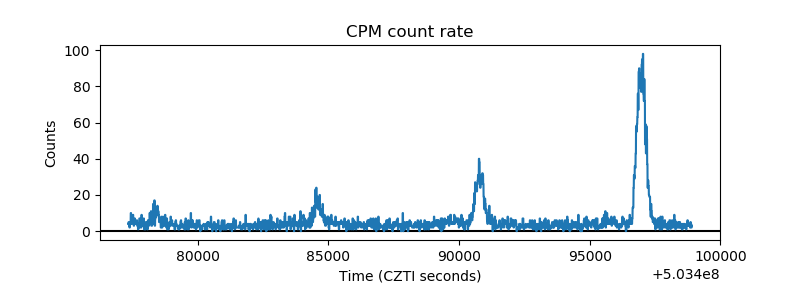 |
| CZT Counter | 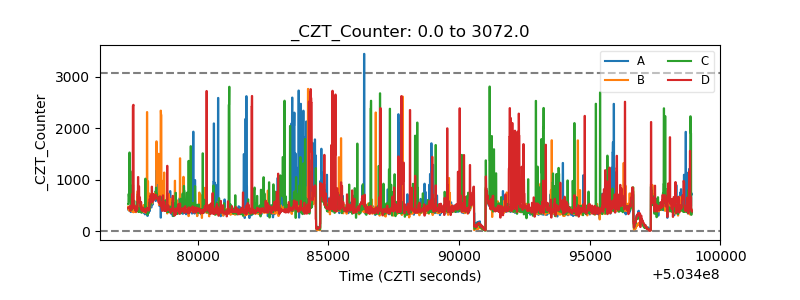 |
| +2.5 Volts monitor |  |
| +5 Volts monitor |  |
| _ROLL_ROT | 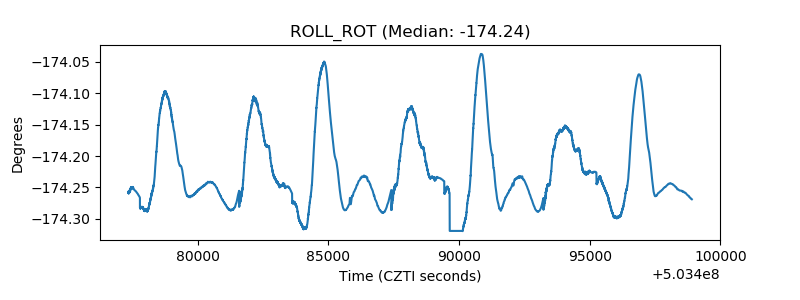 |
| _Roll_DEC | 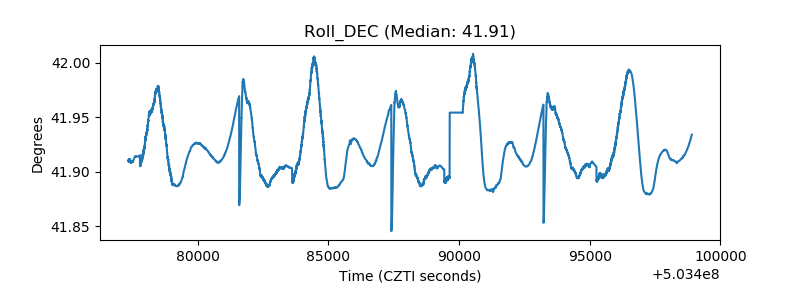 |
| _Roll_RA | 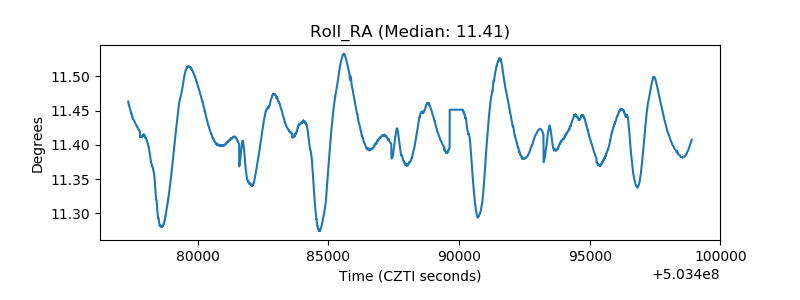 |
| Veto Counter | 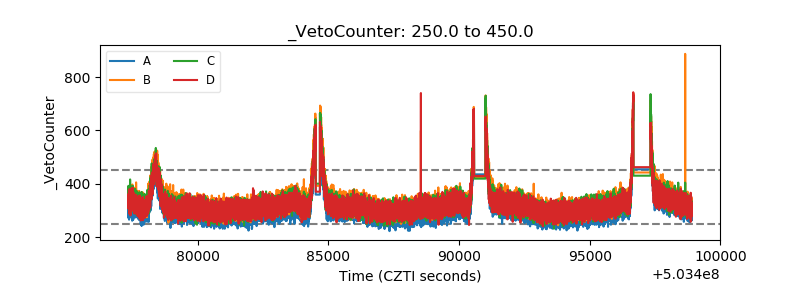 |