| Param | Original file | Final file |
|---|---|---|
| Filename | modeM0/AS1A14_009T01_9000006534_55270cztM0_level2.fits | modeM0/AS1A14_009T01_9000006534_55270cztM0_level2_quad_clean.evt |
| Size (bytes) | 395,948,160 | 97,064,640 |
| Size | 377.6 MB | 92.6 MB |
| Events in quadrant A | 4,165,932 | 619,082 |
| Events in quadrant B | 3,232,870 | 678,998 |
| Events in quadrant C | 3,238,387 | 608,579 |
| Events in quadrant D | 3,507,342 | 573,653 |
| Mode SS | |||
|---|---|---|---|
| Quadrant | BADHDUFLAG | Total packets | Discarded packets |
| A | 0 | 132 | 0 |
| B | 0 | 132 | 0 |
| C | 0 | 132 | 0 |
| D | 0 | 132 | 0 |
| Mode M0 | |||
|---|---|---|---|
| Quadrant | BADHDUFLAG | Total packets | Discarded packets |
| A | 0 | 17036 | 2 |
| B | 0 | 14423 | 1 |
| C | 0 | 14550 | 1 |
| D | 0 | 15110 | 1 |
| Mode M9 | |||
|---|---|---|---|
| Quadrant | BADHDUFLAG | Total packets | Discarded packets |
| A | 0 | 11 | 0 |
| B | 0 | 11 | 0 |
| C | 0 | 11 | 0 |
| D | 0 | 11 | 0 |
| Quadrant | Total seconds | Saturated seconds | Saturation percentage |
|---|---|---|---|
| A | 6582 | 286 | 4.345184% |
| B | 6582 | 88 | 1.336980% |
| C | 6583 | 104 | 1.579827% |
| D | 6583 | 114 | 1.731733% |
Noise dominated data is calculated using 1-second bins in cleaned event files. If a bin has >2000 counts, and if more than 50% of those come from <1% of pixels, then it is considered to be noise-dominated and hence unusable.
| Quadrant | # 1 sec bins | Bins with >0 counts | Bins with >2000 counts | High rate bins dominated by noise | Noise dominated (total time) | Noise dominated (detector-on time) | Marked lightcurve |
|---|---|---|---|---|---|---|---|
| A | 7657 | 6583 | 212 | 212 | 2.77% | 3.22% | 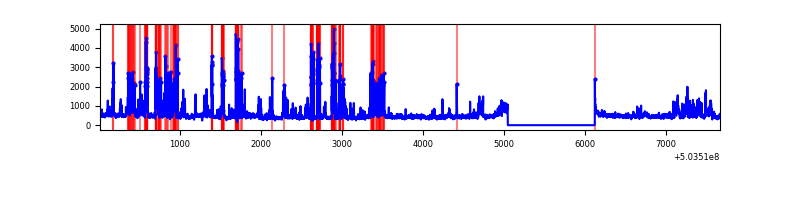 |
| B | 7657 | 6583 | 14 | 14 | 0.18% | 0.21% | 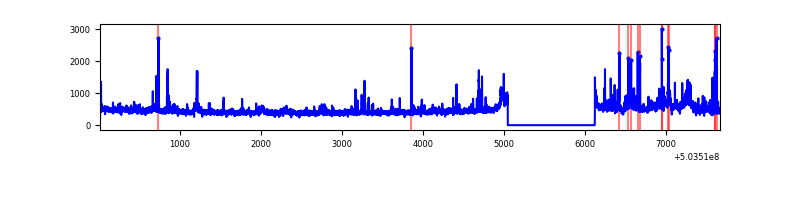 |
| C | 7658 | 6584 | 53 | 53 | 0.69% | 0.80% | 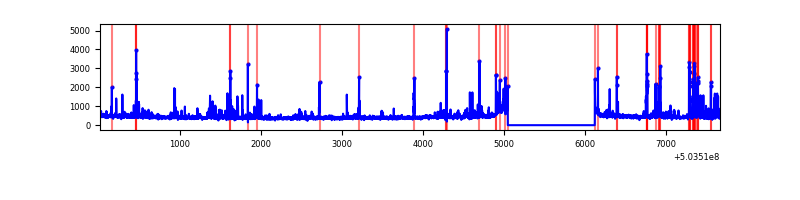 |
| D | 7658 | 6584 | 70 | 70 | 0.91% | 1.06% | 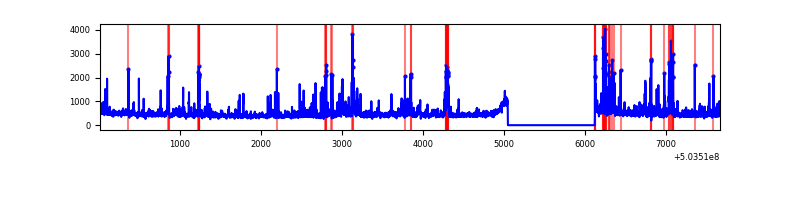 |
Top three noisy pixels from each quadrant. If the there are fewer than three noisy pixels in the level2.evt file, extra rows are filled as -1
| Pixel properties | Quadrant properties | ||||||
|---|---|---|---|---|---|---|---|
| Quadrant | DetID | PixID | Counts | Sigma | Mean | Median | Sigma |
| A | 0 | 8 | 764372 | 4534.45 | 687 | 671 | 168.4 |
| A | 3 | 14 | 543191 | 3221.2 | 687 | 671 | 168.4 |
| A | 12 | 115 | 79511 | 468.11 | 687 | 671 | 168.4 |
| B | 7 | 0 | 201716 | 1353.64 | 690 | 665 | 148.5 |
| B | 4 | 81 | 72053 | 480.64 | 690 | 665 | 148.5 |
| B | 5 | 185 | 62120 | 413.76 | 690 | 665 | 148.5 |
| C | 13 | 3 | 155562 | 825.88 | 683 | 678 | 187.5 |
| C | 14 | 254 | 100278 | 531.09 | 683 | 678 | 187.5 |
| C | 12 | 250 | 58366 | 307.61 | 683 | 678 | 187.5 |
| D | 11 | 129 | 205855 | 1073.05 | 683 | 653 | 191.2 |
| D | 6 | 42 | 198509 | 1034.63 | 683 | 653 | 191.2 |
| D | 7 | 96 | 131776 | 685.67 | 683 | 653 | 191.2 |
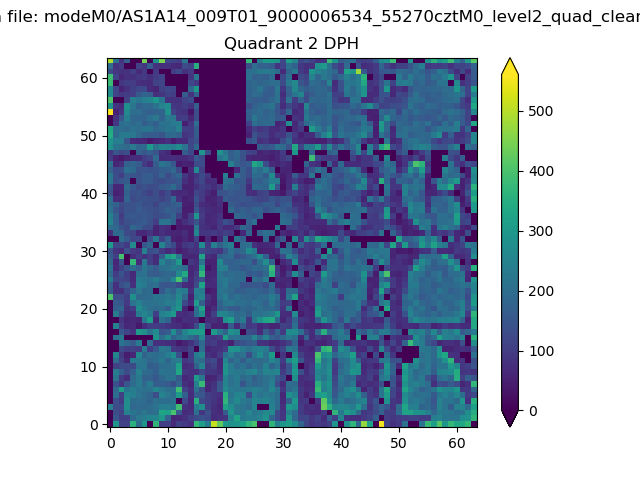
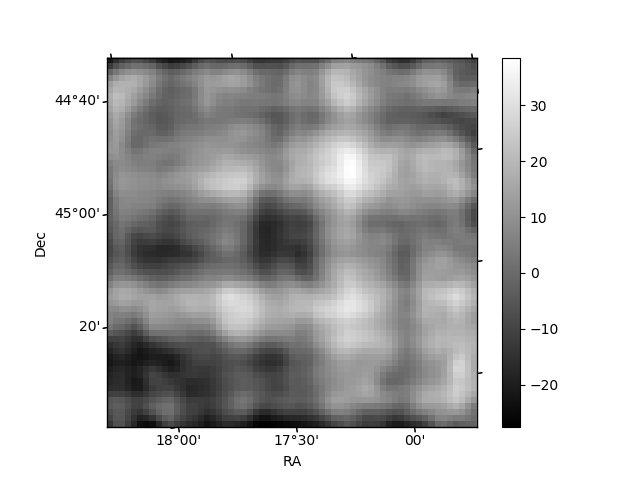
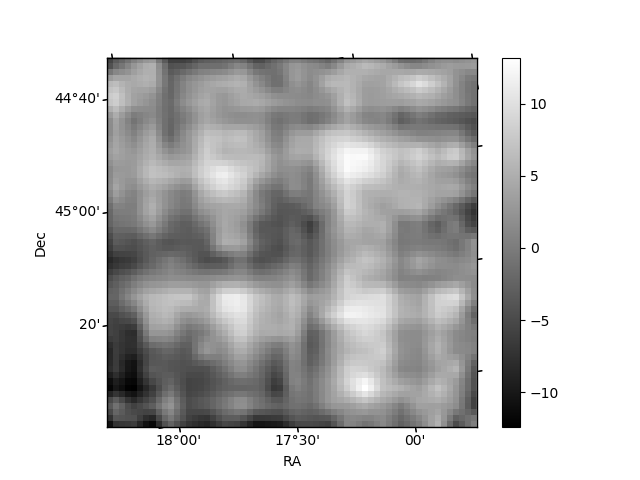
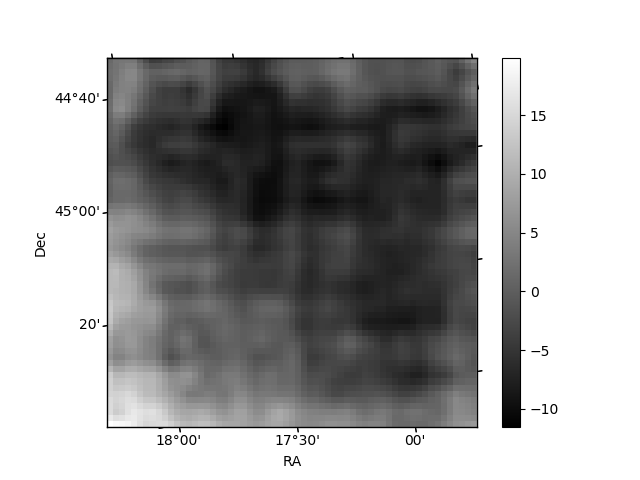
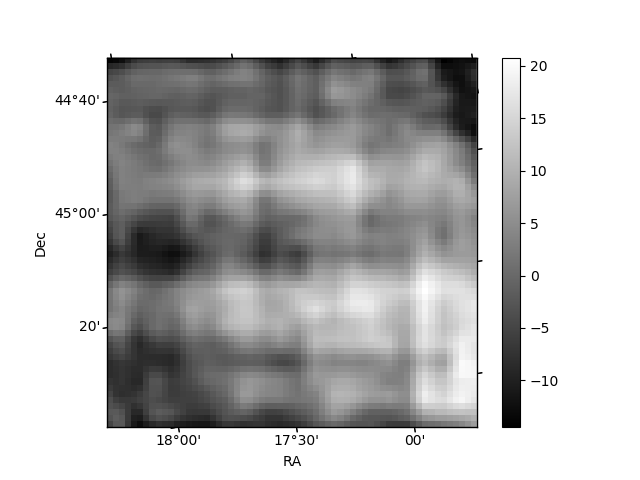
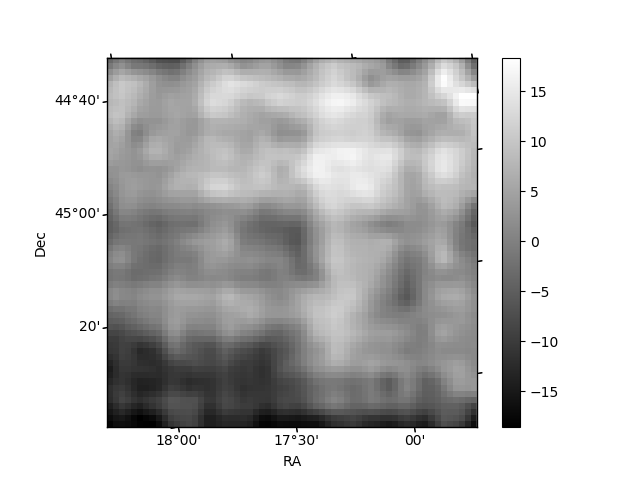
Histogram calculated using DETX and DETY for each event in the final _common_clean file
| Quadrant A | 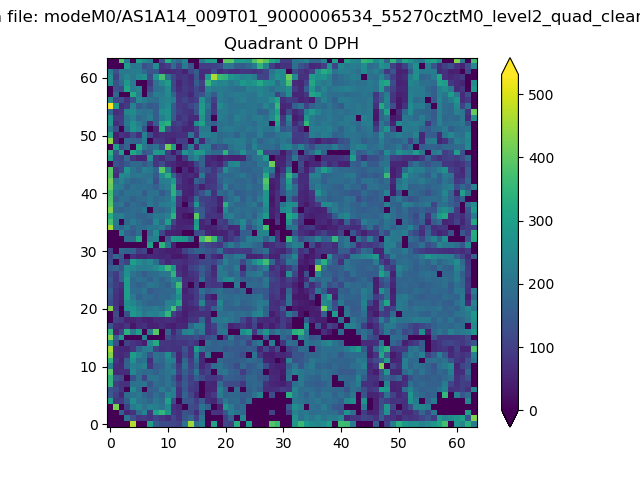 |
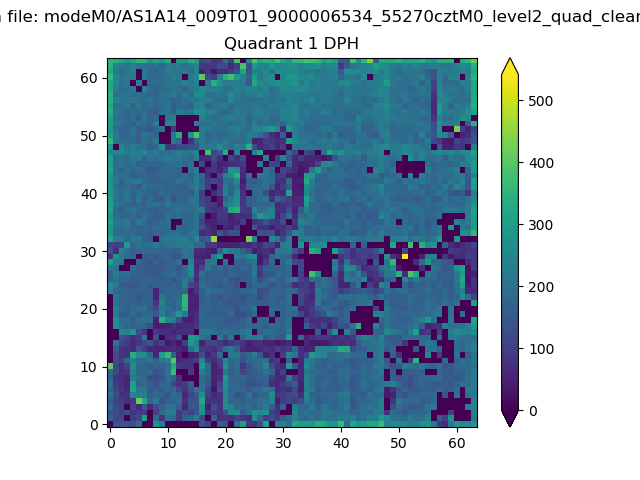 |
Quadrant B |
|---|---|---|---|
| Quadrant D | 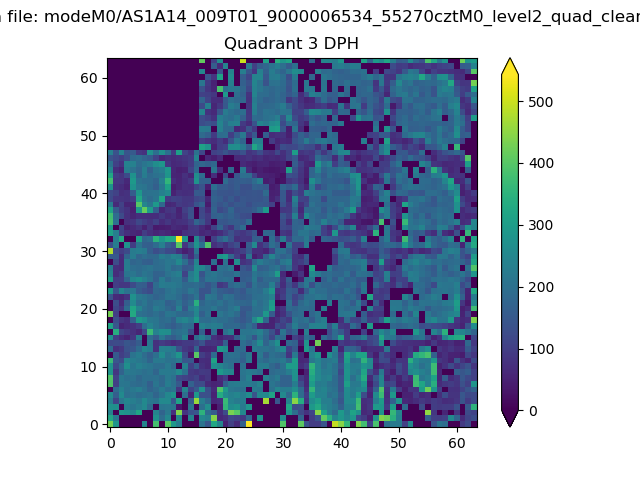 |
 |
Quadrant C |
| Plot type | Count rate plots | Images |
|---|---|---|
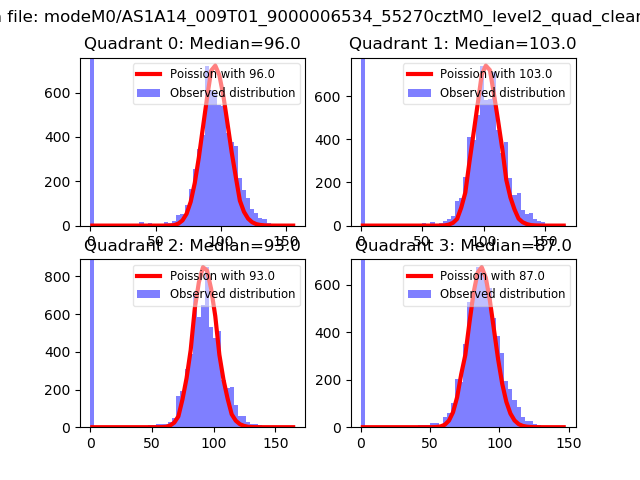
| Comparison with Poisson distribution Blue bars denote a histogram of data divided into 1 sec bins. Red curve is a Poisson curve with rate = median count rate of data. |
 |
 |
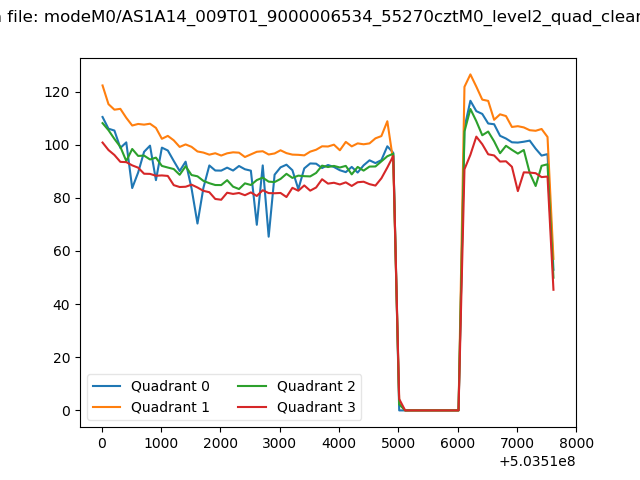
| Quadrant-wise count rates Data is divided into 100 sec bins |
 |
|
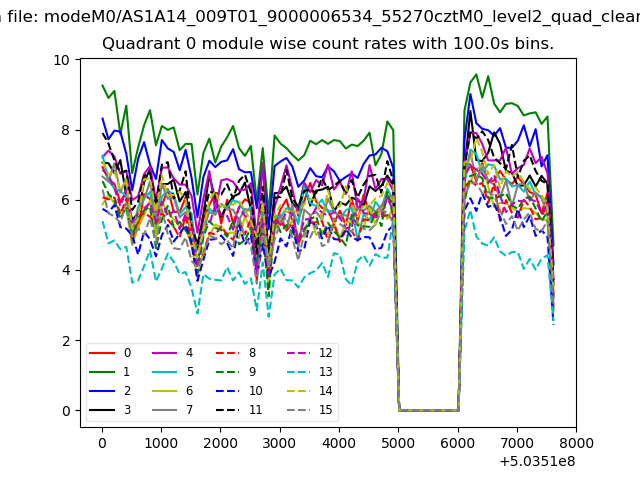
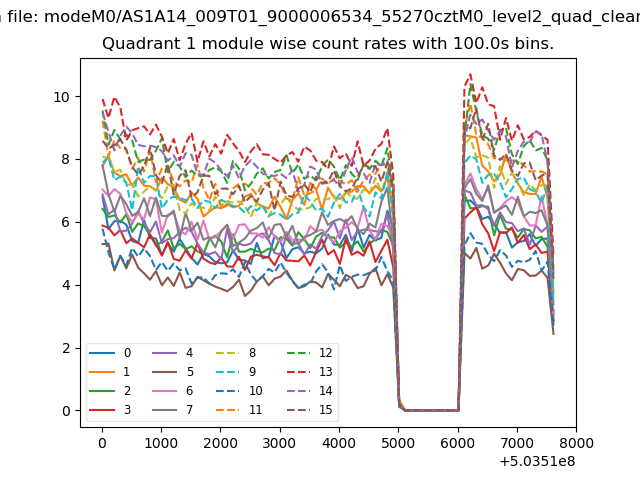
| Module-wise count rates for Quadrant A Data is divided into 100 sec bins |
 |
 |
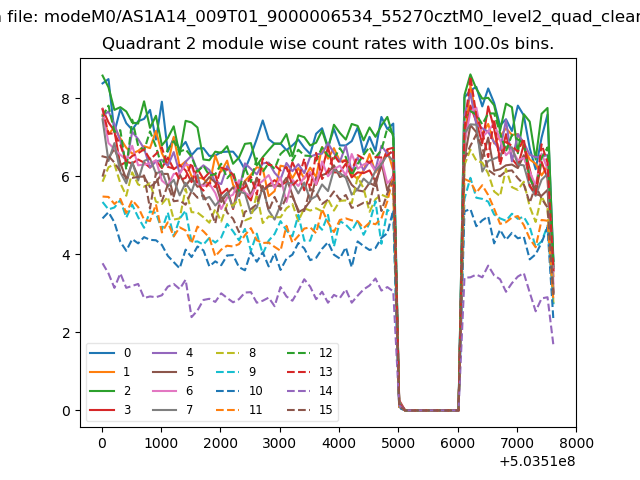
| Module-wise count rates for Quadrant B Data is divided into 100 sec bins |
 |
 |
| Module-wise count rates for Quadrant C Data is divided into 100 sec bins |
 |
 |
| Module-wise count rates for Quadrant D Data is divided into 100 sec bins |
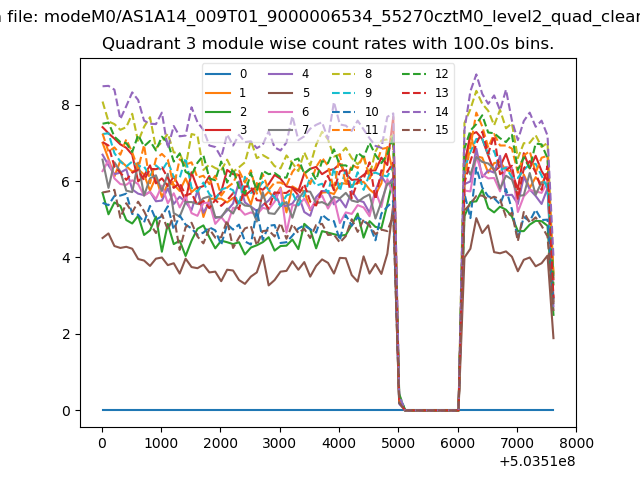 |
 |
| Parameter | Plot |
|---|---|
| CZT HV Monitor | 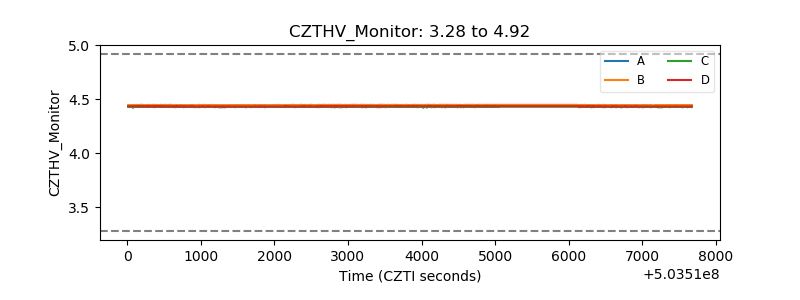 |
| D_VDD | 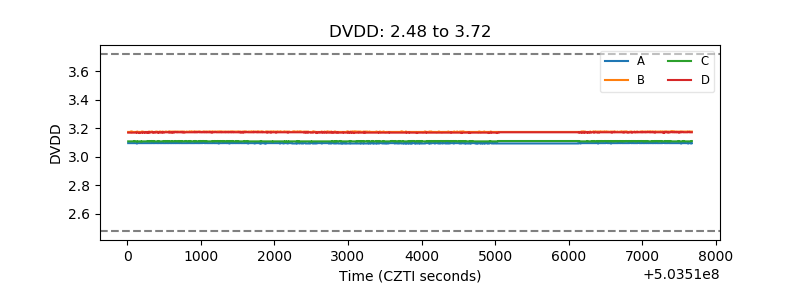 |
| Temperature 1 | 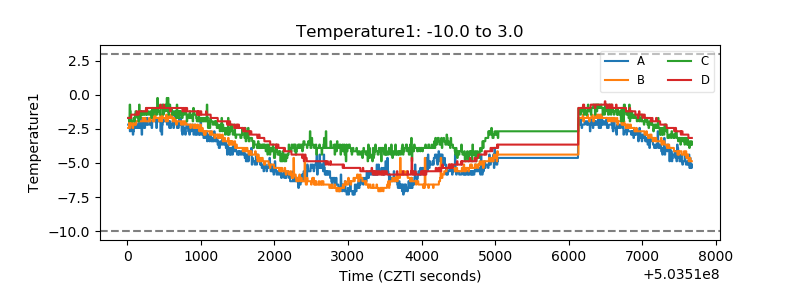 |
| Veto HV Monitor | 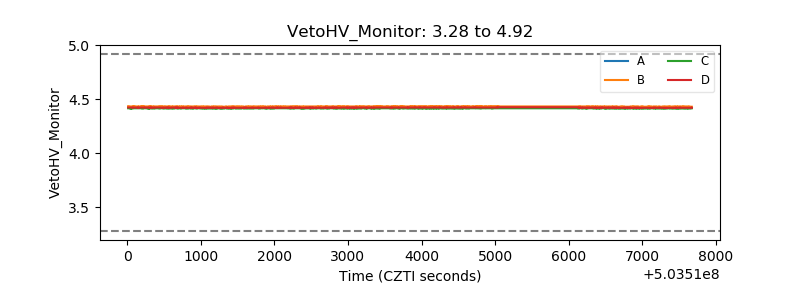 |
| Veto LLD | 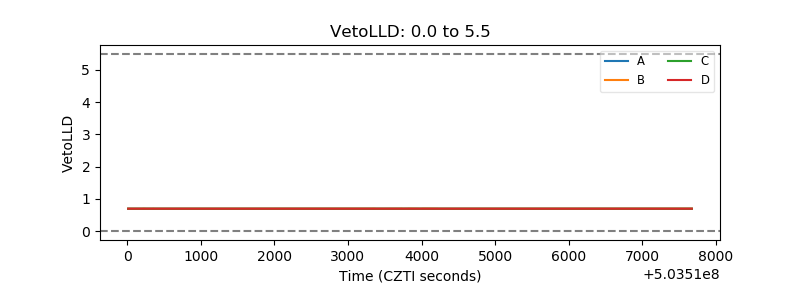 |
| Alpha Counter | 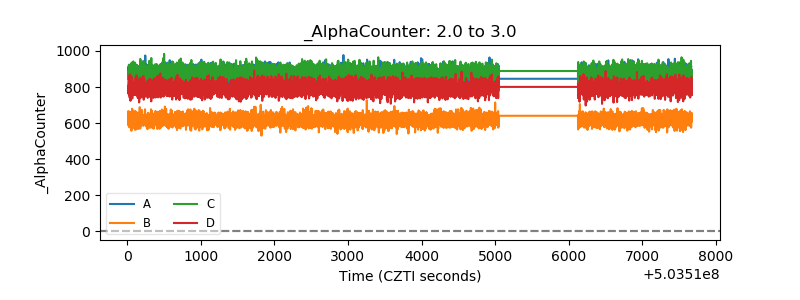 |
| _CPM_Rate | 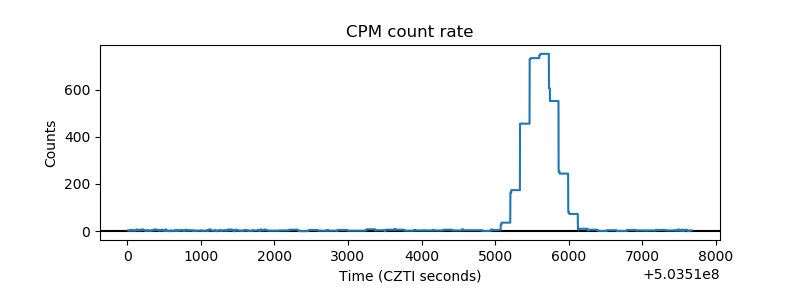 |
| CZT Counter | 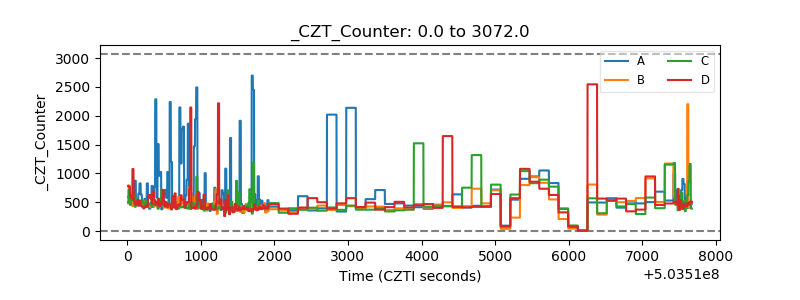 |
| +2.5 Volts monitor |  |
| +5 Volts monitor |  |
| _ROLL_ROT | 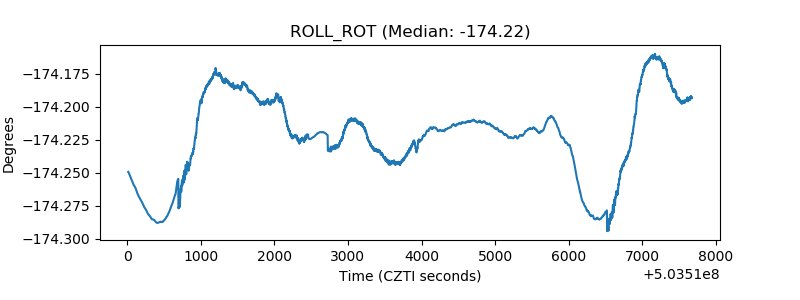 |
| _Roll_DEC | 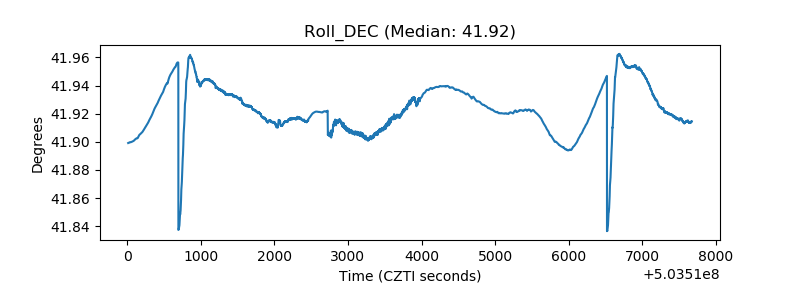 |
| _Roll_RA | 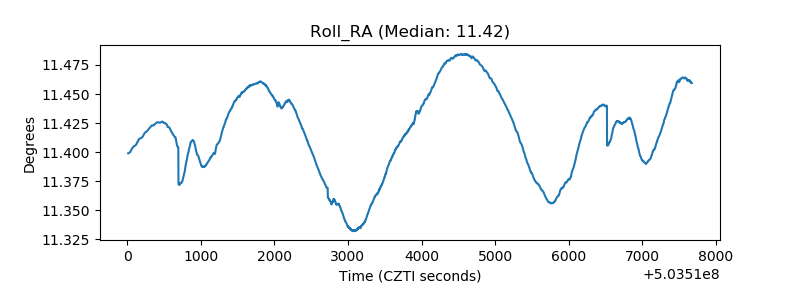 |
| Veto Counter | 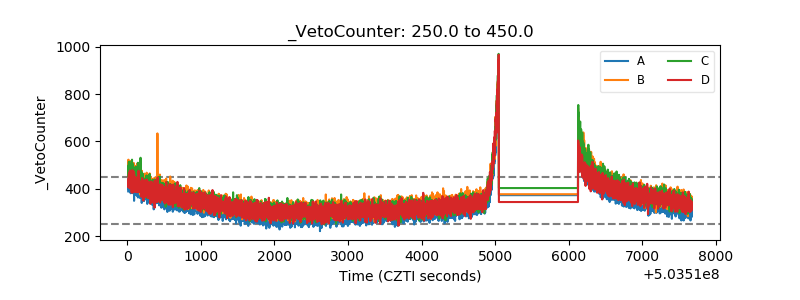 |