| Param | Original file | Final file |
|---|---|---|
| Filename | modeM0/AS1A14_009T01_9000006534_55271cztM0_level2.fits | modeM0/AS1A14_009T01_9000006534_55271cztM0_level2_quad_clean.evt |
| Size (bytes) | 386,164,800 | 95,664,960 |
| Size | 368.3 MB | 91.2 MB |
| Events in quadrant A | 3,092,959 | 625,259 |
| Events in quadrant B | 3,175,963 | 672,841 |
| Events in quadrant C | 3,905,519 | 592,356 |
| Events in quadrant D | 3,626,048 | 563,234 |
| Mode SS | |||
|---|---|---|---|
| Quadrant | BADHDUFLAG | Total packets | Discarded packets |
| A | 0 | 130 | 0 |
| B | 0 | 130 | 0 |
| C | 0 | 130 | 0 |
| D | 0 | 130 | 0 |
| Mode M0 | |||
|---|---|---|---|
| Quadrant | BADHDUFLAG | Total packets | Discarded packets |
| A | 0 | 13722 | 2 |
| B | 0 | 14054 | 2 |
| C | 0 | 16147 | 2 |
| D | 0 | 15306 | 2 |
| Mode M9 | |||
|---|---|---|---|
| Quadrant | BADHDUFLAG | Total packets | Discarded packets |
| A | 0 | 15 | 0 |
| B | 0 | 16 | 0 |
| C | 0 | 16 | 0 |
| D | 0 | 16 | 0 |
| Quadrant | Total seconds | Saturated seconds | Saturation percentage |
|---|---|---|---|
| A | 6348 | 47 | 0.740391% |
| B | 6348 | 67 | 1.055451% |
| C | 6348 | 224 | 3.528670% |
| D | 6347 | 140 | 2.205767% |
Noise dominated data is calculated using 1-second bins in cleaned event files. If a bin has >2000 counts, and if more than 50% of those come from <1% of pixels, then it is considered to be noise-dominated and hence unusable.
| Quadrant | # 1 sec bins | Bins with >0 counts | Bins with >2000 counts | High rate bins dominated by noise | Noise dominated (total time) | Noise dominated (detector-on time) | Marked lightcurve |
|---|---|---|---|---|---|---|---|
| A | 7488 | 6349 | 3 | 3 | 0.04% | 0.05% | 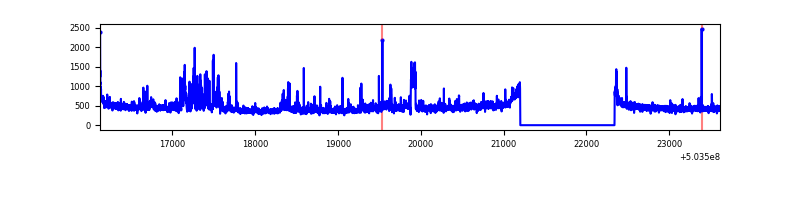 |
| B | 7488 | 6349 | 14 | 14 | 0.19% | 0.22% | 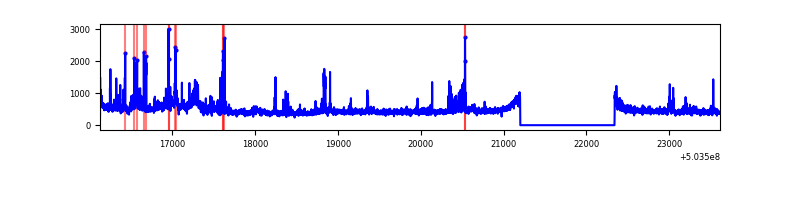 |
| C | 7488 | 6349 | 189 | 189 | 2.52% | 2.98% | 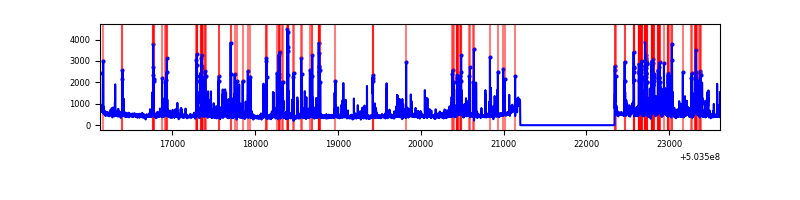 |
| D | 7487 | 6348 | 94 | 94 | 1.26% | 1.48% | 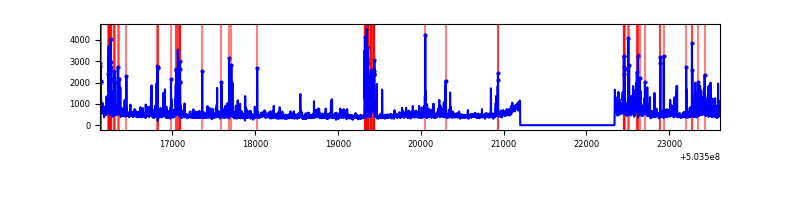 |
Top three noisy pixels from each quadrant. If the there are fewer than three noisy pixels in the level2.evt file, extra rows are filled as -1
| Pixel properties | Quadrant properties | ||||||
|---|---|---|---|---|---|---|---|
| Quadrant | DetID | PixID | Counts | Sigma | Mean | Median | Sigma |
| A | 3 | 14 | 242040 | 1442.57 | 680 | 664 | 167.3 |
| A | 12 | 115 | 108766 | 646.07 | 680 | 664 | 167.3 |
| A | 7 | 243 | 27374 | 159.63 | 680 | 664 | 167.3 |
| B | 7 | 0 | 185543 | 1290.37 | 675 | 651 | 143.3 |
| B | 5 | 185 | 97477 | 675.75 | 675 | 651 | 143.3 |
| B | 4 | 81 | 69797 | 482.57 | 675 | 651 | 143.3 |
| C | 15 | 147 | 496222 | 2714.2 | 664 | 657 | 182.6 |
| C | 13 | 3 | 441938 | 2416.89 | 664 | 657 | 182.6 |
| C | 10 | 22 | 86336 | 469.26 | 664 | 657 | 182.6 |
| D | 11 | 129 | 632723 | 3381.66 | 664 | 634 | 186.9 |
| D | 6 | 239 | 198278 | 1057.39 | 664 | 634 | 186.9 |
| D | 7 | 96 | 51718 | 273.3 | 664 | 634 | 186.9 |
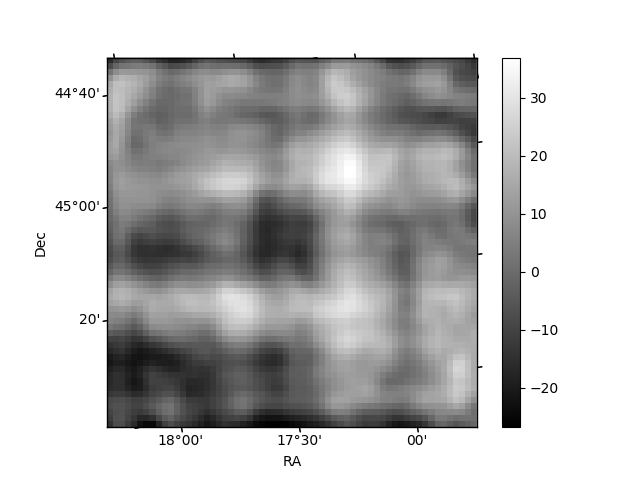
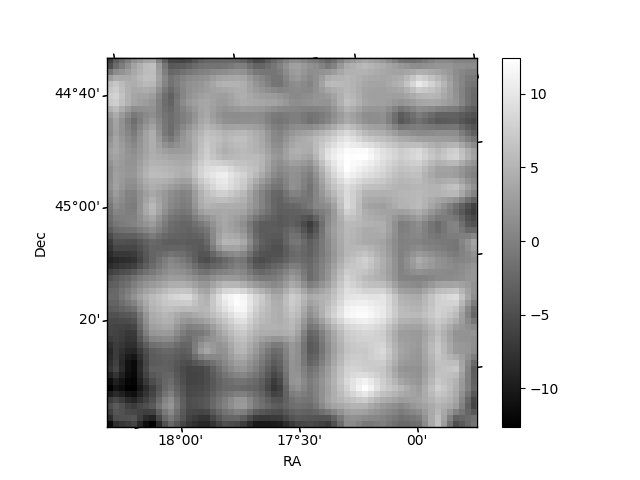
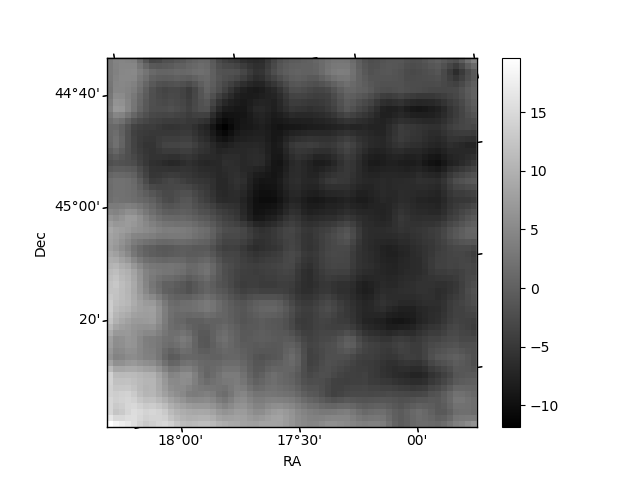
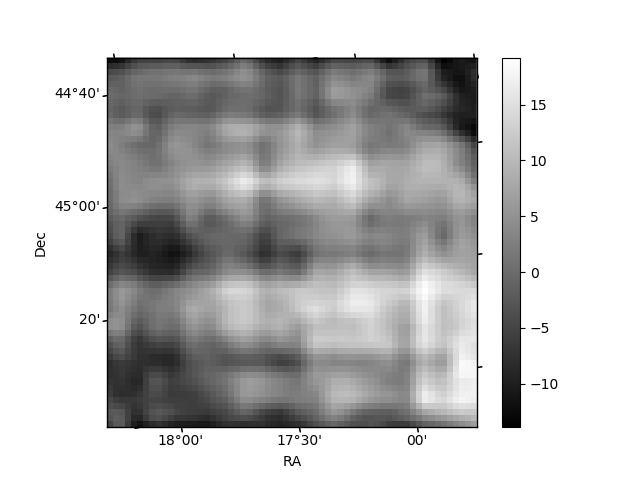
Histogram calculated using DETX and DETY for each event in the final _common_clean file
| Quadrant A | 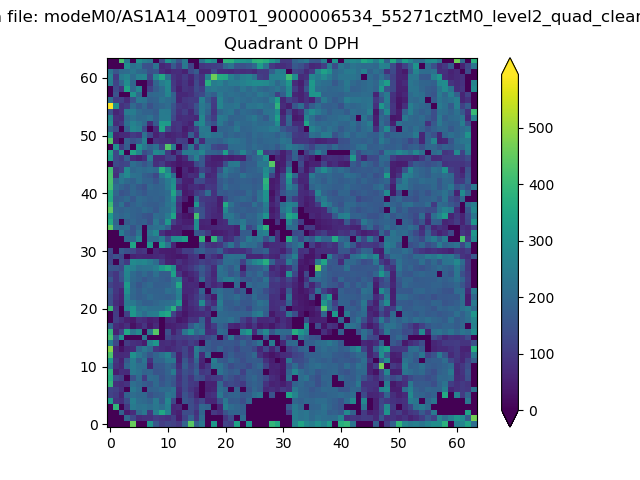 |
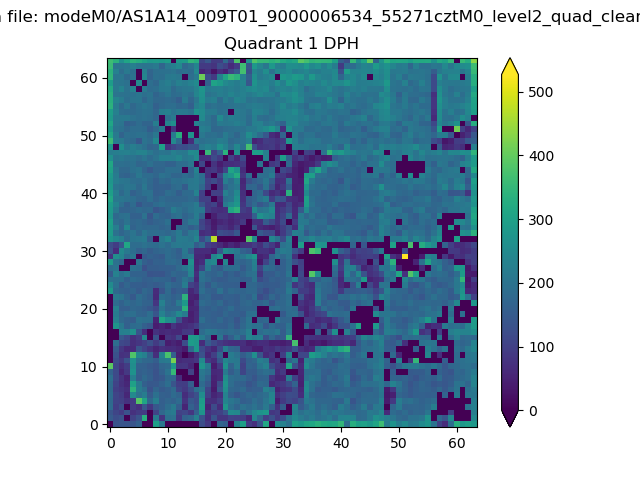 |
Quadrant B |
|---|---|---|---|
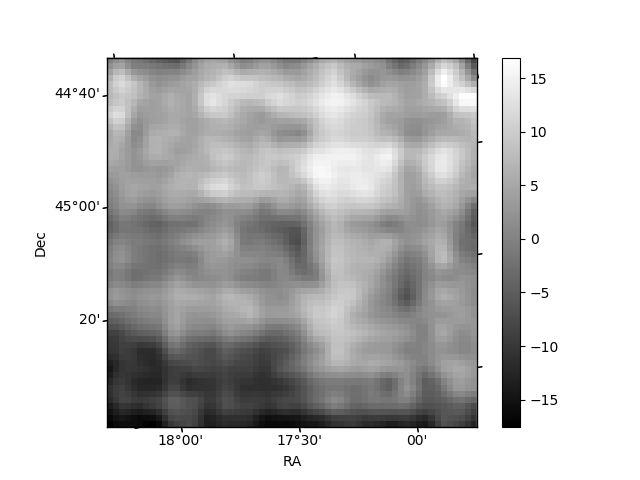
| Quadrant D | 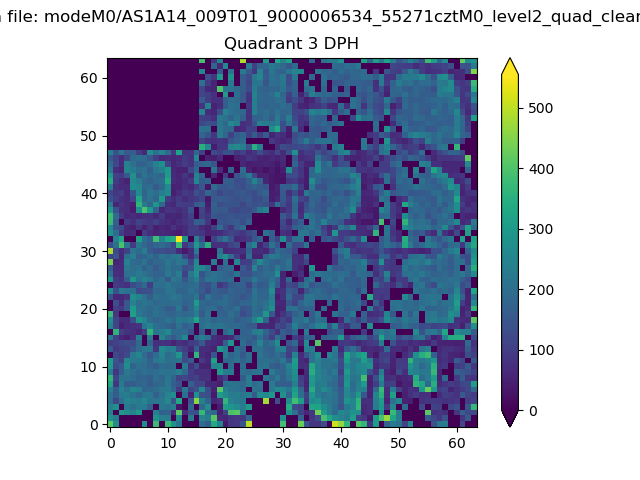 |
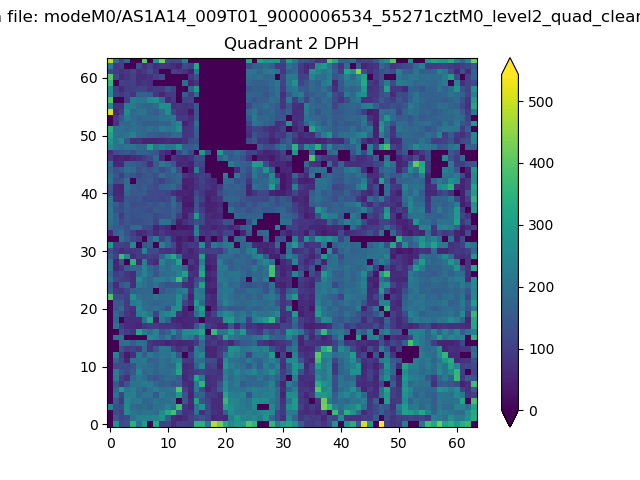 |
Quadrant C |
| Plot type | Count rate plots | Images |
|---|---|---|
| Comparison with Poisson distribution Blue bars denote a histogram of data divided into 1 sec bins. Red curve is a Poisson curve with rate = median count rate of data. |
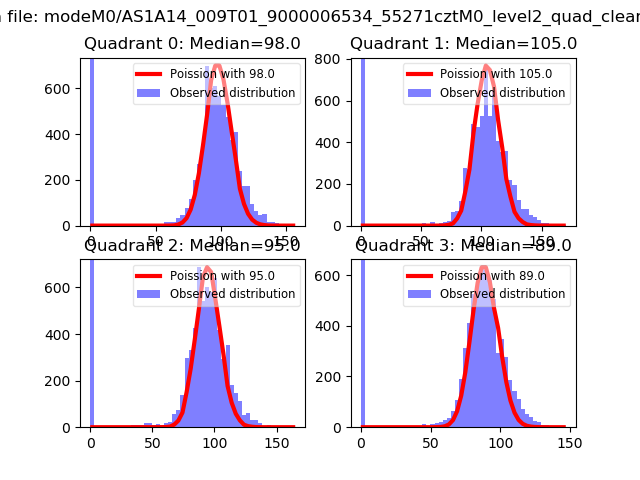 |
 |
| Quadrant-wise count rates Data is divided into 100 sec bins |
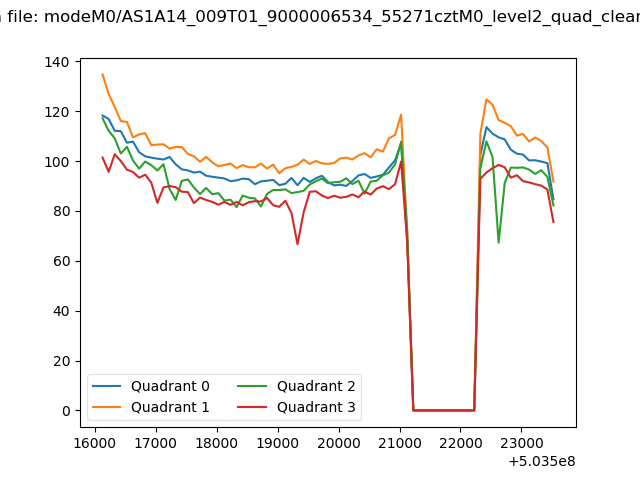 |
|
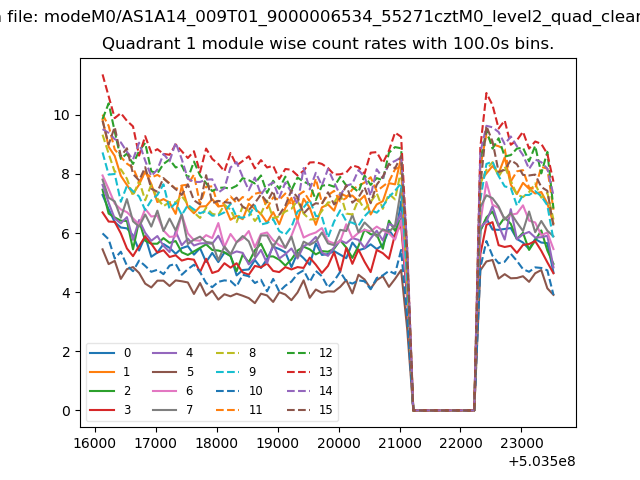
| Module-wise count rates for Quadrant A Data is divided into 100 sec bins |
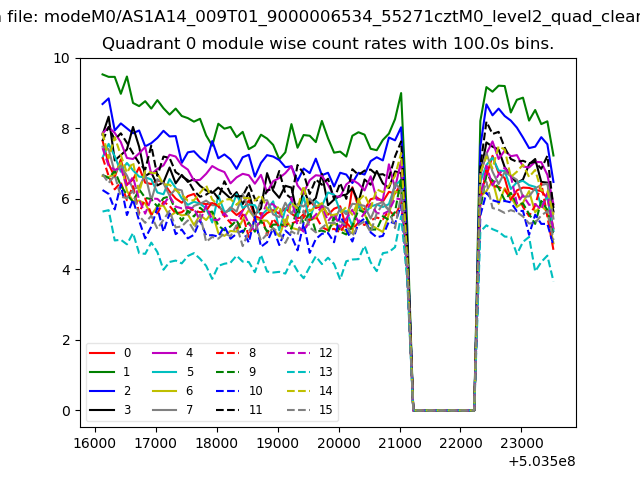 |
 |
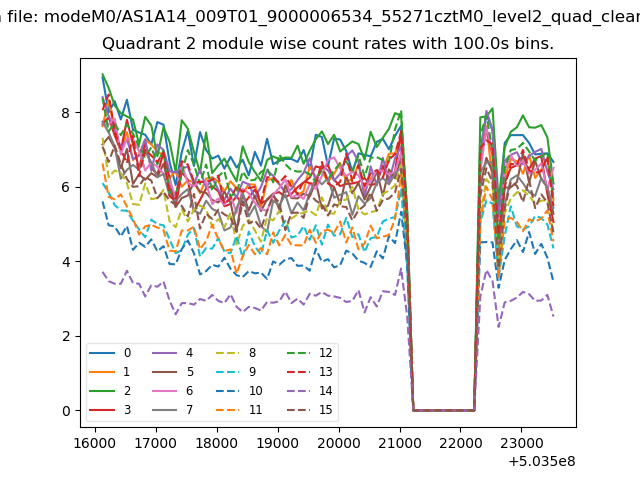
| Module-wise count rates for Quadrant B Data is divided into 100 sec bins |
 |
 |
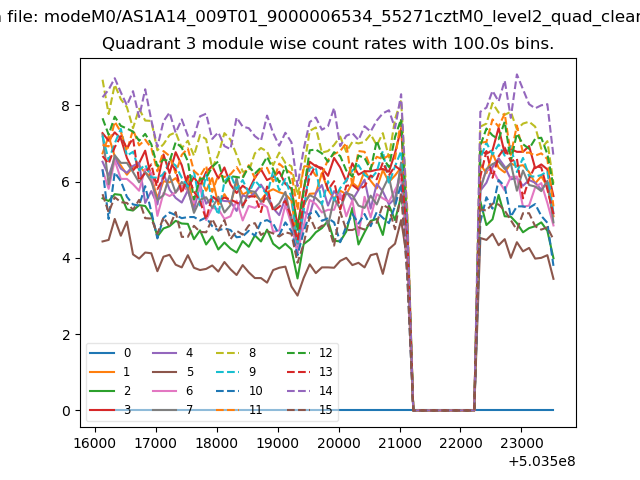
| Module-wise count rates for Quadrant C Data is divided into 100 sec bins |
 |
 |
| Module-wise count rates for Quadrant D Data is divided into 100 sec bins |
 |
 |
| Parameter | Plot |
|---|---|
| CZT HV Monitor | 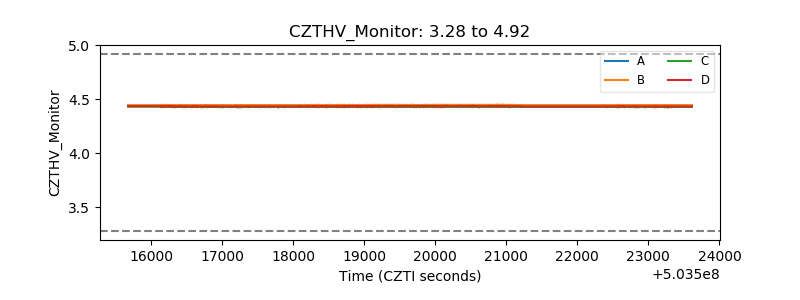 |
| D_VDD | 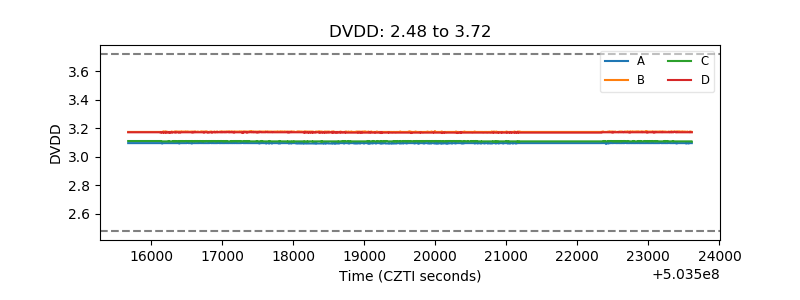 |
| Temperature 1 | 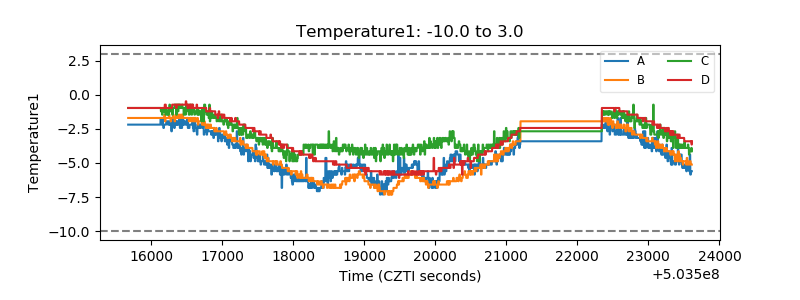 |
| Veto HV Monitor | 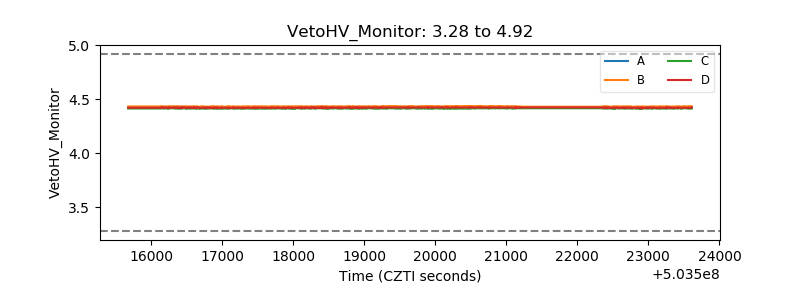 |
| Veto LLD | 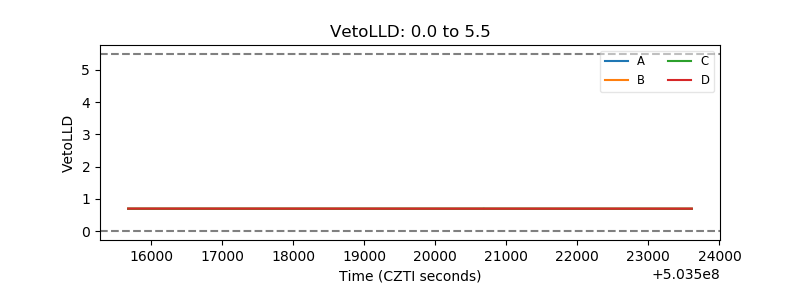 |
| Alpha Counter | 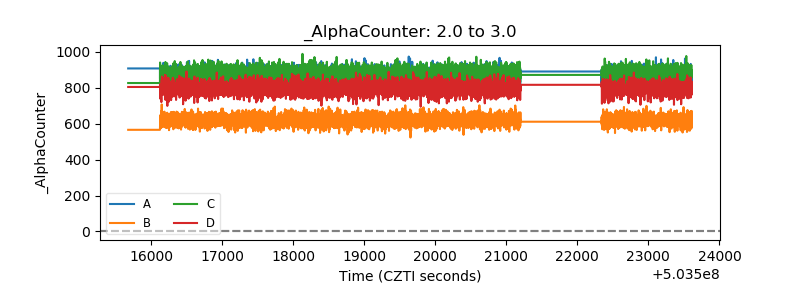 |
| _CPM_Rate | 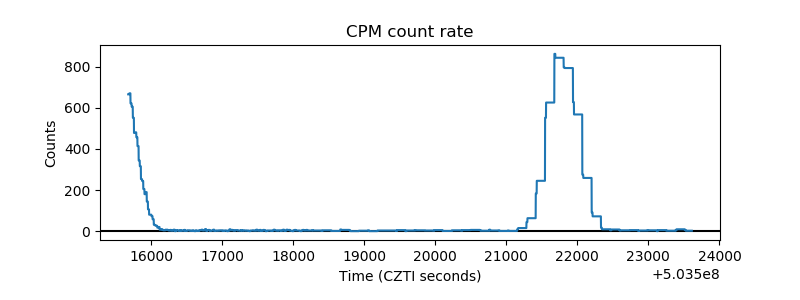 |
| CZT Counter | 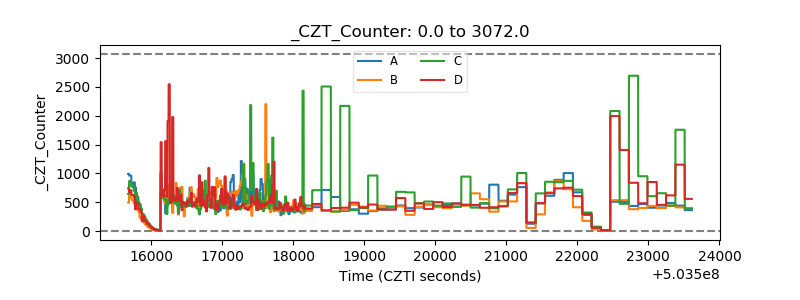 |
| +2.5 Volts monitor | 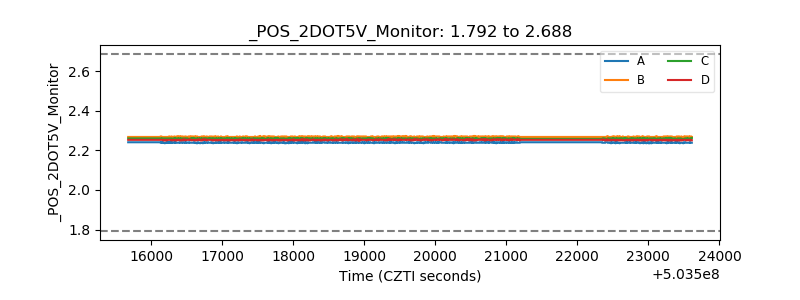 |
| +5 Volts monitor | 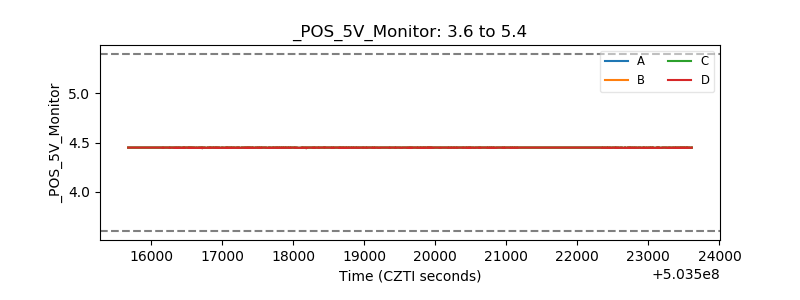 |
| _ROLL_ROT | 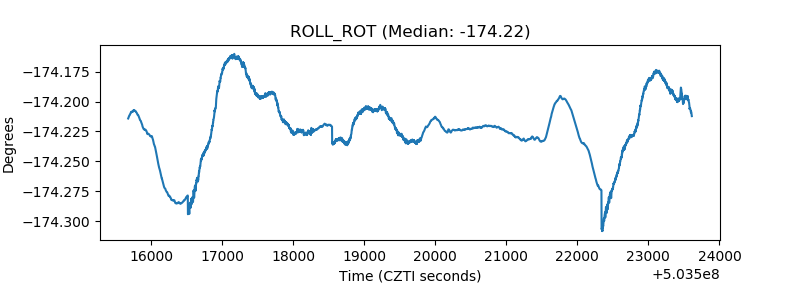 |
| _Roll_DEC | 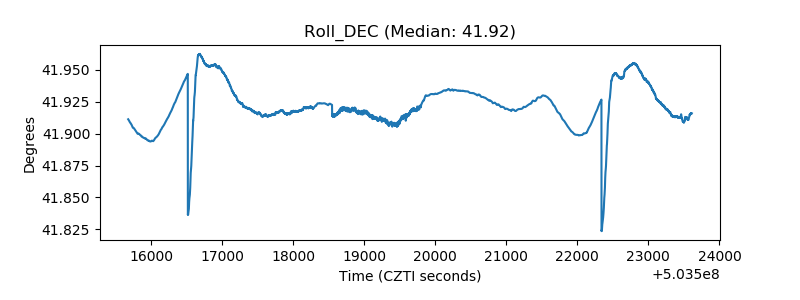 |
| _Roll_RA | 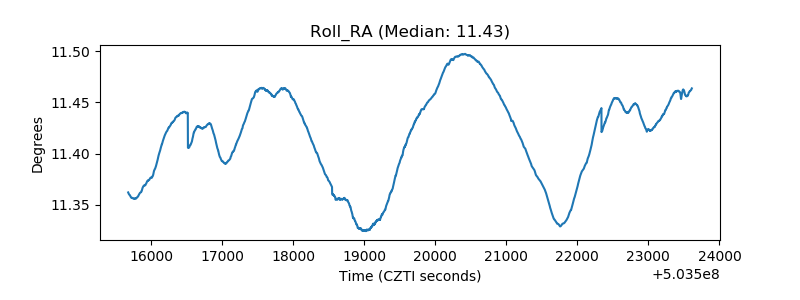 |
| Veto Counter | 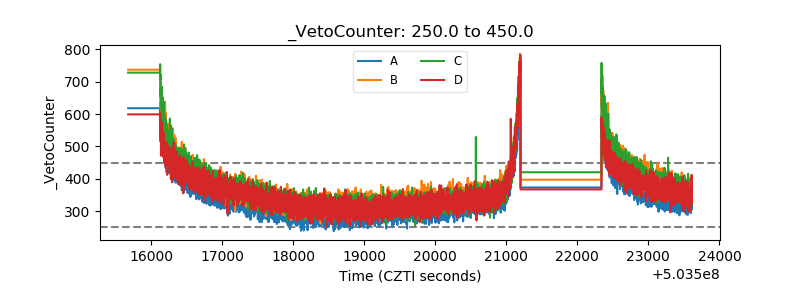 |