| Param | Original file | Final file |
|---|---|---|
| Filename | modeM0/AS1A14_009T01_9000006534_55272cztM0_level2.fits | modeM0/AS1A14_009T01_9000006534_55272cztM0_level2_quad_clean.evt |
| Size (bytes) | 386,184,960 | 96,134,400 |
| Size | 368.3 MB | 91.7 MB |
| Events in quadrant A | 3,025,296 | 626,971 |
| Events in quadrant B | 2,837,669 | 677,585 |
| Events in quadrant C | 3,924,125 | 592,790 |
| Events in quadrant D | 4,007,934 | 564,992 |
| Mode SS | |||
|---|---|---|---|
| Quadrant | BADHDUFLAG | Total packets | Discarded packets |
| A | 0 | 132 | 0 |
| B | 0 | 134 | 0 |
| C | 0 | 134 | 0 |
| D | 0 | 134 | 0 |
| Mode M0 | |||
|---|---|---|---|
| Quadrant | BADHDUFLAG | Total packets | Discarded packets |
| A | 0 | 13800 | 2 |
| B | 0 | 13304 | 2 |
| C | 0 | 16224 | 2 |
| D | 0 | 16567 | 2 |
| Mode M9 | |||
|---|---|---|---|
| Quadrant | BADHDUFLAG | Total packets | Discarded packets |
| A | 0 | 21 | 0 |
| B | 0 | 22 | 0 |
| C | 0 | 22 | 0 |
| D | 0 | 22 | 0 |
| Quadrant | Total seconds | Saturated seconds | Saturation percentage |
|---|---|---|---|
| A | 6426 | 61 | 0.949269% |
| B | 6426 | 40 | 0.622471% |
| C | 6426 | 236 | 3.672580% |
| D | 6426 | 151 | 2.349829% |
Noise dominated data is calculated using 1-second bins in cleaned event files. If a bin has >2000 counts, and if more than 50% of those come from <1% of pixels, then it is considered to be noise-dominated and hence unusable.
| Quadrant | # 1 sec bins | Bins with >0 counts | Bins with >2000 counts | High rate bins dominated by noise | Noise dominated (total time) | Noise dominated (detector-on time) | Marked lightcurve |
|---|---|---|---|---|---|---|---|
| A | 7571 | 6427 | 30 | 30 | 0.40% | 0.47% | 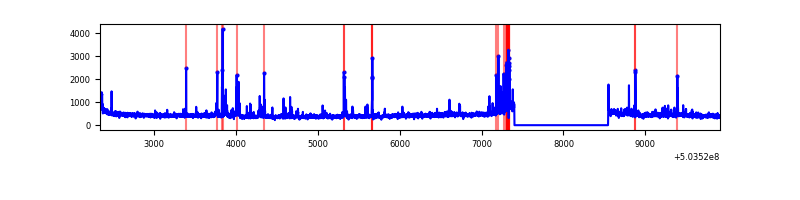 |
| B | 7571 | 6427 | 4 | 4 | 0.05% | 0.06% | 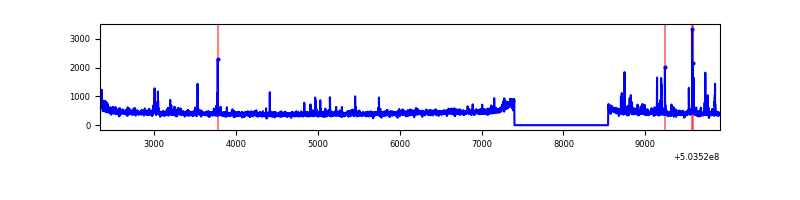 |
| C | 7571 | 6427 | 193 | 193 | 2.55% | 3.00% | 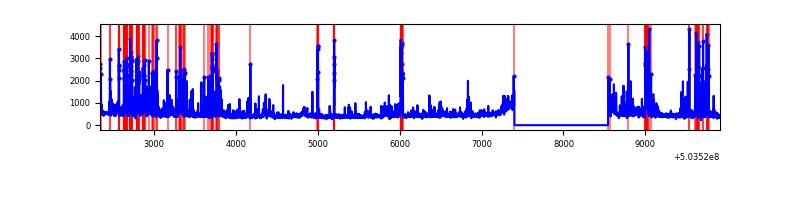 |
| D | 7571 | 6427 | 141 | 141 | 1.86% | 2.19% | 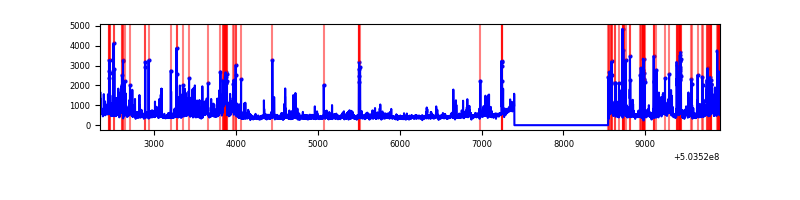 |
Top three noisy pixels from each quadrant. If the there are fewer than three noisy pixels in the level2.evt file, extra rows are filled as -1
| Pixel properties | Quadrant properties | ||||||
|---|---|---|---|---|---|---|---|
| Quadrant | DetID | PixID | Counts | Sigma | Mean | Median | Sigma |
| A | 0 | 8 | 242564 | 1441.68 | 678 | 661 | 167.8 |
| A | 3 | 14 | 54721 | 322.18 | 678 | 661 | 167.8 |
| A | 7 | 7 | 28801 | 167.71 | 678 | 661 | 167.8 |
| B | 0 | 199 | 63924 | 434.86 | 679 | 654 | 145.5 |
| B | 10 | 247 | 22104 | 147.43 | 679 | 654 | 145.5 |
| B | 12 | 111 | 17156 | 113.42 | 679 | 654 | 145.5 |
| C | 15 | 147 | 617912 | 3325.25 | 667 | 659 | 185.6 |
| C | 13 | 3 | 236941 | 1272.89 | 667 | 659 | 185.6 |
| C | 14 | 80 | 139173 | 746.2 | 667 | 659 | 185.6 |
| D | 11 | 129 | 912767 | 4891.85 | 662 | 633 | 186.5 |
| D | 6 | 239 | 130796 | 698.07 | 662 | 633 | 186.5 |
| D | 7 | 96 | 97509 | 519.55 | 662 | 633 | 186.5 |
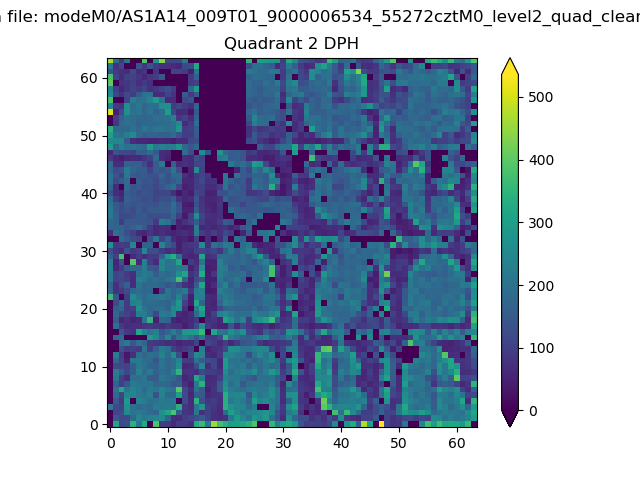
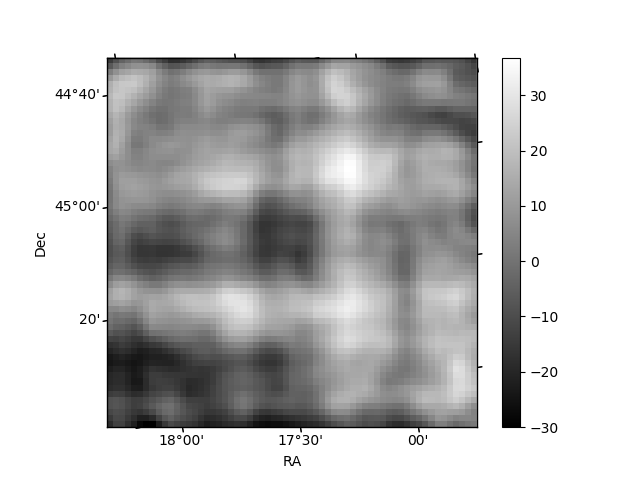
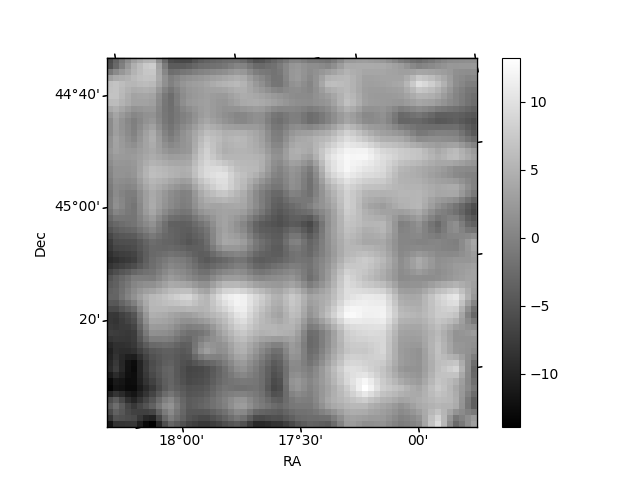
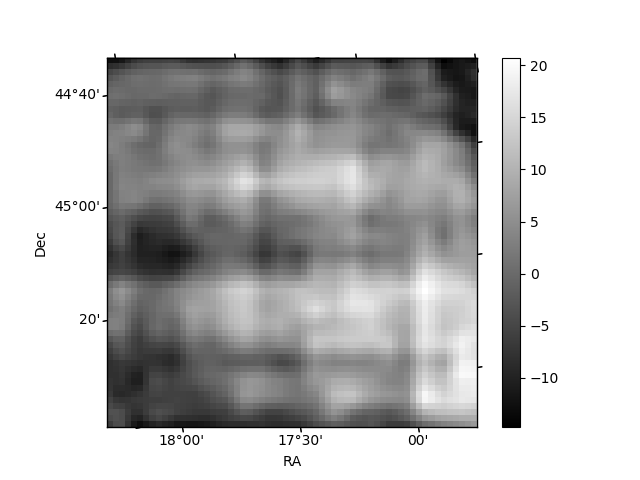
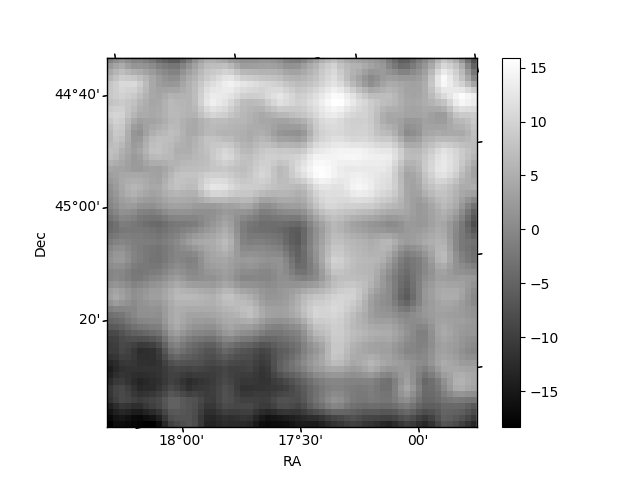
Histogram calculated using DETX and DETY for each event in the final _common_clean file
| Quadrant A | 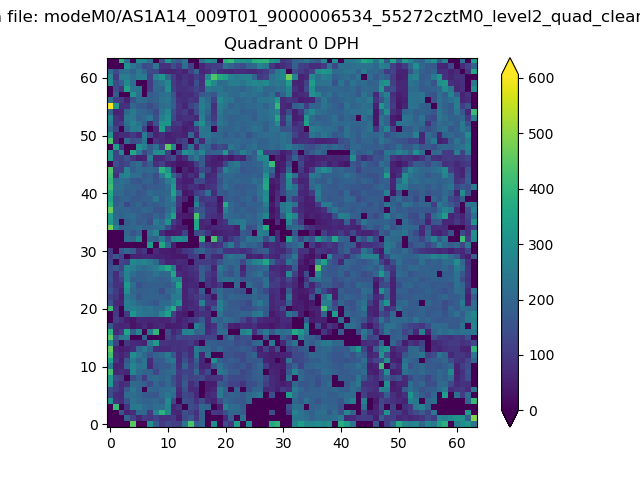 |
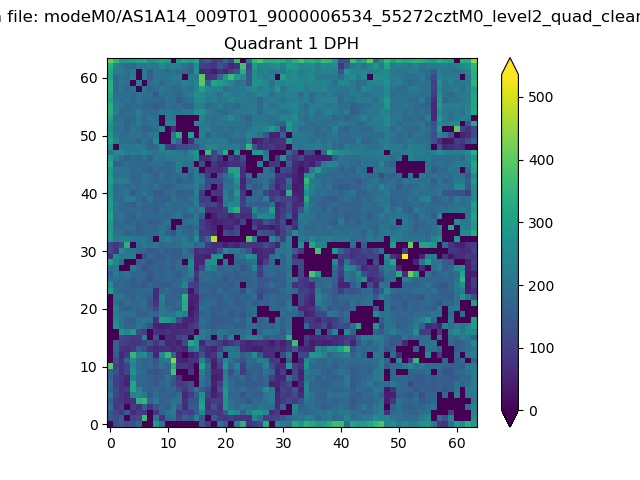 |
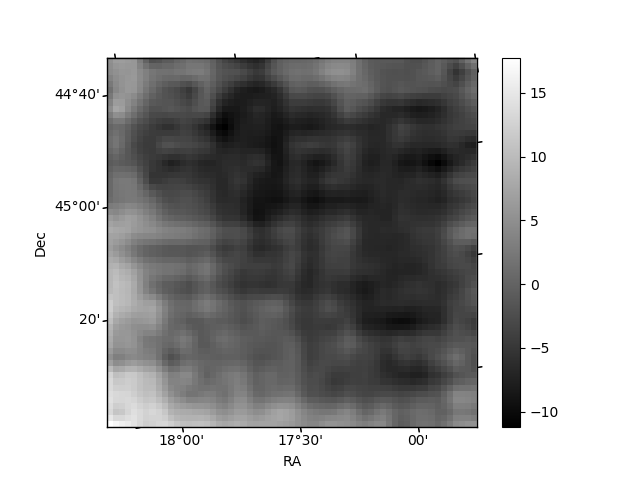
Quadrant B |
|---|---|---|---|
| Quadrant D | 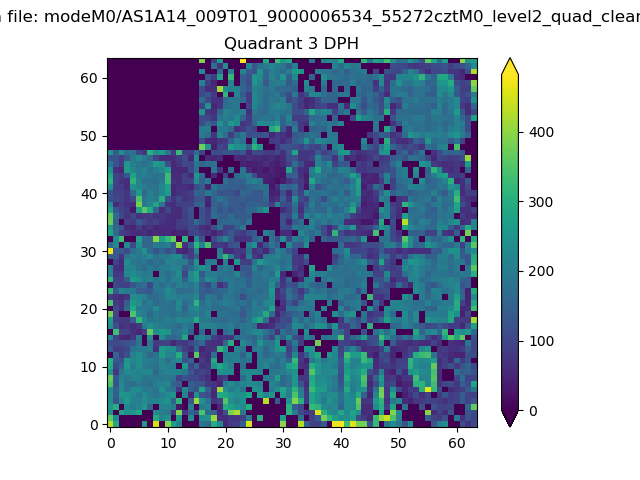 |
 |
Quadrant C |
| Plot type | Count rate plots | Images |
|---|---|---|
| Comparison with Poisson distribution Blue bars denote a histogram of data divided into 1 sec bins. Red curve is a Poisson curve with rate = median count rate of data. |
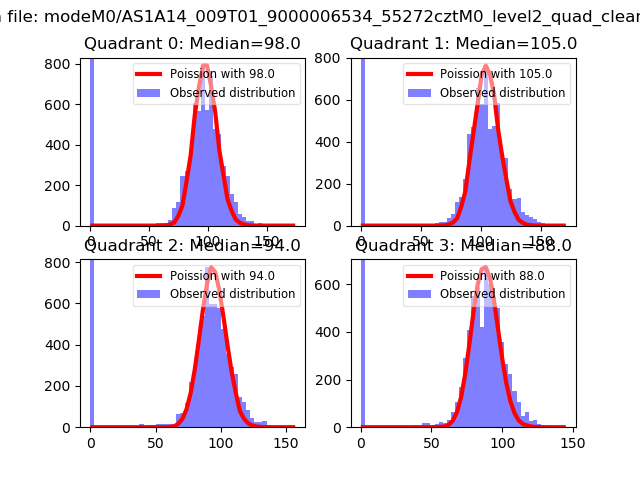 |
 |
| Quadrant-wise count rates Data is divided into 100 sec bins |
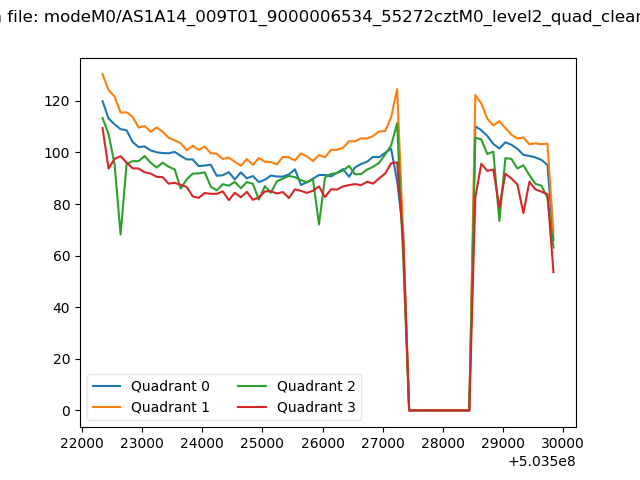 |
|
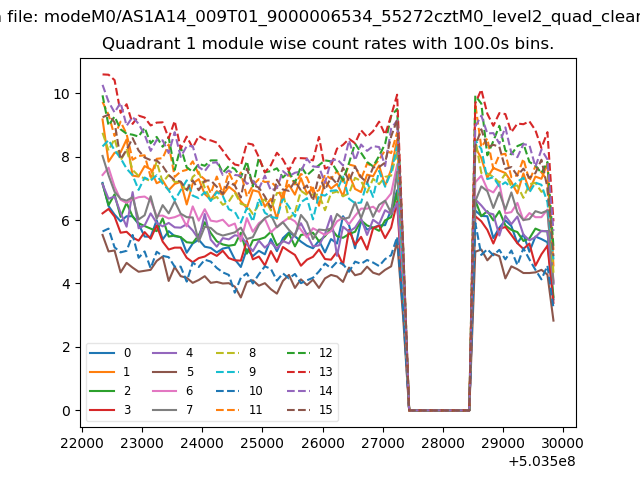
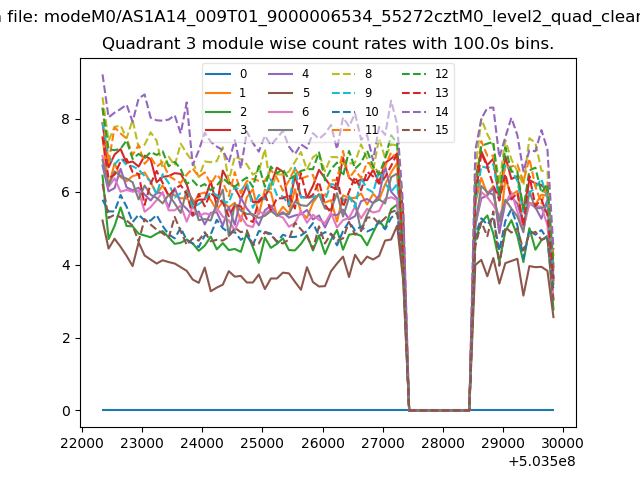
| Module-wise count rates for Quadrant A Data is divided into 100 sec bins |
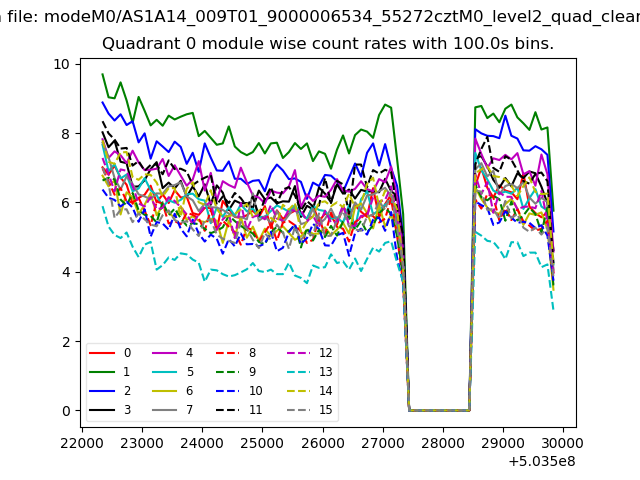 |
 |
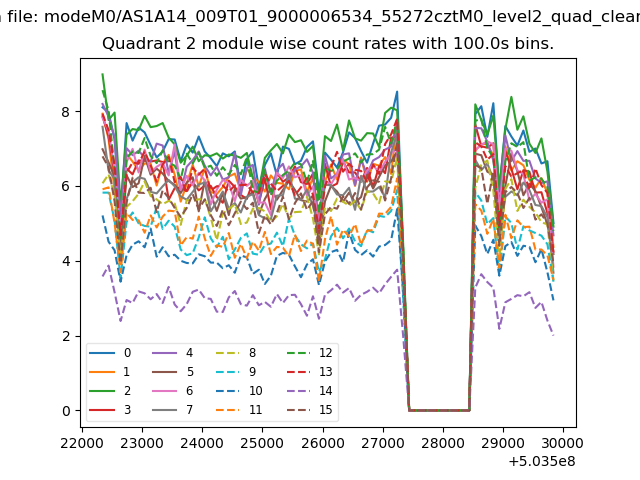
| Module-wise count rates for Quadrant B Data is divided into 100 sec bins |
 |
 |
| Module-wise count rates for Quadrant C Data is divided into 100 sec bins |
 |
 |
| Module-wise count rates for Quadrant D Data is divided into 100 sec bins |
 |
 |
| Parameter | Plot |
|---|---|
| CZT HV Monitor | 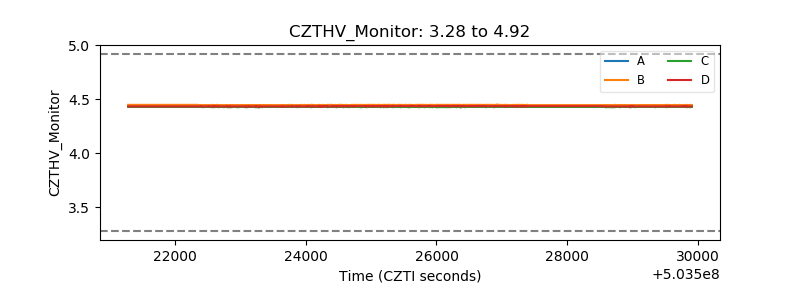 |
| D_VDD | 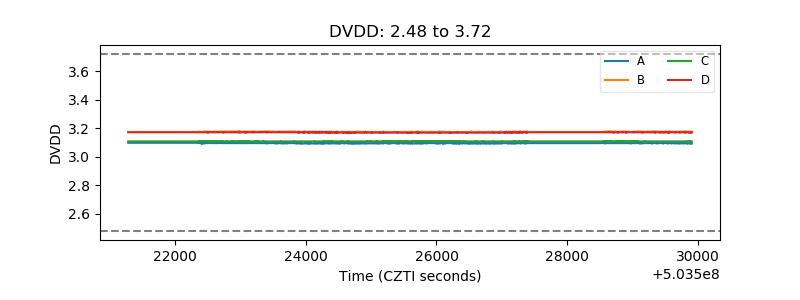 |
| Temperature 1 | 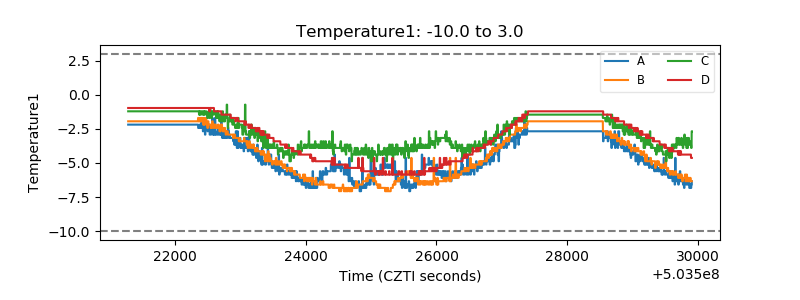 |
| Veto HV Monitor | 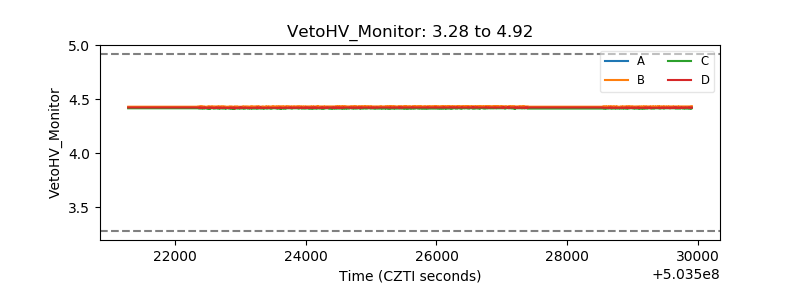 |
| Veto LLD | 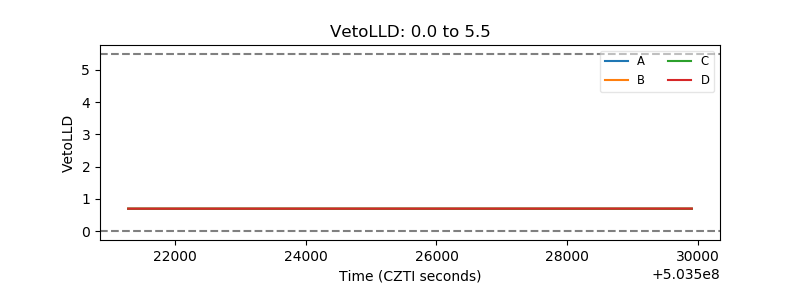 |
| Alpha Counter | 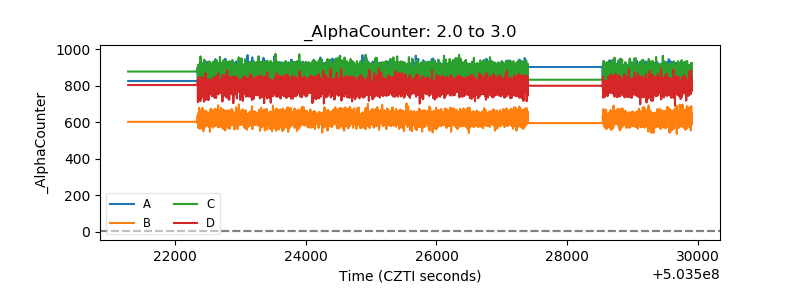 |
| _CPM_Rate | 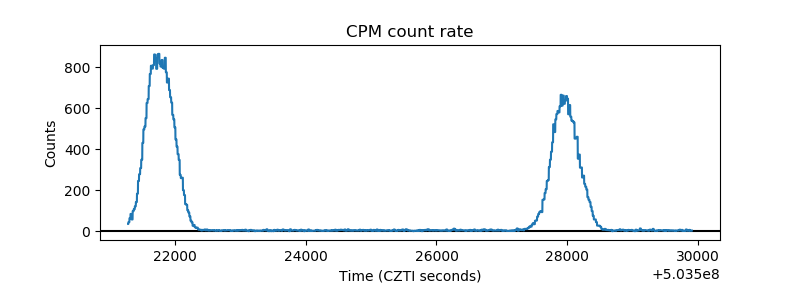 |
| CZT Counter | 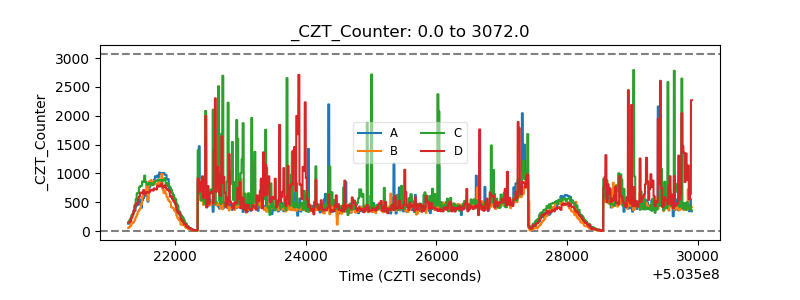 |
| +2.5 Volts monitor | 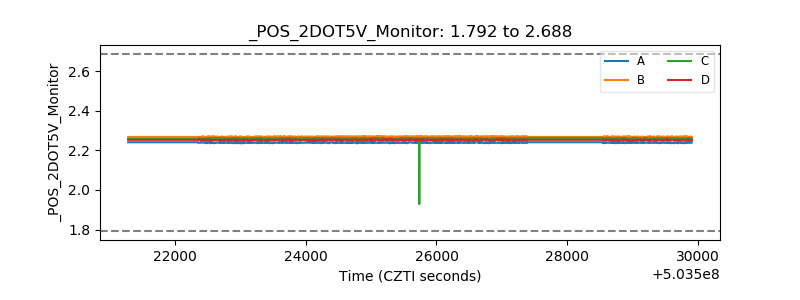 |
| +5 Volts monitor | 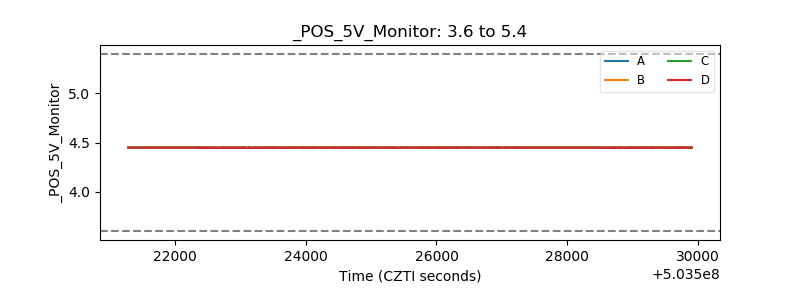 |
| _ROLL_ROT | 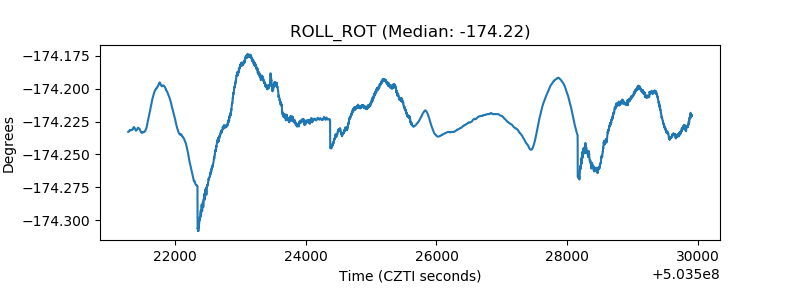 |
| _Roll_DEC | 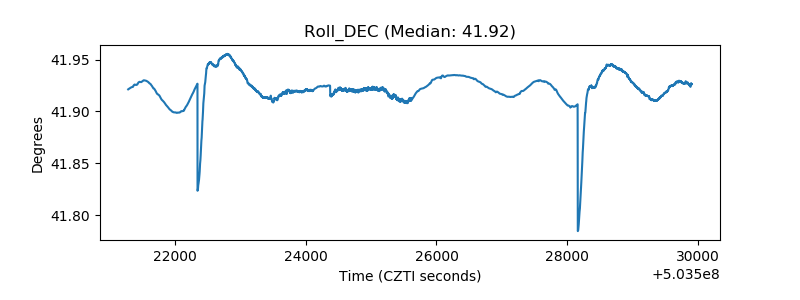 |
| _Roll_RA | 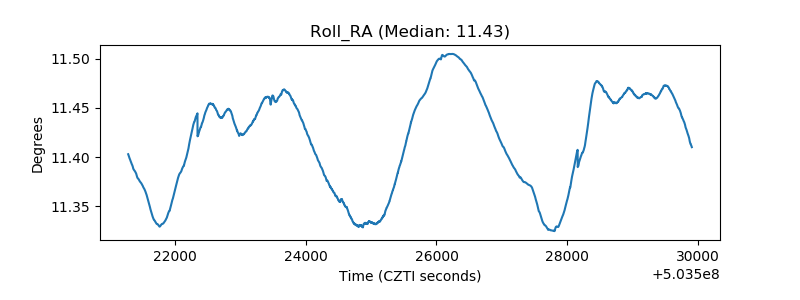 |
| Veto Counter | 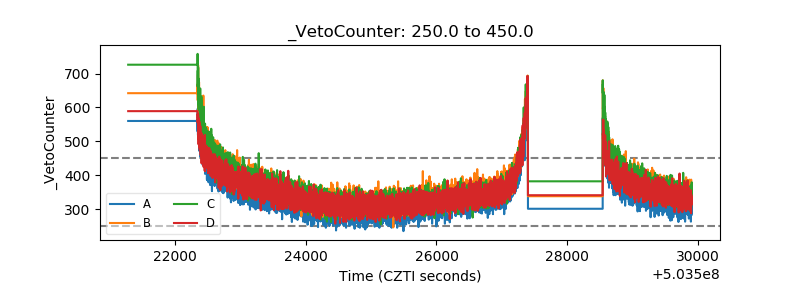 |