| Param | Original file | Final file |
|---|---|---|
| Filename | modeM0/AS1A14_009T01_9000006534_55273cztM0_level2.fits | modeM0/AS1A14_009T01_9000006534_55273cztM0_level2_quad_clean.evt |
| Size (bytes) | 427,343,040 | 94,006,080 |
| Size | 407.5 MB | 89.7 MB |
| Events in quadrant A | 4,063,625 | 602,505 |
| Events in quadrant B | 2,952,633 | 661,798 |
| Events in quadrant C | 4,195,835 | 577,682 |
| Events in quadrant D | 4,104,081 | 553,106 |
| Mode SS | |||
|---|---|---|---|
| Quadrant | BADHDUFLAG | Total packets | Discarded packets |
| A | 0 | 134 | 2 |
| B | 0 | 134 | 0 |
| C | 0 | 134 | 0 |
| D | 0 | 134 | 0 |
| Mode M0 | |||
|---|---|---|---|
| Quadrant | BADHDUFLAG | Total packets | Discarded packets |
| A | 0 | 16856 | 13 |
| B | 0 | 13698 | 9 |
| C | 0 | 17069 | 18 |
| D | 0 | 16933 | 31 |
| Mode M9 | |||
|---|---|---|---|
| Quadrant | BADHDUFLAG | Total packets | Discarded packets |
| A | 0 | 15 | 0 |
| B | 0 | 15 | 0 |
| C | 0 | 15 | 0 |
| D | 0 | 16 | 0 |
| Quadrant | Total seconds | Saturated seconds | Saturation percentage |
|---|---|---|---|
| A | 6465 | 208 | 3.217324% |
| B | 6467 | 60 | 0.927787% |
| C | 6463 | 304 | 4.703698% |
| D | 6462 | 144 | 2.228412% |
Noise dominated data is calculated using 1-second bins in cleaned event files. If a bin has >2000 counts, and if more than 50% of those come from <1% of pixels, then it is considered to be noise-dominated and hence unusable.
| Quadrant | # 1 sec bins | Bins with >0 counts | Bins with >2000 counts | High rate bins dominated by noise | Noise dominated (total time) | Noise dominated (detector-on time) | Marked lightcurve |
|---|---|---|---|---|---|---|---|
| A | 7545 | 6471 | 211 | 211 | 2.80% | 3.26% | 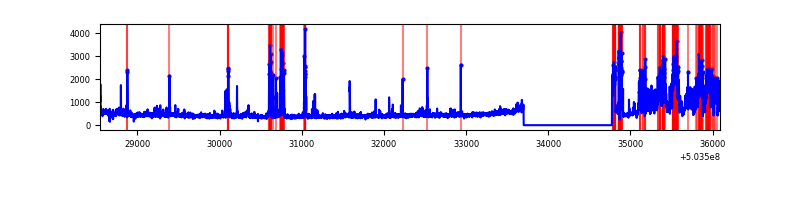 |
| B | 7545 | 6471 | 15 | 15 | 0.20% | 0.23% | 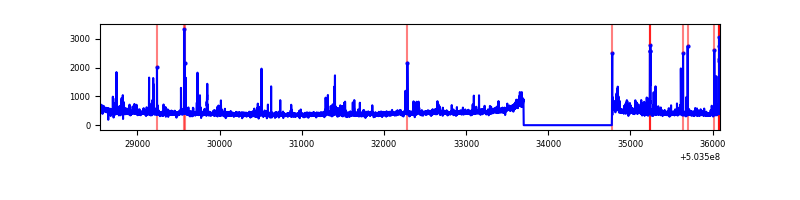 |
| C | 7545 | 6471 | 247 | 247 | 3.27% | 3.82% | 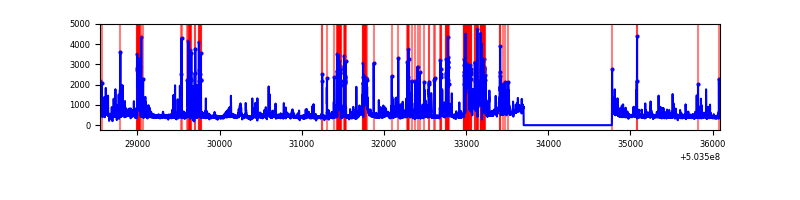 |
| D | 7545 | 6471 | 127 | 127 | 1.68% | 1.96% | 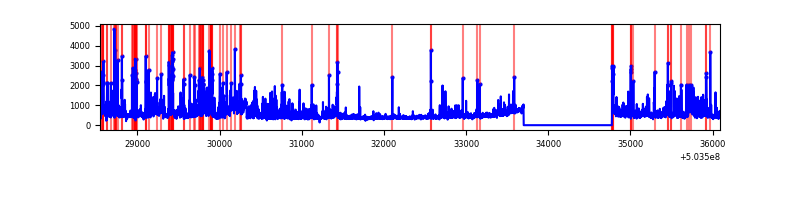 |
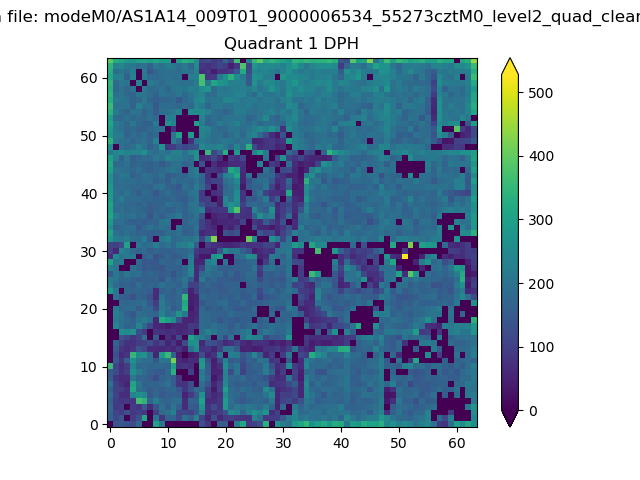
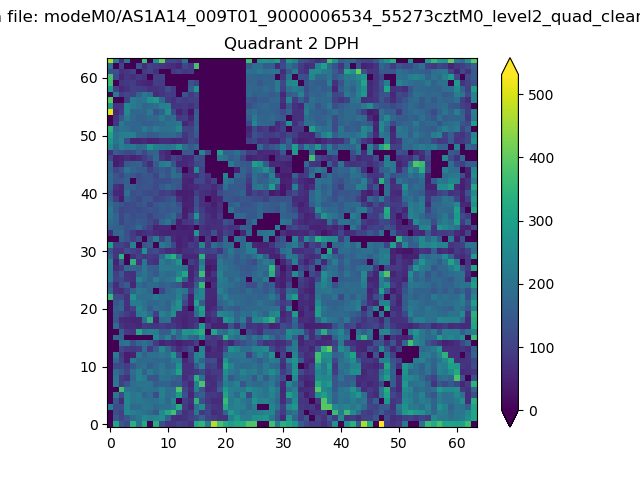
Top three noisy pixels from each quadrant. If the there are fewer than three noisy pixels in the level2.evt file, extra rows are filled as -1
| Pixel properties | Quadrant properties | ||||||
|---|---|---|---|---|---|---|---|
| Quadrant | DetID | PixID | Counts | Sigma | Mean | Median | Sigma |
| A | 12 | 115 | 893328 | 5417.33 | 669 | 655 | 164.8 |
| A | 0 | 8 | 208416 | 1260.83 | 669 | 655 | 164.8 |
| A | 7 | 7 | 183624 | 1110.38 | 669 | 655 | 164.8 |
| B | 0 | 199 | 98302 | 669.47 | 674 | 650 | 145.9 |
| B | 10 | 189 | 48202 | 326.0 | 674 | 650 | 145.9 |
| B | 10 | 247 | 38220 | 257.57 | 674 | 650 | 145.9 |
| C | 10 | 22 | 693666 | 3845.08 | 656 | 650 | 180.2 |
| C | 13 | 3 | 357421 | 1979.48 | 656 | 650 | 180.2 |
| C | 15 | 147 | 213145 | 1178.99 | 656 | 650 | 180.2 |
| D | 11 | 129 | 1018660 | 5507.1 | 654 | 626 | 184.9 |
| D | 7 | 70 | 167303 | 901.65 | 654 | 626 | 184.9 |
| D | 6 | 239 | 86147 | 462.63 | 654 | 626 | 184.9 |
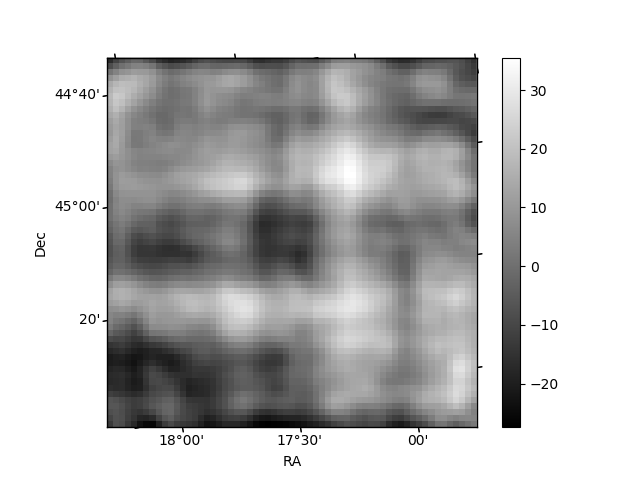
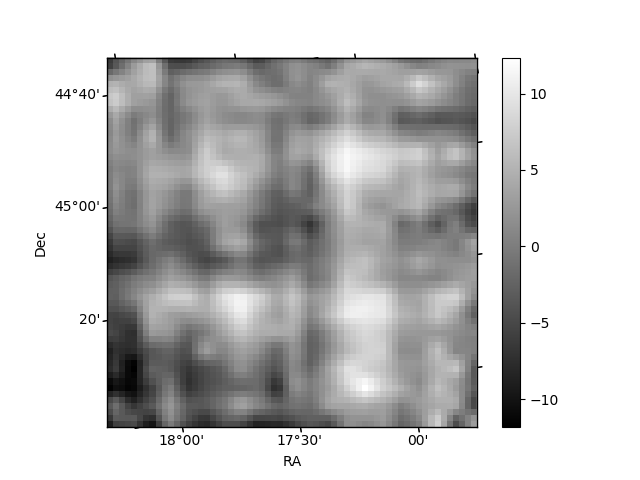
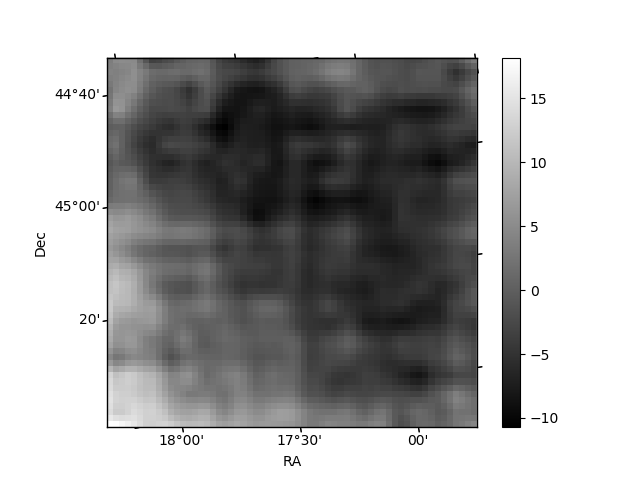
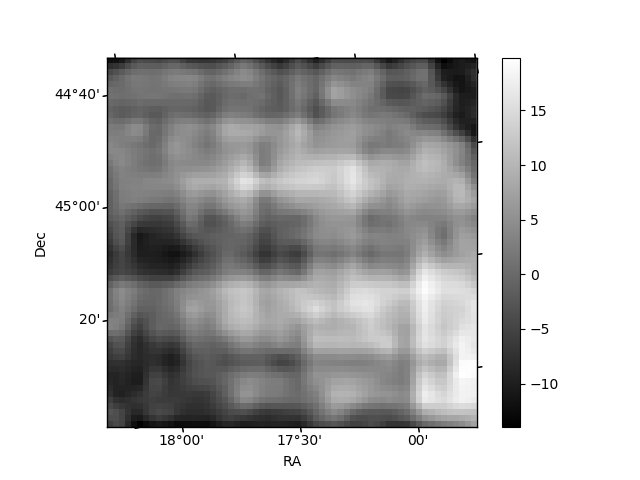
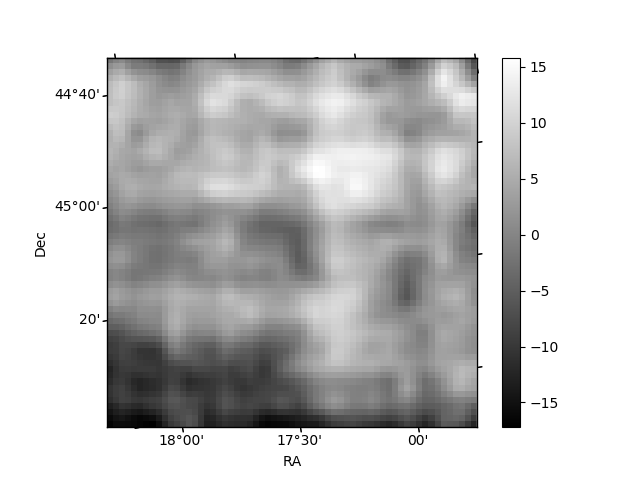
Histogram calculated using DETX and DETY for each event in the final _common_clean file
| Quadrant A | 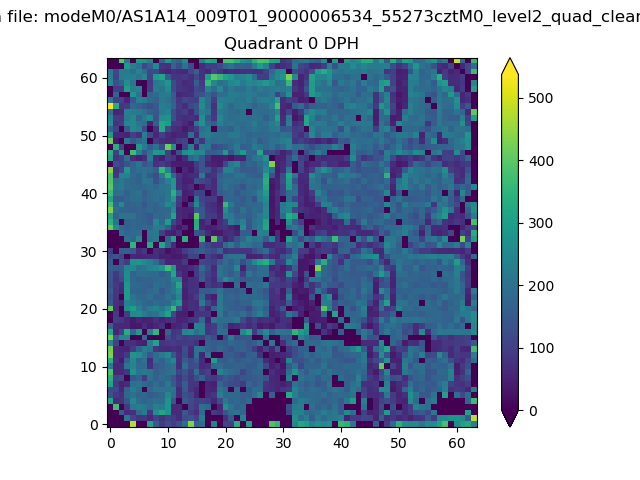 |
 |
Quadrant B |
|---|---|---|---|
| Quadrant D | 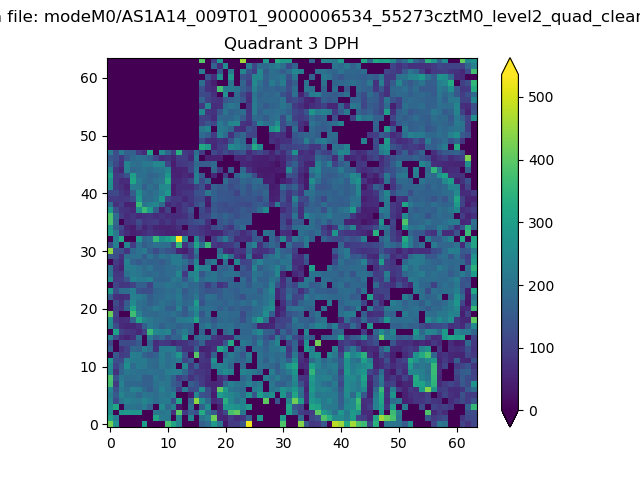 |
 |
Quadrant C |
| Plot type | Count rate plots | Images |
|---|---|---|
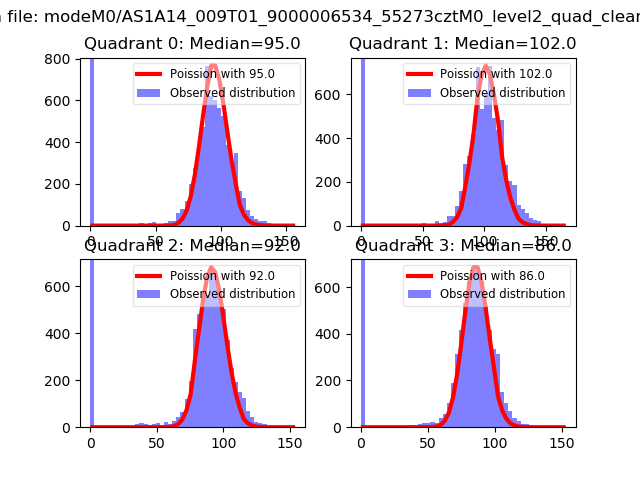
| Comparison with Poisson distribution Blue bars denote a histogram of data divided into 1 sec bins. Red curve is a Poisson curve with rate = median count rate of data. |
 |
 |
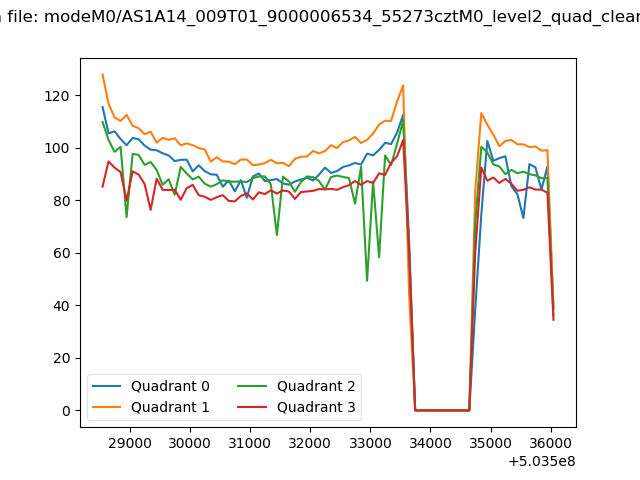
| Quadrant-wise count rates Data is divided into 100 sec bins |
 |
|
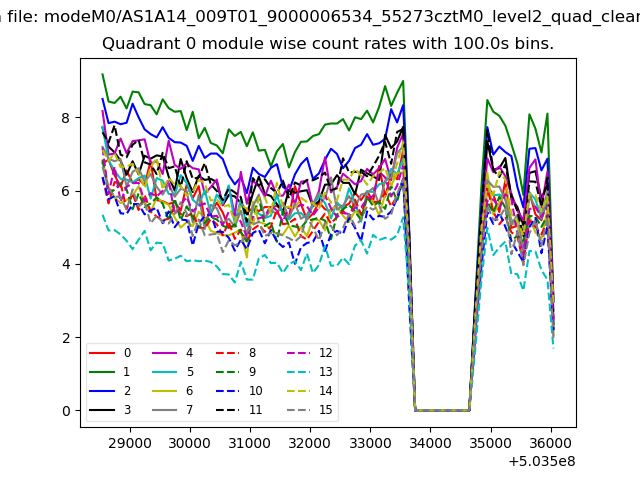
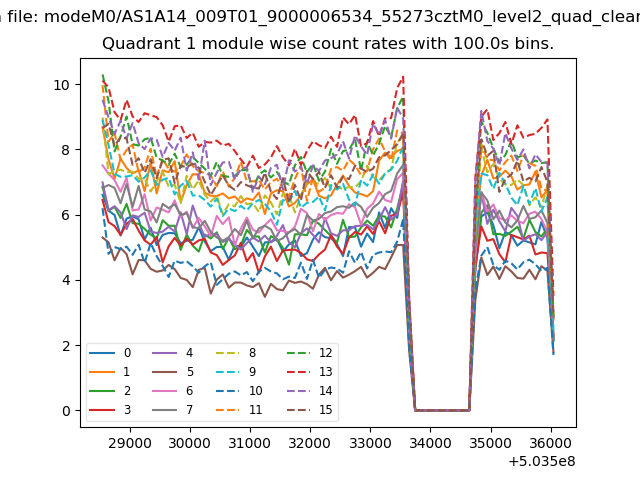
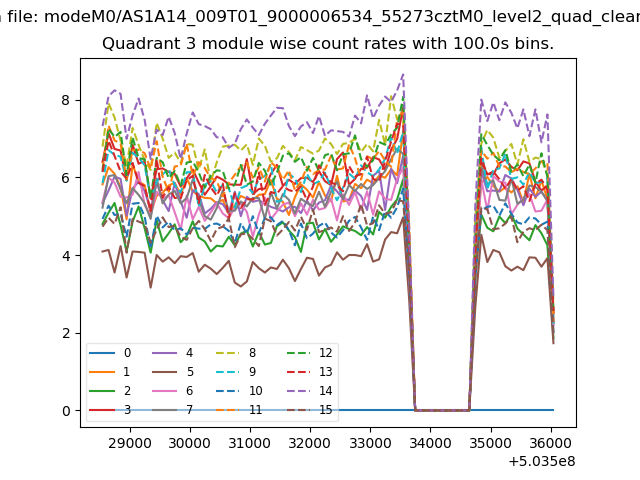
| Module-wise count rates for Quadrant A Data is divided into 100 sec bins |
 |
 |
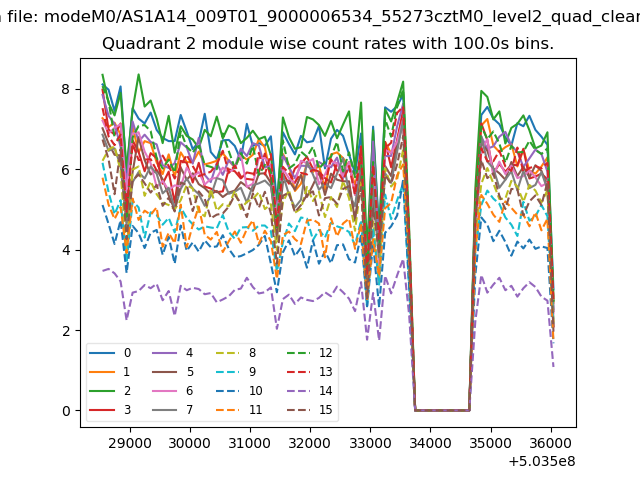
| Module-wise count rates for Quadrant B Data is divided into 100 sec bins |
 |
 |
| Module-wise count rates for Quadrant C Data is divided into 100 sec bins |
 |
 |
| Module-wise count rates for Quadrant D Data is divided into 100 sec bins |
 |
 |
| Parameter | Plot |
|---|---|
| CZT HV Monitor | 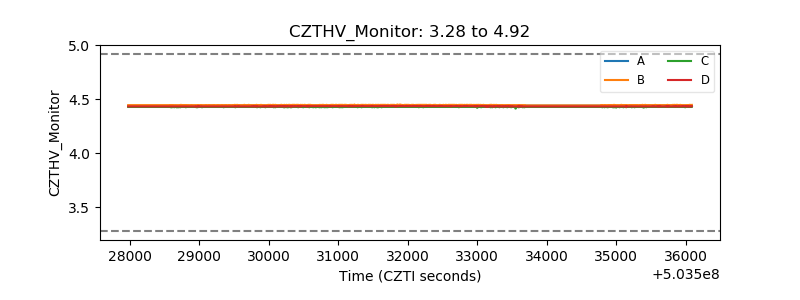 |
| D_VDD | 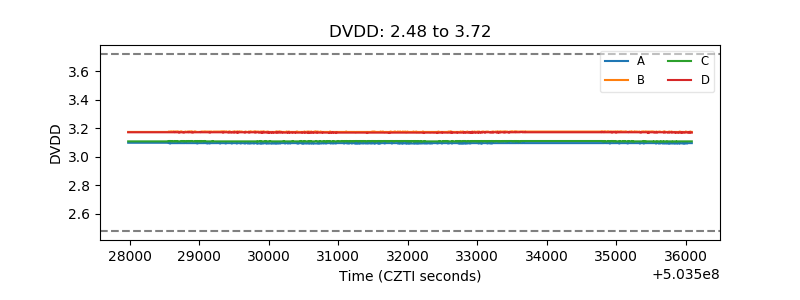 |
| Temperature 1 | 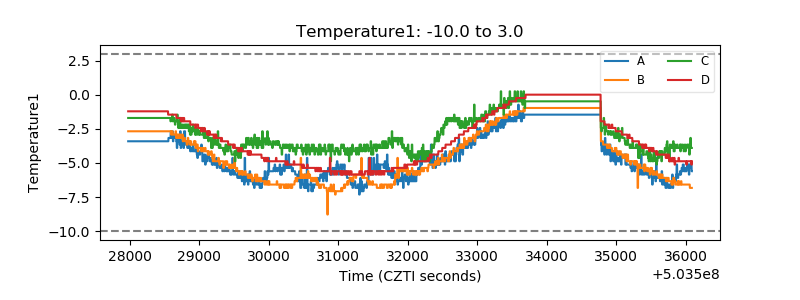 |
| Veto HV Monitor | 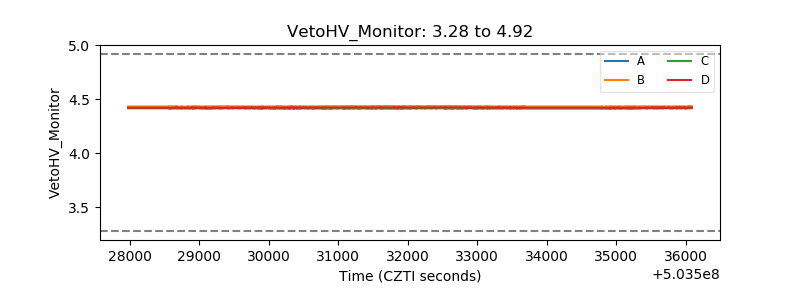 |
| Veto LLD | 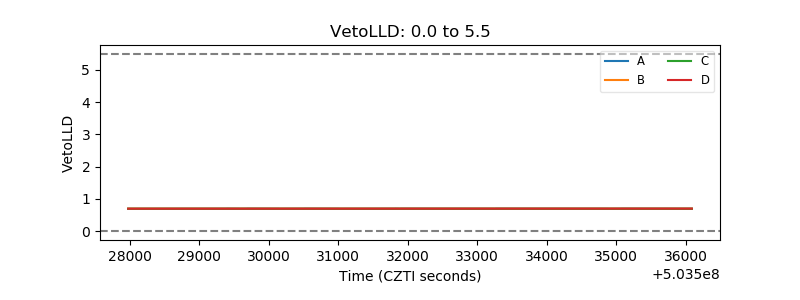 |
| Alpha Counter | 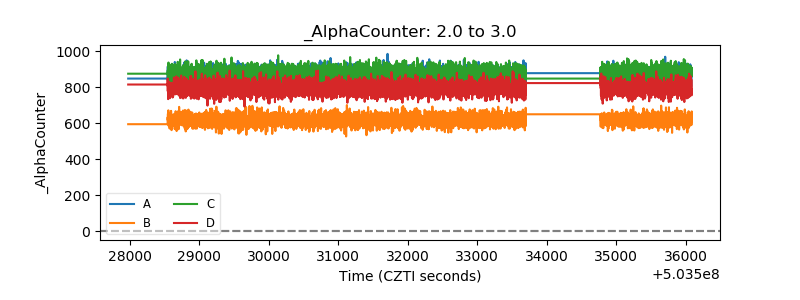 |
| _CPM_Rate | 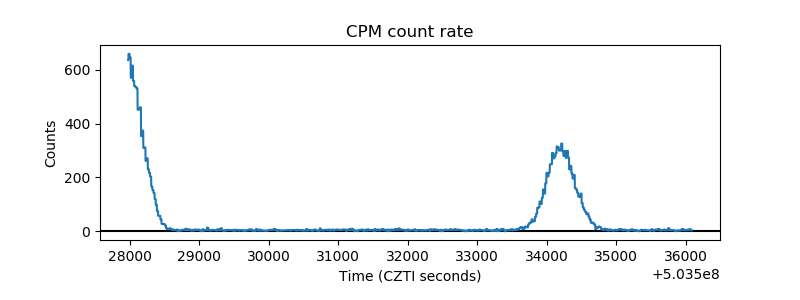 |
| CZT Counter | 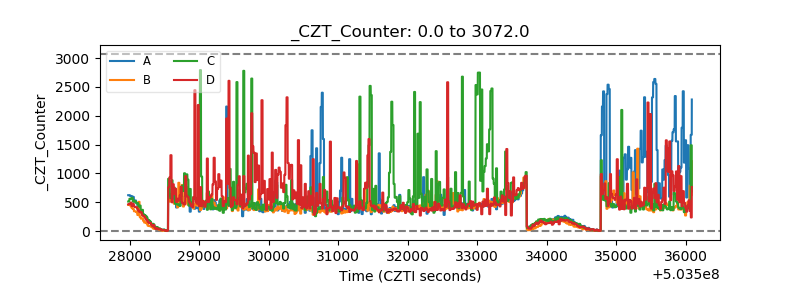 |
| +2.5 Volts monitor |  |
| +5 Volts monitor |  |
| _ROLL_ROT | 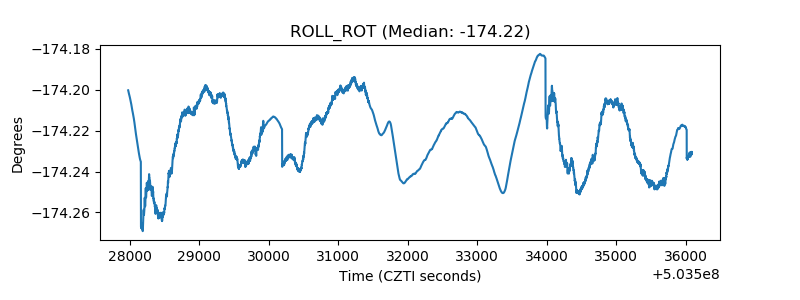 |
| _Roll_DEC | 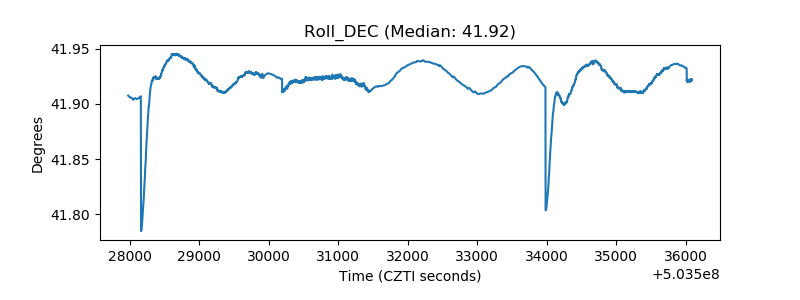 |
| _Roll_RA | 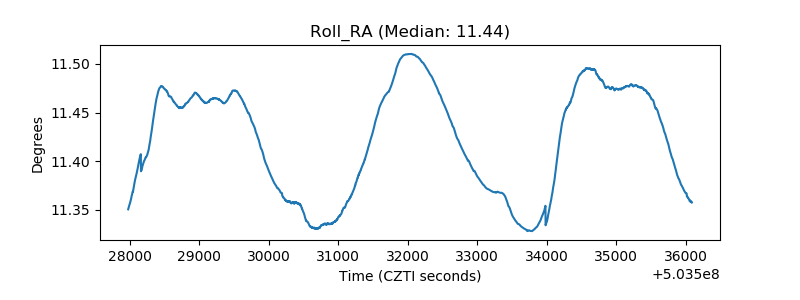 |
| Veto Counter | 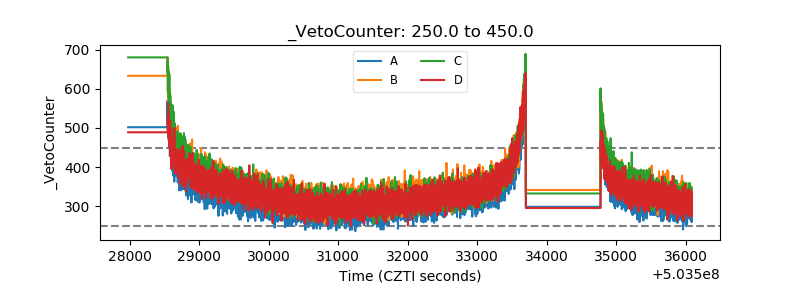 |