| Param | Original file | Final file |
|---|---|---|
| Filename | modeM0/AS1A14_009T01_9000006534_55274cztM0_level2.fits | modeM0/AS1A14_009T01_9000006534_55274cztM0_level2_quad_clean.evt |
| Size (bytes) | 596,744,640 | 95,895,360 |
| Size | 569.1 MB | 91.5 MB |
| Events in quadrant A | 9,084,885 | 523,808 |
| Events in quadrant B | 4,460,470 | 665,939 |
| Events in quadrant C | 3,657,938 | 633,821 |
| Events in quadrant D | 4,341,707 | 590,567 |
| Mode SS | |||
|---|---|---|---|
| Quadrant | BADHDUFLAG | Total packets | Discarded packets |
| A | 0 | 146 | 0 |
| B | 0 | 146 | 0 |
| C | 0 | 146 | 0 |
| D | 0 | 146 | 0 |
| Mode M0 | |||
|---|---|---|---|
| Quadrant | BADHDUFLAG | Total packets | Discarded packets |
| A | 0 | 31844 | 2 |
| B | 0 | 18450 | 2 |
| C | 0 | 16112 | 2 |
| D | 0 | 18052 | 2 |
| Mode M9 | |||
|---|---|---|---|
| Quadrant | BADHDUFLAG | Total packets | Discarded packets |
| A | 0 | 19 | 0 |
| B | 0 | 19 | 0 |
| C | 0 | 19 | 0 |
| D | 0 | 19 | 0 |
| Quadrant | Total seconds | Saturated seconds | Saturation percentage |
|---|---|---|---|
| A | 7022 | 1654 | 23.554543% |
| B | 7023 | 469 | 6.678058% |
| C | 7023 | 89 | 1.267265% |
| D | 7023 | 183 | 2.605724% |
Noise dominated data is calculated using 1-second bins in cleaned event files. If a bin has >2000 counts, and if more than 50% of those come from <1% of pixels, then it is considered to be noise-dominated and hence unusable.
| Quadrant | # 1 sec bins | Bins with >0 counts | Bins with >2000 counts | High rate bins dominated by noise | Noise dominated (total time) | Noise dominated (detector-on time) | Marked lightcurve |
|---|---|---|---|---|---|---|---|
| A | 8952 | 7024 | 1629 | 1629 | 18.20% | 23.19% | 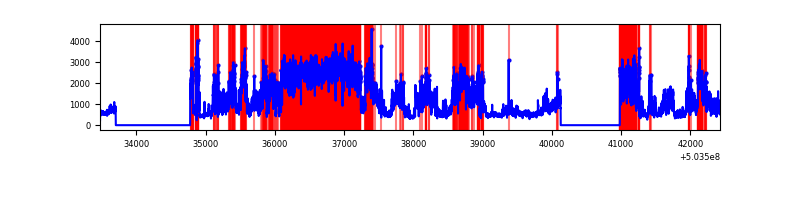 |
| B | 8953 | 7025 | 306 | 306 | 3.42% | 4.36% | 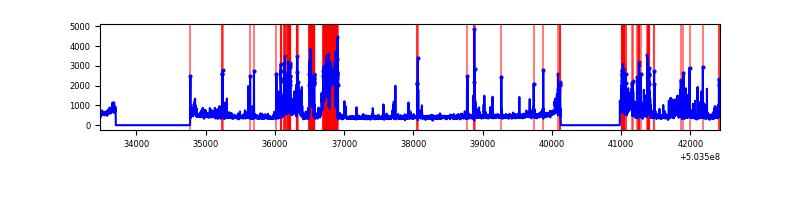 |
| C | 8953 | 7025 | 44 | 44 | 0.49% | 0.63% | 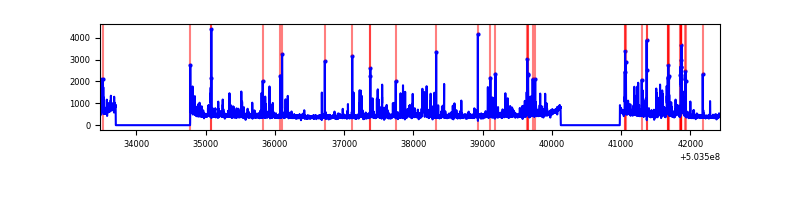 |
| D | 8953 | 7025 | 133 | 133 | 1.49% | 1.89% | 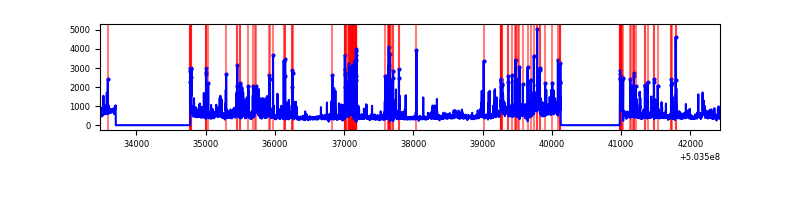 |
Top three noisy pixels from each quadrant. If the there are fewer than three noisy pixels in the level2.evt file, extra rows are filled as -1
| Pixel properties | Quadrant properties | ||||||
|---|---|---|---|---|---|---|---|
| Quadrant | DetID | PixID | Counts | Sigma | Mean | Median | Sigma |
| A | 12 | 115 | 5942668 | 35224.17 | 689 | 673 | 168.7 |
| A | 7 | 7 | 145218 | 856.86 | 689 | 673 | 168.7 |
| A | 3 | 14 | 106592 | 627.89 | 689 | 673 | 168.7 |
| B | 5 | 185 | 1218870 | 7892.4 | 715 | 687 | 154.3 |
| B | 4 | 81 | 86431 | 555.52 | 715 | 687 | 154.3 |
| B | 0 | 199 | 74428 | 477.76 | 715 | 687 | 154.3 |
| C | 13 | 3 | 274614 | 1367.79 | 730 | 721 | 200.2 |
| C | 15 | 147 | 180095 | 895.77 | 730 | 721 | 200.2 |
| C | 14 | 254 | 100955 | 500.56 | 730 | 721 | 200.2 |
| D | 11 | 129 | 963536 | 4783.02 | 715 | 685 | 201.3 |
| D | 7 | 129 | 100037 | 493.54 | 715 | 685 | 201.3 |
| D | 11 | 176 | 95462 | 470.81 | 715 | 685 | 201.3 |
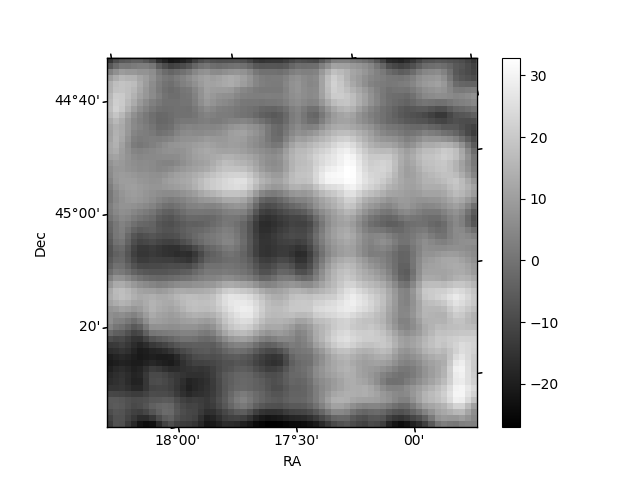
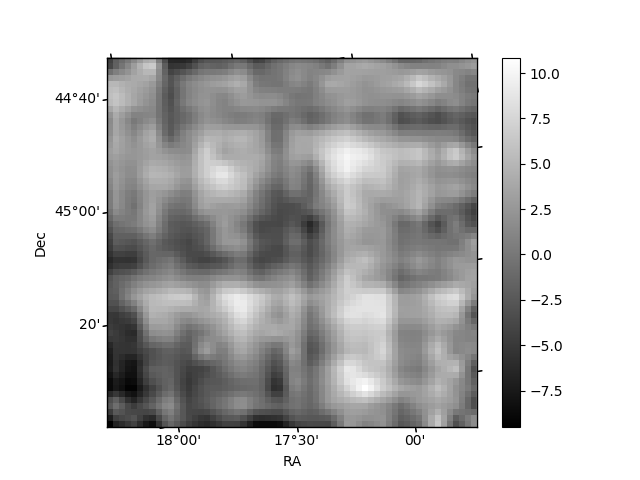
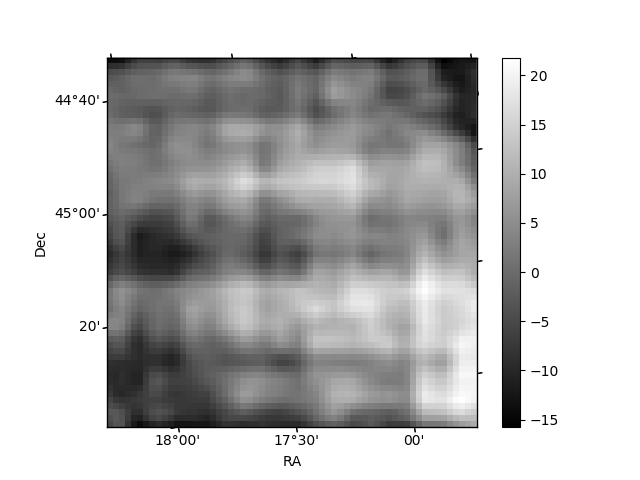
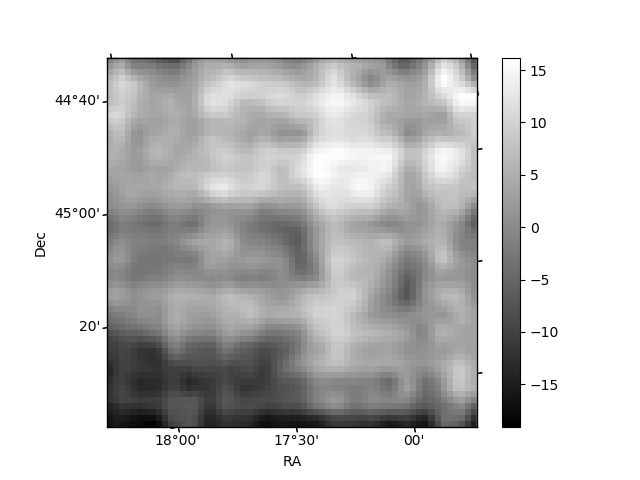
Histogram calculated using DETX and DETY for each event in the final _common_clean file
| Quadrant A | 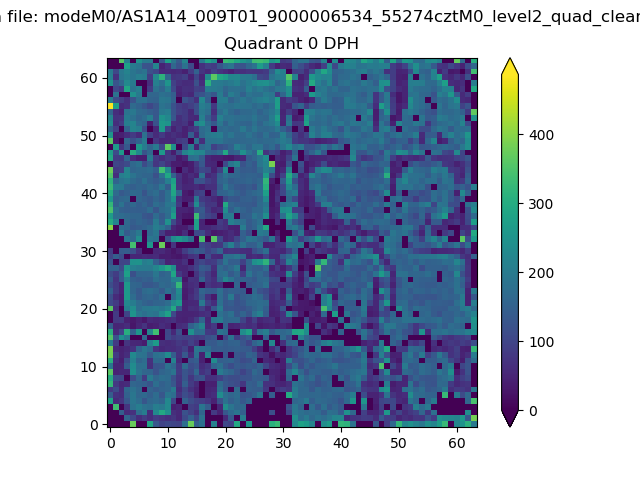 |
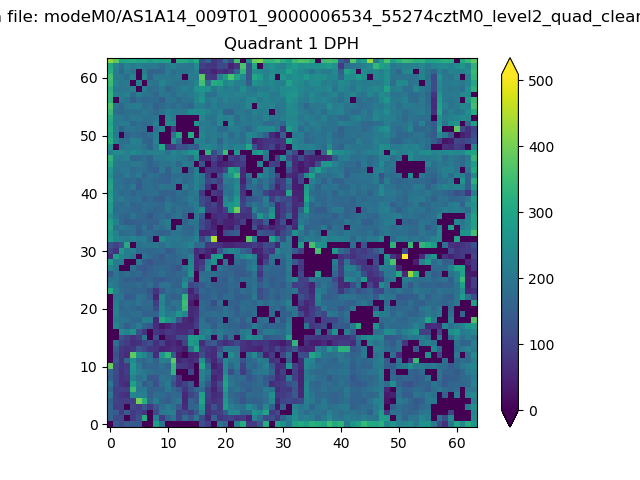 |
Quadrant B |
|---|---|---|---|
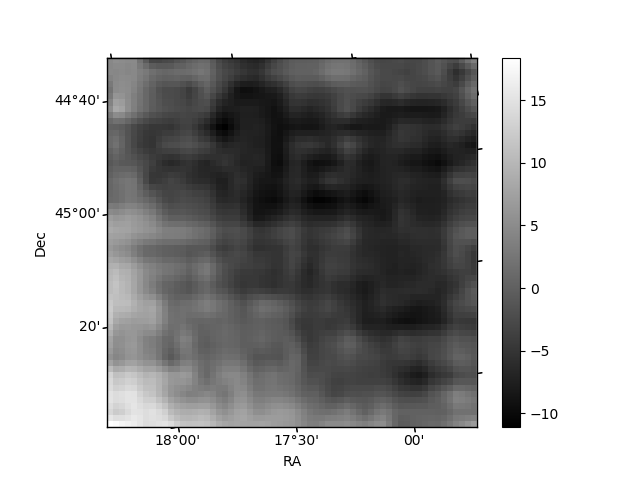
| Quadrant D | 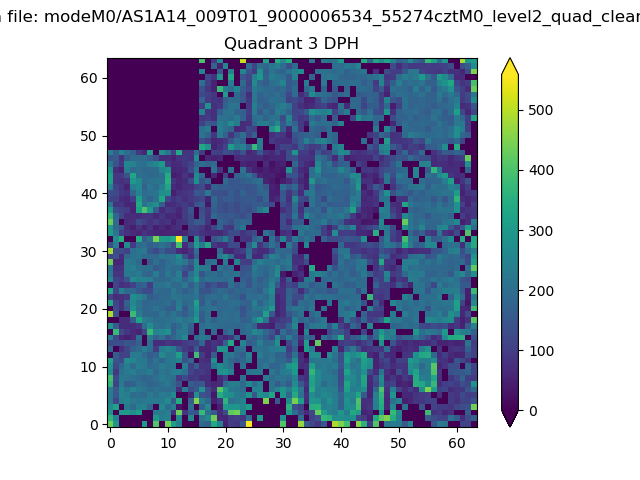 |
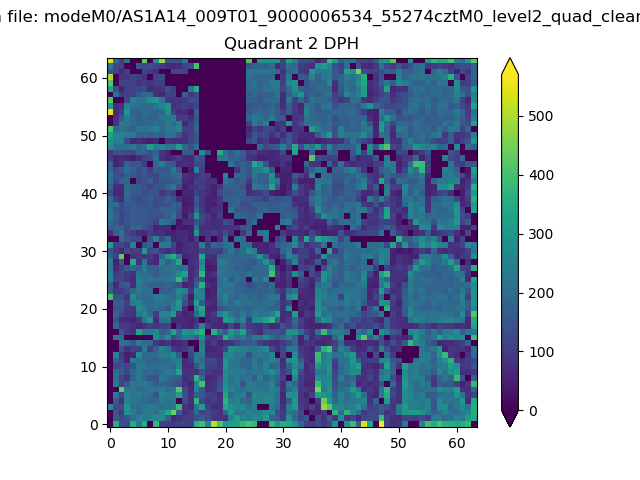 |
Quadrant C |
| Plot type | Count rate plots | Images |
|---|---|---|
| Comparison with Poisson distribution Blue bars denote a histogram of data divided into 1 sec bins. Red curve is a Poisson curve with rate = median count rate of data. |
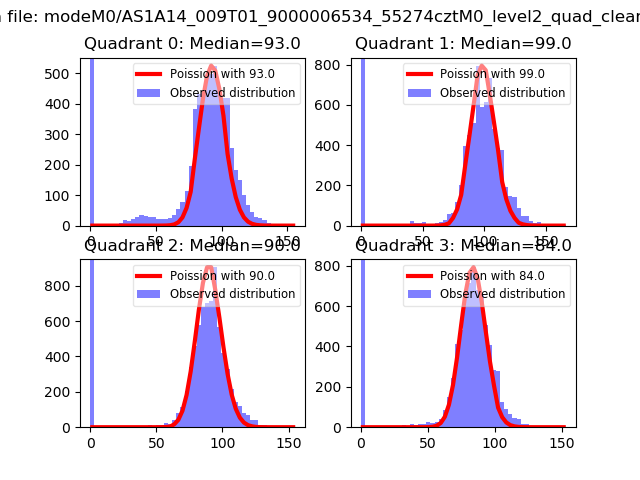 |
 |
| Quadrant-wise count rates Data is divided into 100 sec bins |
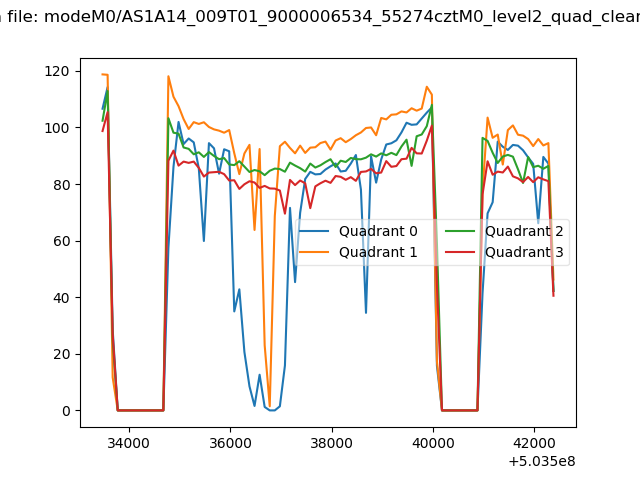 |
|
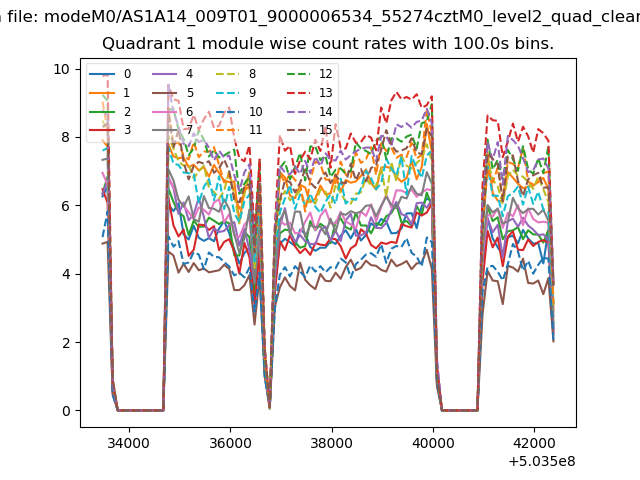
| Module-wise count rates for Quadrant A Data is divided into 100 sec bins |
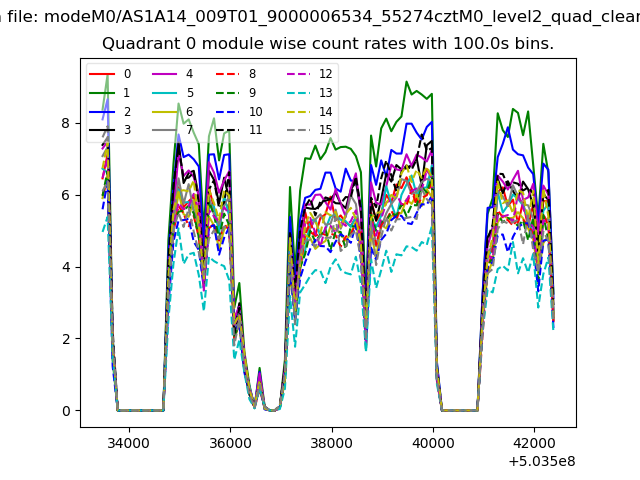 |
 |
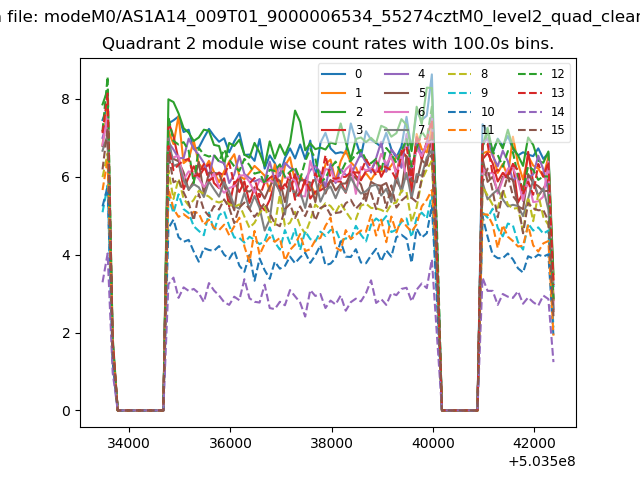
| Module-wise count rates for Quadrant B Data is divided into 100 sec bins |
 |
 |
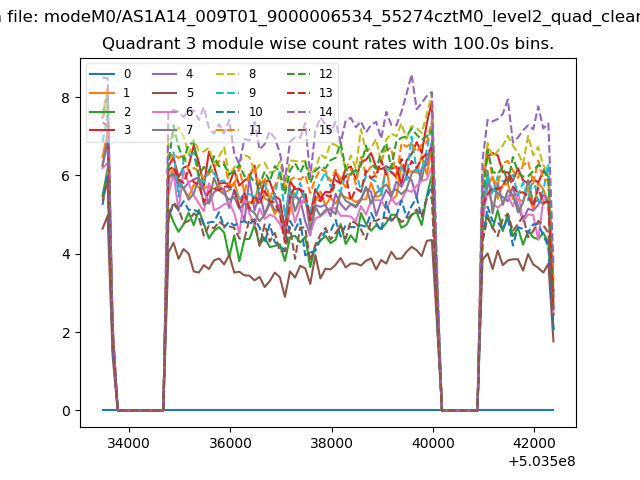
| Module-wise count rates for Quadrant C Data is divided into 100 sec bins |
 |
 |
| Module-wise count rates for Quadrant D Data is divided into 100 sec bins |
 |
 |
| Parameter | Plot |
|---|---|
| CZT HV Monitor | 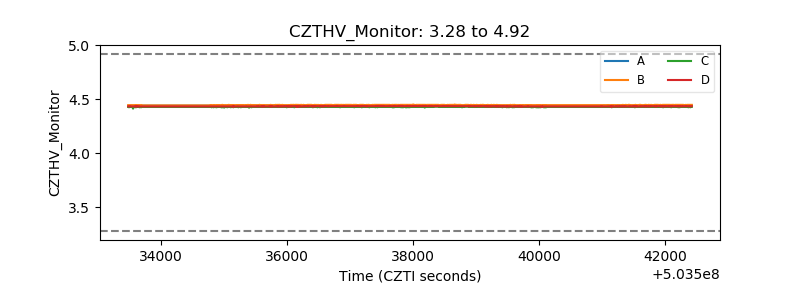 |
| D_VDD | 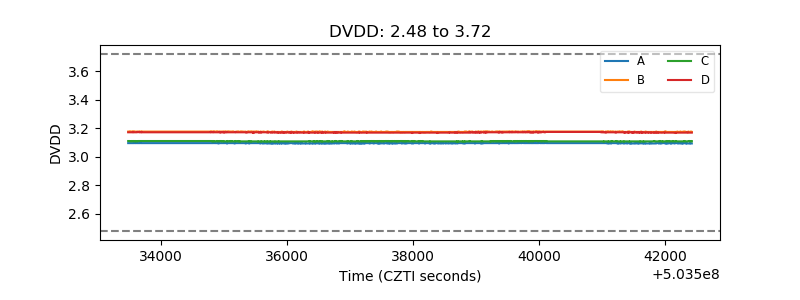 |
| Temperature 1 | 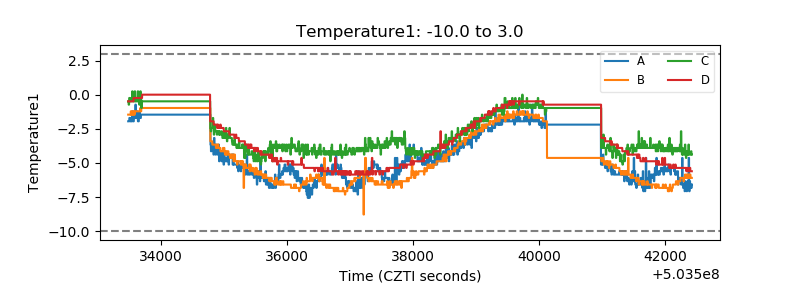 |
| Veto HV Monitor | 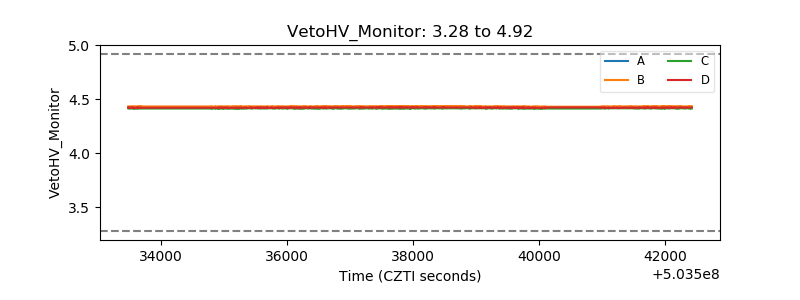 |
| Veto LLD | 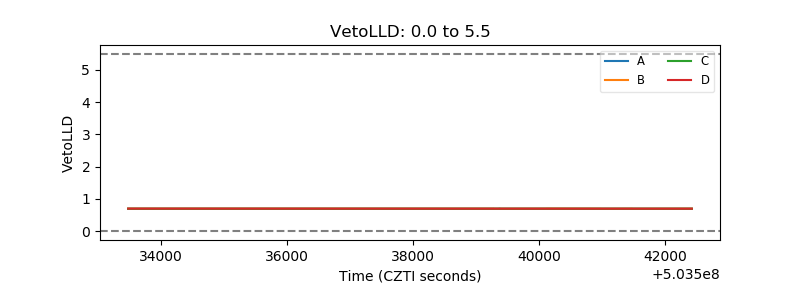 |
| Alpha Counter | 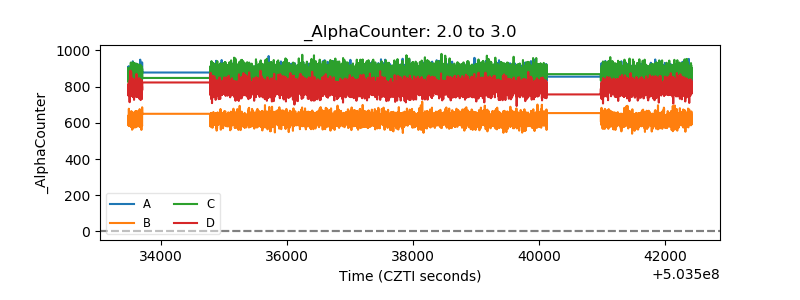 |
| _CPM_Rate | 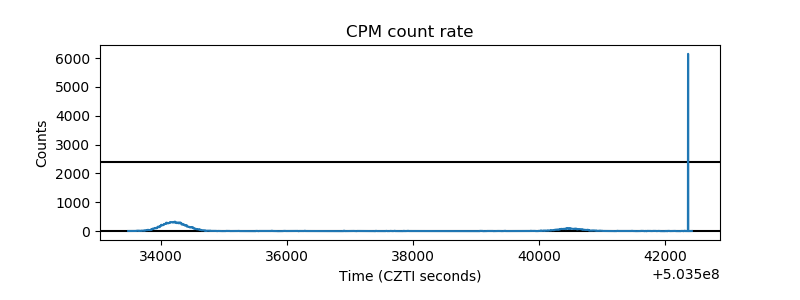 |
| CZT Counter | 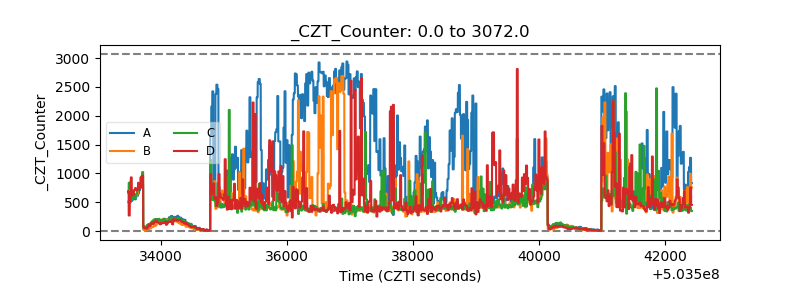 |
| +2.5 Volts monitor |  |
| +5 Volts monitor |  |
| _ROLL_ROT | 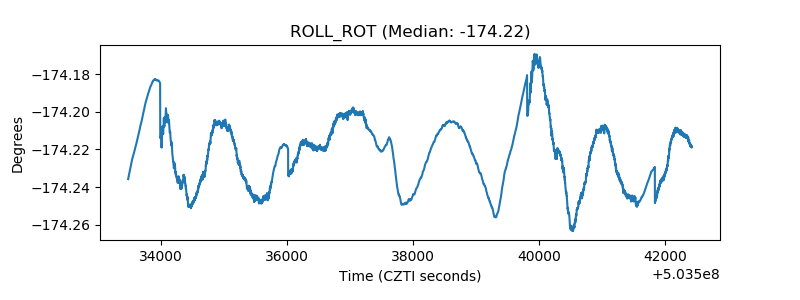 |
| _Roll_DEC | 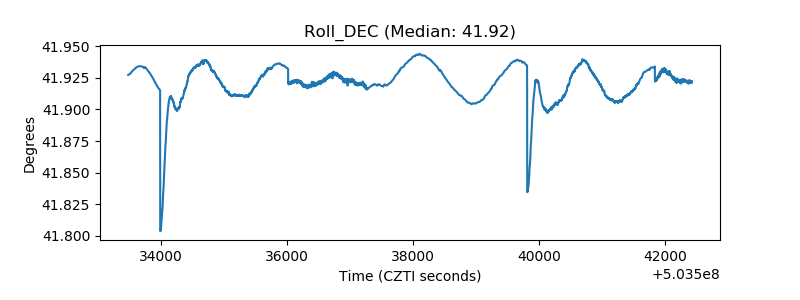 |
| _Roll_RA | 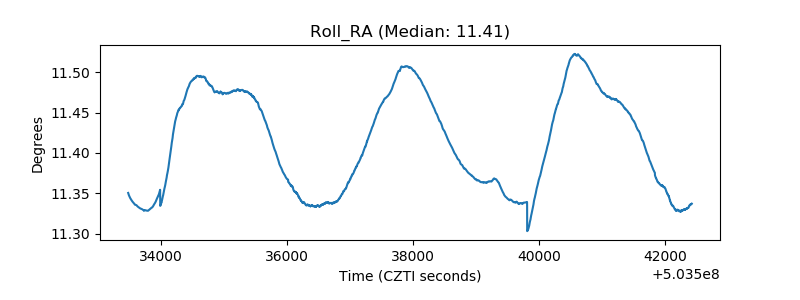 |
| Veto Counter | 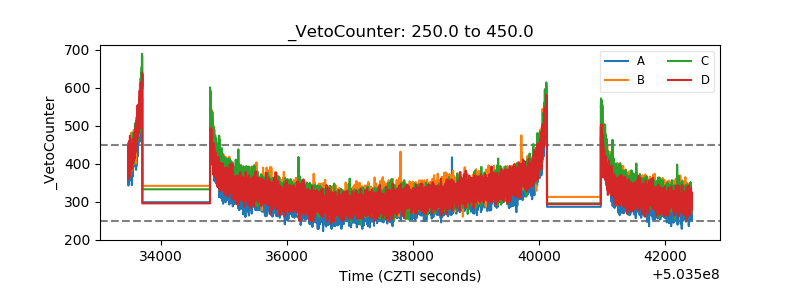 |