| Param | Original file | Final file |
|---|---|---|
| Filename | modeM0/AS1A14_009T01_9000006534_55275cztM0_level2.fits | modeM0/AS1A14_009T01_9000006534_55275cztM0_level2_quad_clean.evt |
| Size (bytes) | 561,098,880 | 115,534,080 |
| Size | 535.1 MB | 110.2 MB |
| Events in quadrant A | 5,983,758 | 733,193 |
| Events in quadrant B | 4,734,350 | 792,096 |
| Events in quadrant C | 4,612,014 | 723,519 |
| Events in quadrant D | 4,806,926 | 682,673 |
| Mode SS | |||
|---|---|---|---|
| Quadrant | BADHDUFLAG | Total packets | Discarded packets |
| A | 0 | 166 | 0 |
| B | 0 | 166 | 0 |
| C | 0 | 166 | 0 |
| D | 0 | 166 | 0 |
| Mode M0 | |||
|---|---|---|---|
| Quadrant | BADHDUFLAG | Total packets | Discarded packets |
| A | 0 | 23528 | 2 |
| B | 0 | 20052 | 2 |
| C | 0 | 19717 | 2 |
| D | 0 | 20133 | 2 |
| Mode M9 | |||
|---|---|---|---|
| Quadrant | BADHDUFLAG | Total packets | Discarded packets |
| A | 0 | 12 | 0 |
| B | 0 | 12 | 0 |
| C | 0 | 12 | 0 |
| D | 0 | 12 | 0 |
| Quadrant | Total seconds | Saturated seconds | Saturation percentage |
|---|---|---|---|
| A | 8157 | 413 | 5.063136% |
| B | 8157 | 351 | 4.303053% |
| C | 8157 | 188 | 2.304769% |
| D | 8157 | 200 | 2.451882% |
Noise dominated data is calculated using 1-second bins in cleaned event files. If a bin has >2000 counts, and if more than 50% of those come from <1% of pixels, then it is considered to be noise-dominated and hence unusable.
| Quadrant | # 1 sec bins | Bins with >0 counts | Bins with >2000 counts | High rate bins dominated by noise | Noise dominated (total time) | Noise dominated (detector-on time) | Marked lightcurve |
|---|---|---|---|---|---|---|---|
| A | 9372 | 8159 | 251 | 251 | 2.68% | 3.08% | 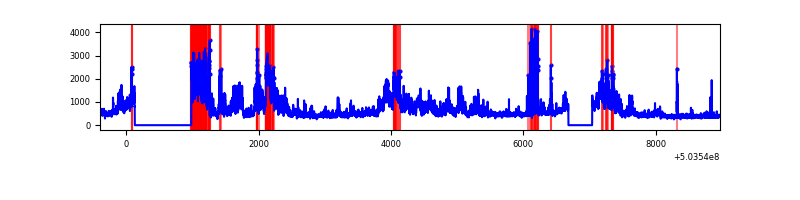 |
| B | 9372 | 8159 | 118 | 118 | 1.26% | 1.45% | 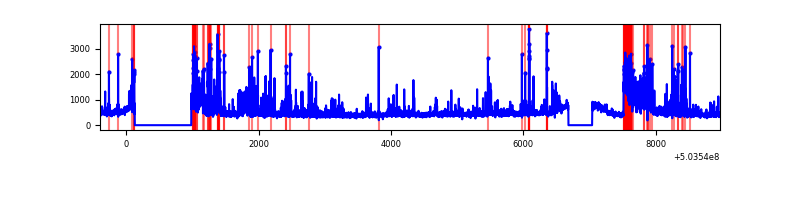 |
| C | 9372 | 8159 | 100 | 100 | 1.07% | 1.23% | 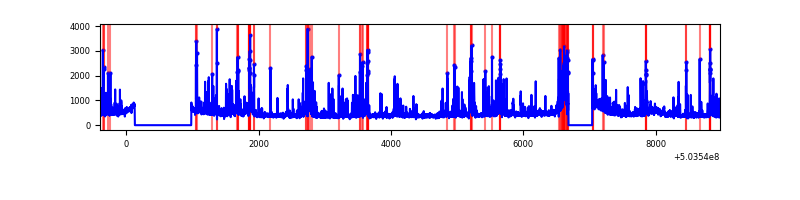 |
| D | 9372 | 8159 | 106 | 106 | 1.13% | 1.30% | 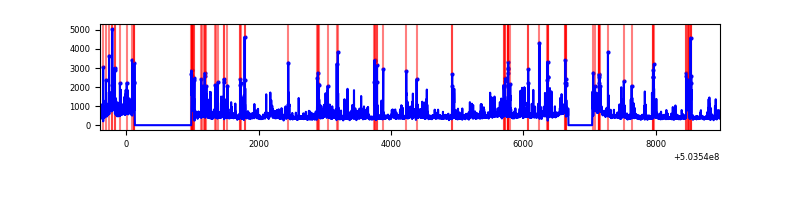 |
Top three noisy pixels from each quadrant. If the there are fewer than three noisy pixels in the level2.evt file, extra rows are filled as -1
| Pixel properties | Quadrant properties | ||||||
|---|---|---|---|---|---|---|---|
| Quadrant | DetID | PixID | Counts | Sigma | Mean | Median | Sigma |
| A | 12 | 115 | 2193899 | 10508.15 | 857 | 831 | 208.7 |
| A | 0 | 8 | 143911 | 685.57 | 857 | 831 | 208.7 |
| A | 3 | 14 | 83465 | 395.94 | 857 | 831 | 208.7 |
| B | 1 | 159 | 514582 | 2777.93 | 859 | 824 | 184.9 |
| B | 5 | 185 | 324493 | 1750.1 | 859 | 824 | 184.9 |
| B | 4 | 81 | 164463 | 884.81 | 859 | 824 | 184.9 |
| C | 15 | 147 | 484458 | 2089.64 | 851 | 843 | 231.4 |
| C | 13 | 3 | 423411 | 1825.87 | 851 | 843 | 231.4 |
| C | 3 | 208 | 75322 | 321.81 | 851 | 843 | 231.4 |
| D | 11 | 129 | 747010 | 3119.88 | 844 | 807 | 239.2 |
| D | 11 | 176 | 162927 | 677.82 | 844 | 807 | 239.2 |
| D | 7 | 96 | 142681 | 593.18 | 844 | 807 | 239.2 |
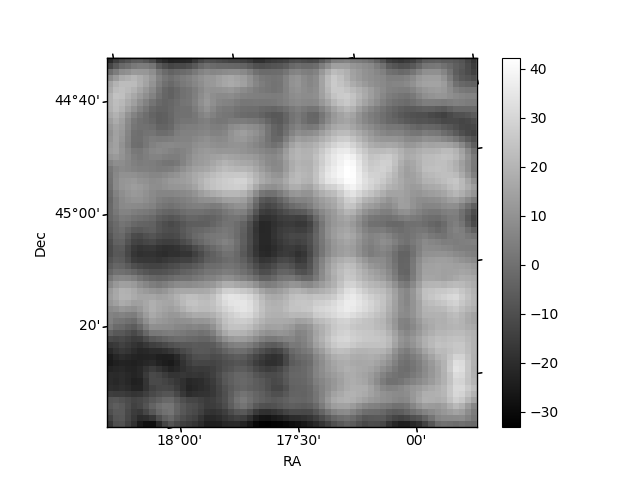
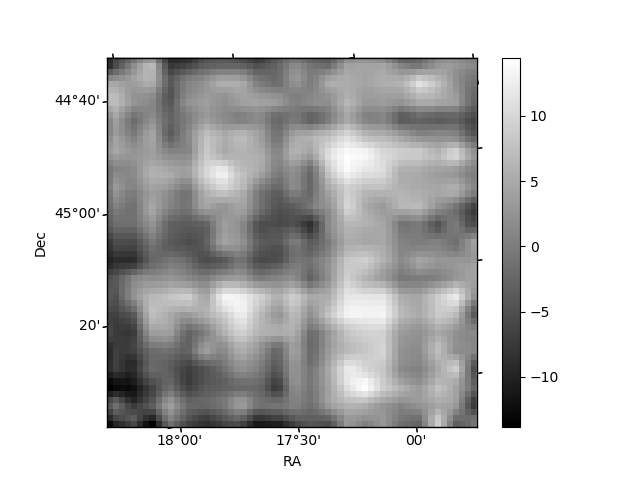
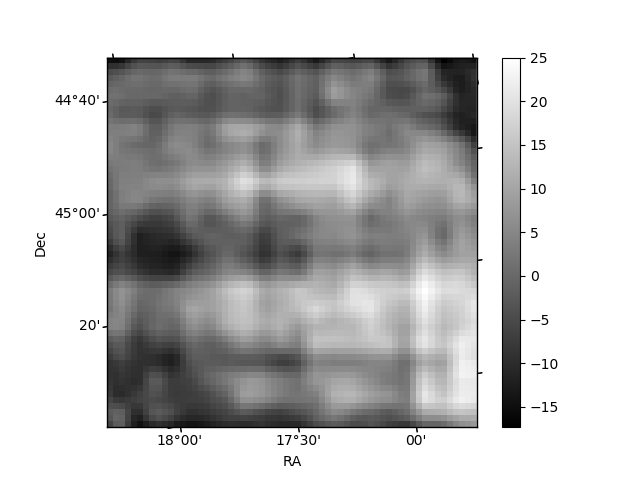
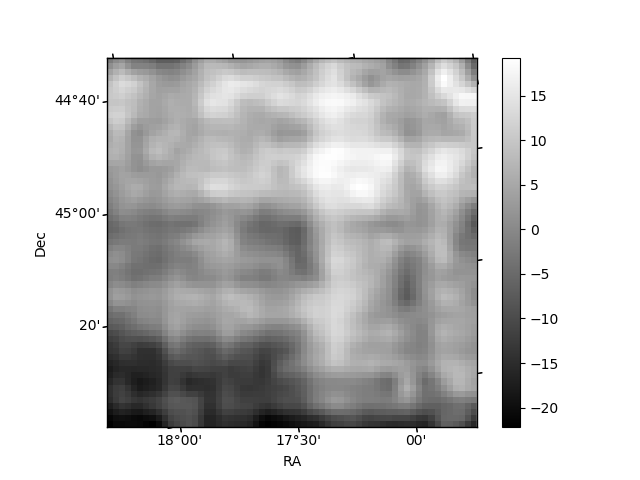
Histogram calculated using DETX and DETY for each event in the final _common_clean file
| Quadrant A | 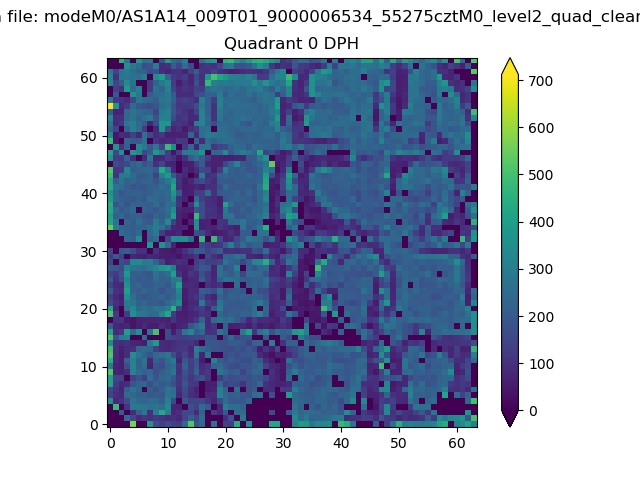 |
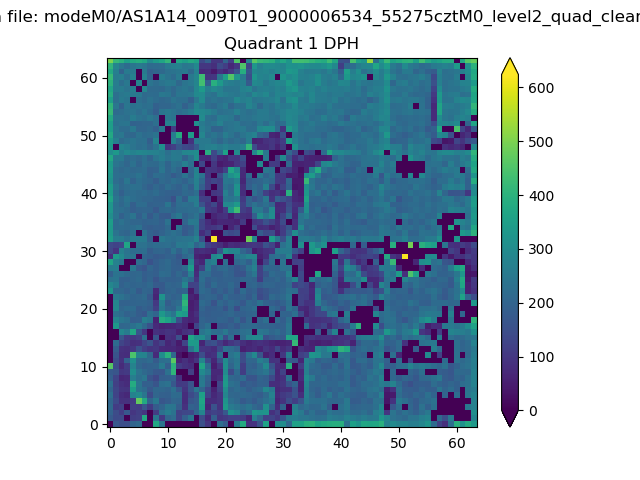 |
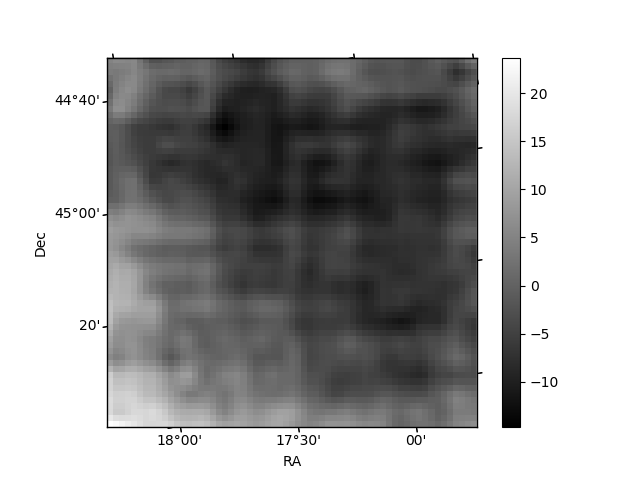
Quadrant B |
|---|---|---|---|
| Quadrant D | 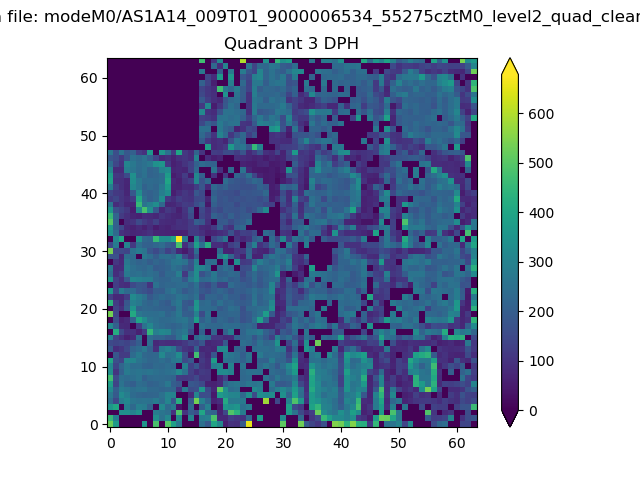 |
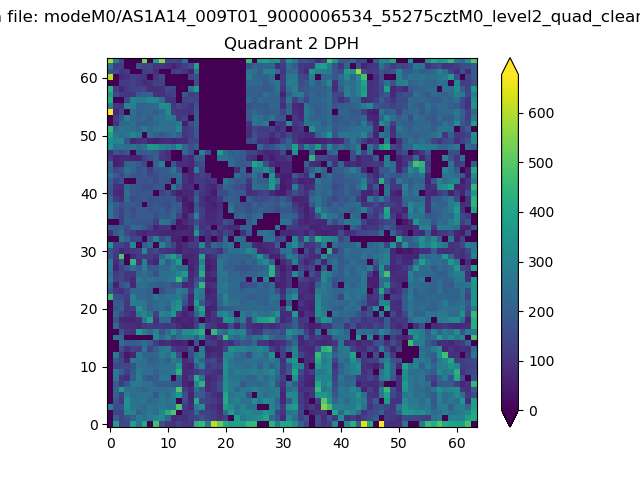 |
Quadrant C |
| Plot type | Count rate plots | Images |
|---|---|---|
| Comparison with Poisson distribution Blue bars denote a histogram of data divided into 1 sec bins. Red curve is a Poisson curve with rate = median count rate of data. |
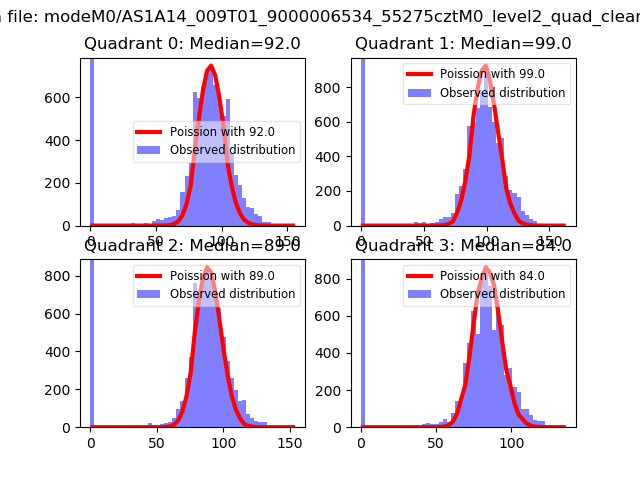 |
 |
| Quadrant-wise count rates Data is divided into 100 sec bins |
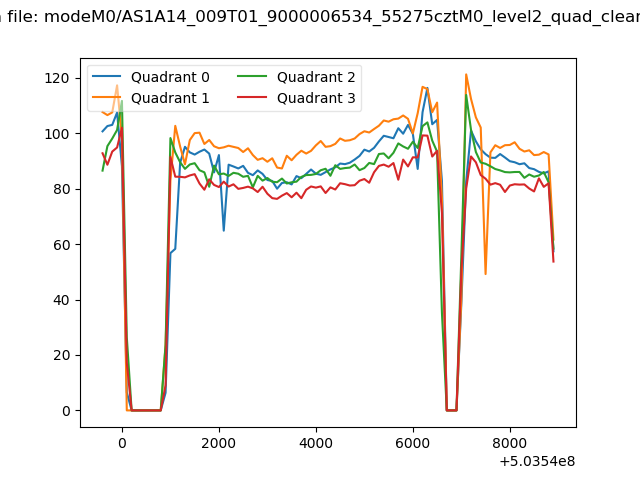 |
|
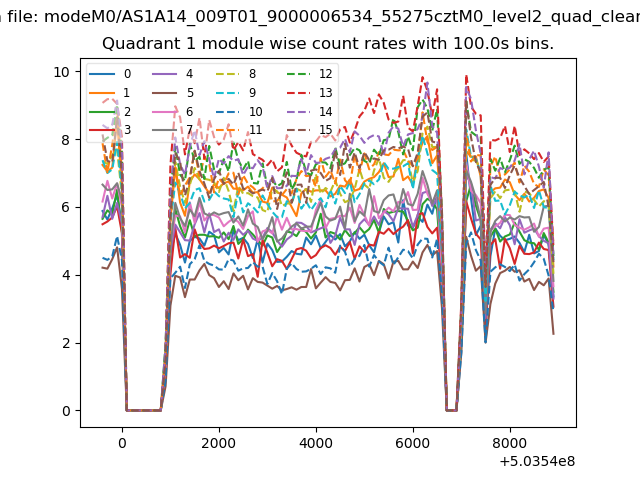
| Module-wise count rates for Quadrant A Data is divided into 100 sec bins |
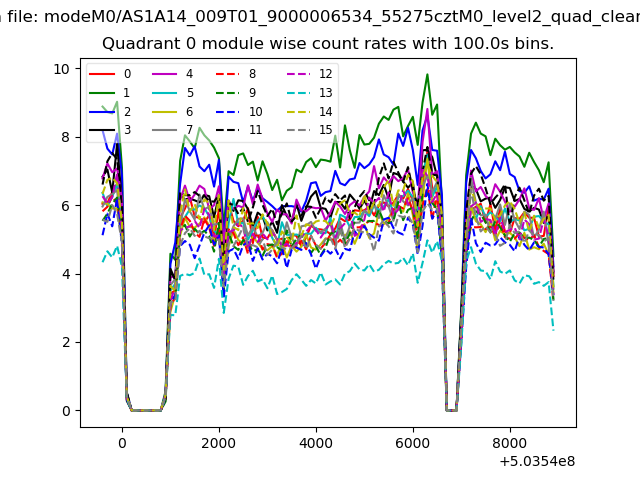 |
 |
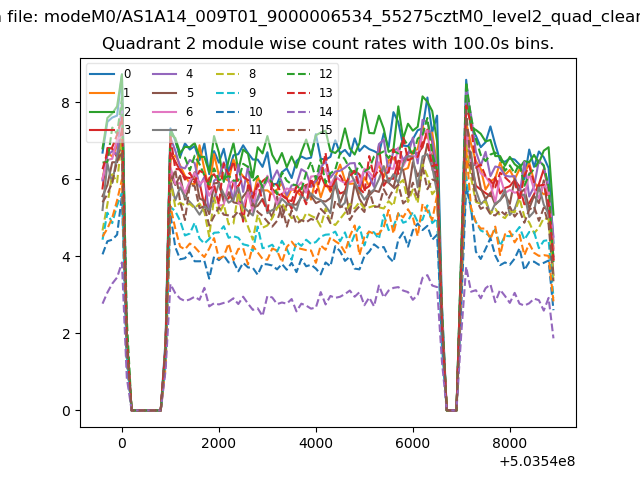
| Module-wise count rates for Quadrant B Data is divided into 100 sec bins |
 |
 |
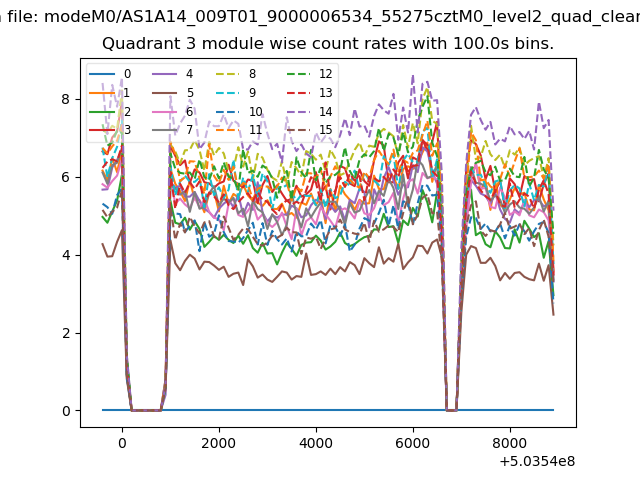
| Module-wise count rates for Quadrant C Data is divided into 100 sec bins |
 |
 |
| Module-wise count rates for Quadrant D Data is divided into 100 sec bins |
 |
 |
| Parameter | Plot |
|---|---|
| CZT HV Monitor | 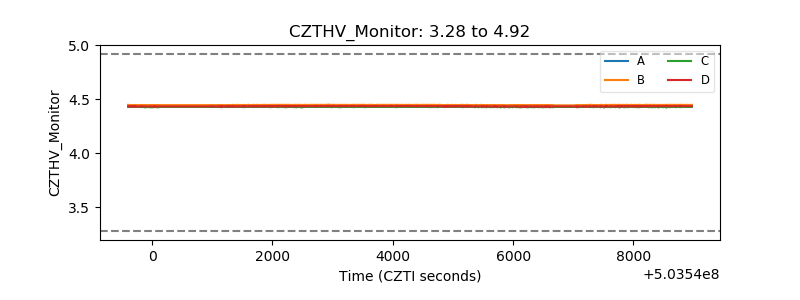 |
| D_VDD | 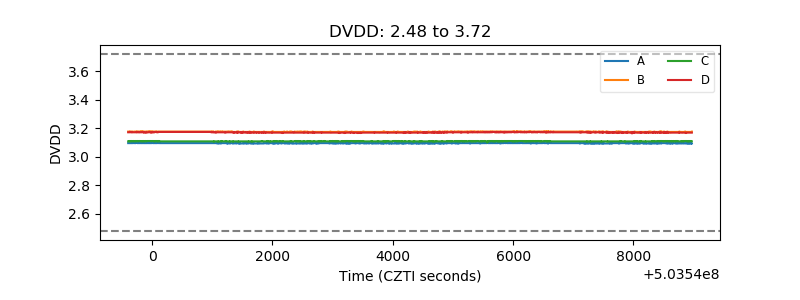 |
| Temperature 1 | 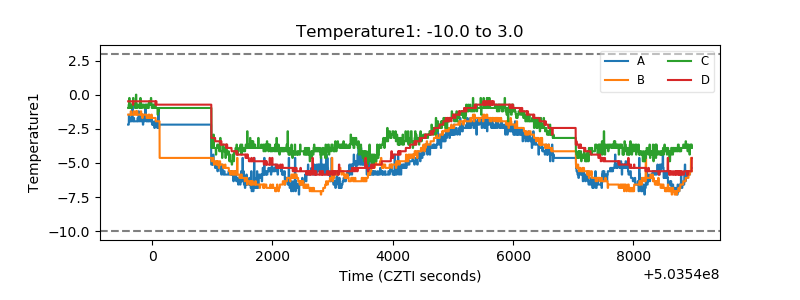 |
| Veto HV Monitor | 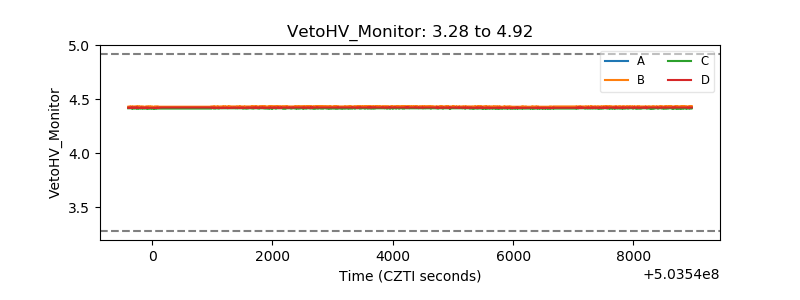 |
| Veto LLD | 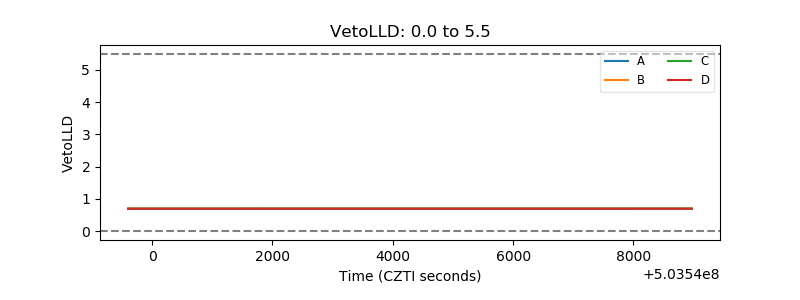 |
| Alpha Counter | 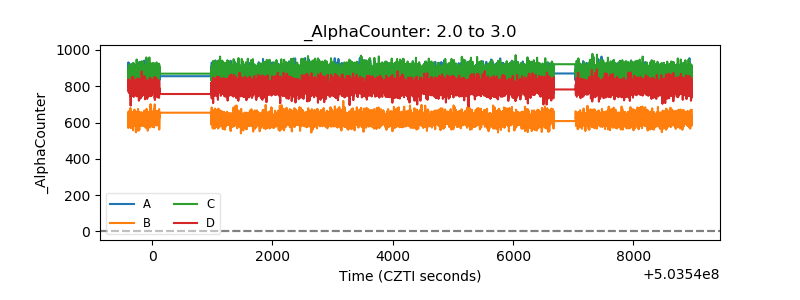 |
| _CPM_Rate | 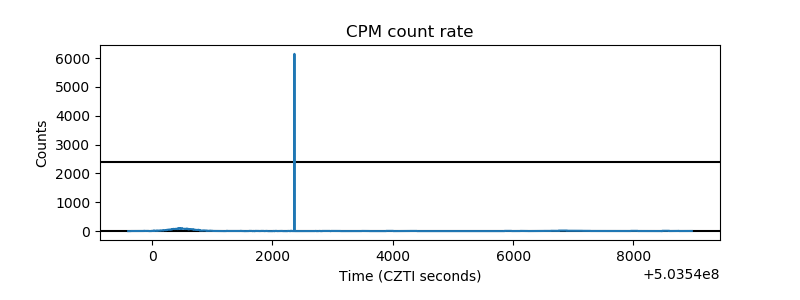 |
| CZT Counter | 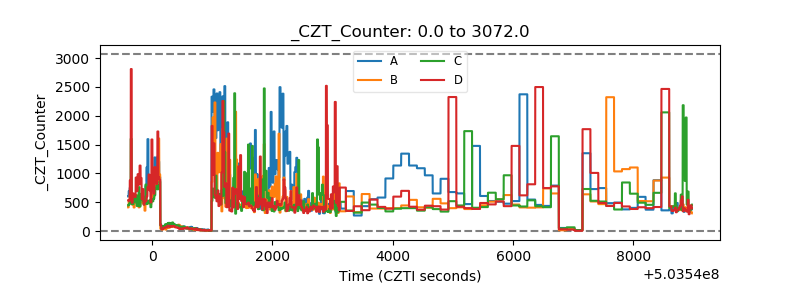 |
| +2.5 Volts monitor |  |
| +5 Volts monitor |  |
| _ROLL_ROT | 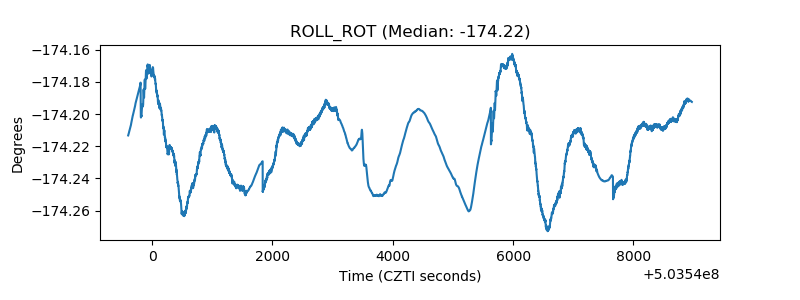 |
| _Roll_DEC | 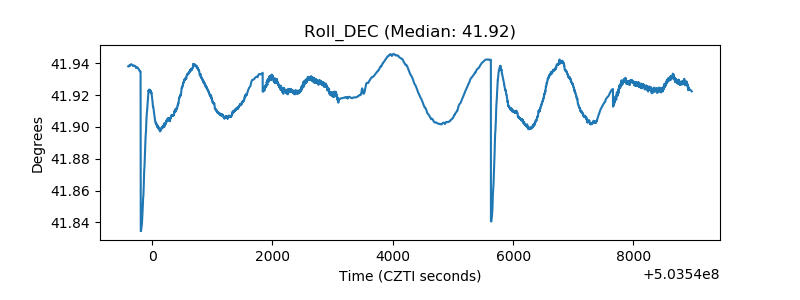 |
| _Roll_RA | 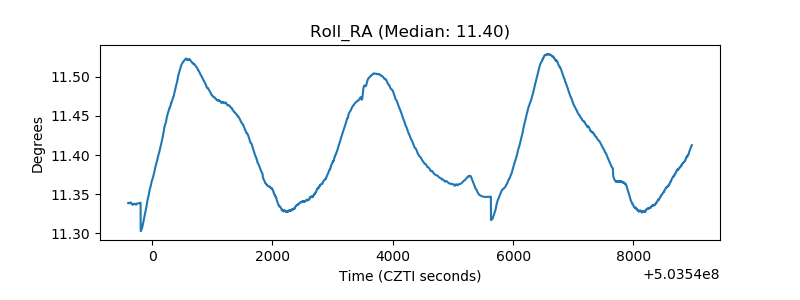 |
| Veto Counter | 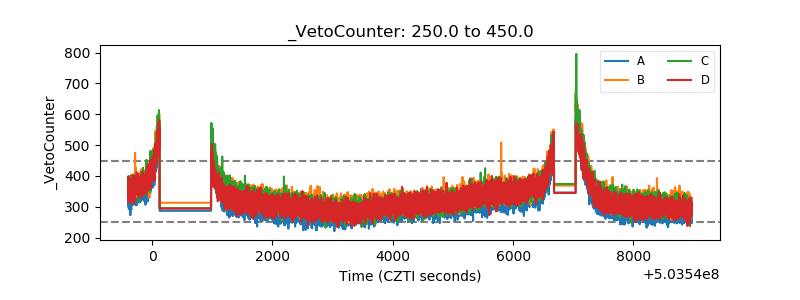 |