| Param | Original file | Final file |
|---|---|---|
| Filename | modeM0/AS1A14_009T01_9000006534_55276cztM0_level2.fits | modeM0/AS1A14_009T01_9000006534_55276cztM0_level2_quad_clean.evt |
| Size (bytes) | 570,407,040 | 116,308,800 |
| Size | 544.0 MB | 110.9 MB |
| Events in quadrant A | 4,220,551 | 761,294 |
| Events in quadrant B | 4,915,749 | 802,086 |
| Events in quadrant C | 4,710,393 | 733,459 |
| Events in quadrant D | 6,622,466 | 646,752 |
| Mode SS | |||
|---|---|---|---|
| Quadrant | BADHDUFLAG | Total packets | Discarded packets |
| A | 0 | 170 | 0 |
| B | 0 | 170 | 0 |
| C | 0 | 170 | 0 |
| D | 0 | 170 | 0 |
| Mode M0 | |||
|---|---|---|---|
| Quadrant | BADHDUFLAG | Total packets | Discarded packets |
| A | 0 | 18788 | 1 |
| B | 0 | 20792 | 2 |
| C | 0 | 20080 | 1 |
| D | 0 | 25751 | 1 |
| Mode M9 | |||
|---|---|---|---|
| Quadrant | BADHDUFLAG | Total packets | Discarded packets |
| A | 0 | 3 | 0 |
| B | 0 | 3 | 0 |
| C | 0 | 3 | 0 |
| D | 0 | 3 | 0 |
| Quadrant | Total seconds | Saturated seconds | Saturation percentage |
|---|---|---|---|
| A | 8313 | 154 | 1.852520% |
| B | 8312 | 377 | 4.535611% |
| C | 8313 | 223 | 2.682545% |
| D | 8313 | 780 | 9.382894% |
Noise dominated data is calculated using 1-second bins in cleaned event files. If a bin has >2000 counts, and if more than 50% of those come from <1% of pixels, then it is considered to be noise-dominated and hence unusable.
| Quadrant | # 1 sec bins | Bins with >0 counts | Bins with >2000 counts | High rate bins dominated by noise | Noise dominated (total time) | Noise dominated (detector-on time) | Marked lightcurve |
|---|---|---|---|---|---|---|---|
| A | 8673 | 8314 | 47 | 47 | 0.54% | 0.57% |  |
| B | 8672 | 8313 | 96 | 96 | 1.11% | 1.15% | 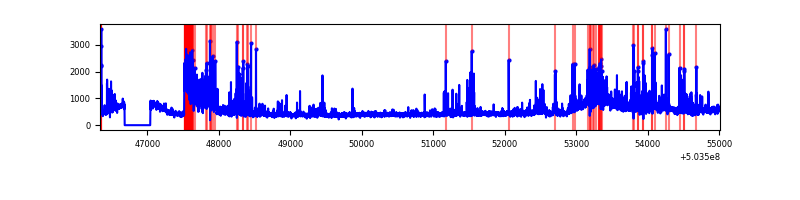 |
| C | 8673 | 8314 | 136 | 136 | 1.57% | 1.64% | 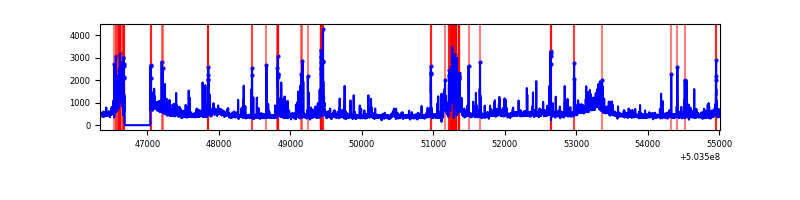 |
| D | 8673 | 8314 | 676 | 676 | 7.79% | 8.13% | 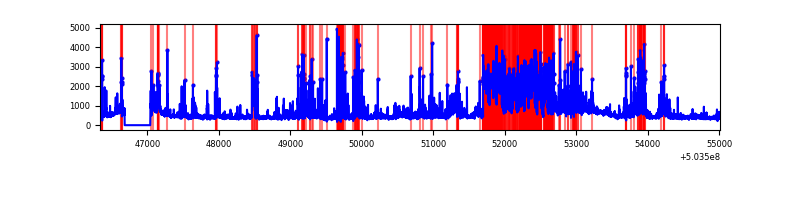 |
Top three noisy pixels from each quadrant. If the there are fewer than three noisy pixels in the level2.evt file, extra rows are filled as -1
| Pixel properties | Quadrant properties | ||||||
|---|---|---|---|---|---|---|---|
| Quadrant | DetID | PixID | Counts | Sigma | Mean | Median | Sigma |
| A | 12 | 115 | 386189 | 1784.26 | 892 | 867 | 216.0 |
| A | 0 | 8 | 194007 | 894.35 | 892 | 867 | 216.0 |
| A | 4 | 3 | 71656 | 327.79 | 892 | 867 | 216.0 |
| B | 1 | 159 | 571807 | 2970.16 | 883 | 848 | 192.2 |
| B | 2 | 249 | 388481 | 2016.49 | 883 | 848 | 192.2 |
| B | 4 | 81 | 341758 | 1773.43 | 883 | 848 | 192.2 |
| C | 15 | 147 | 613862 | 2571.14 | 876 | 868 | 238.4 |
| C | 13 | 3 | 260888 | 1090.63 | 876 | 868 | 238.4 |
| C | 12 | 252 | 101229 | 420.95 | 876 | 868 | 238.4 |
| D | 7 | 70 | 1288701 | 5413.63 | 845 | 809 | 237.9 |
| D | 11 | 129 | 915209 | 3843.67 | 845 | 809 | 237.9 |
| D | 11 | 176 | 367313 | 1540.59 | 845 | 809 | 237.9 |
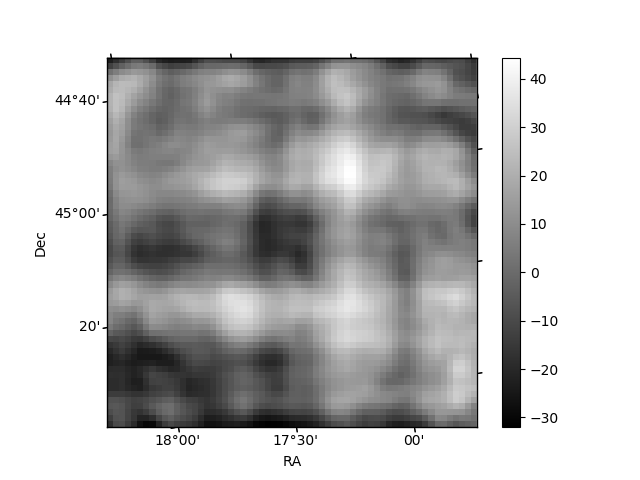
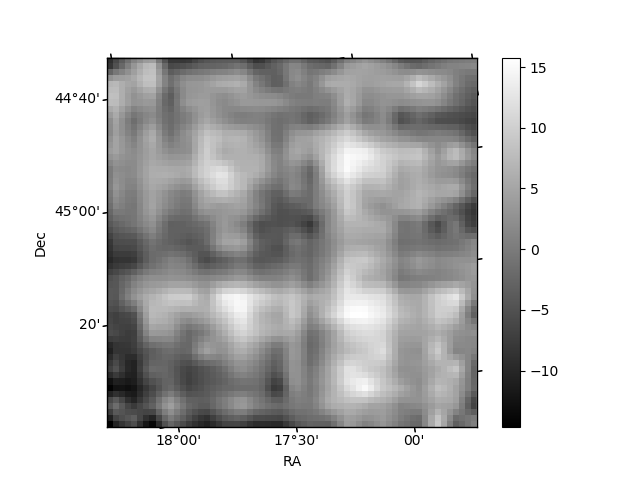
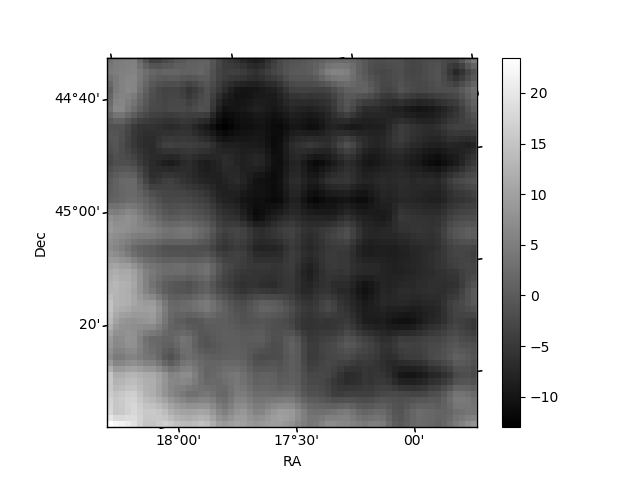
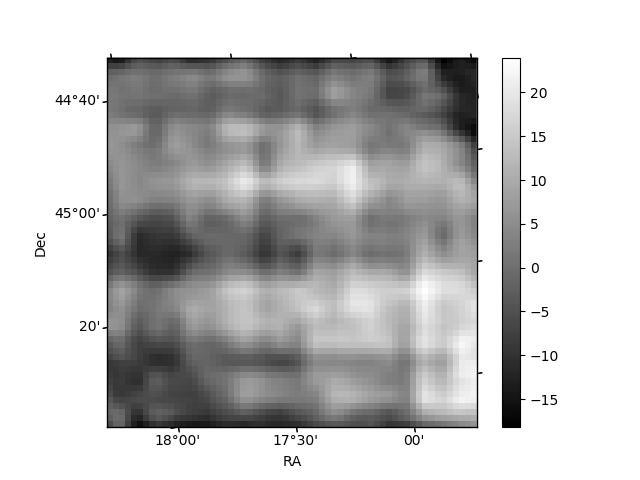
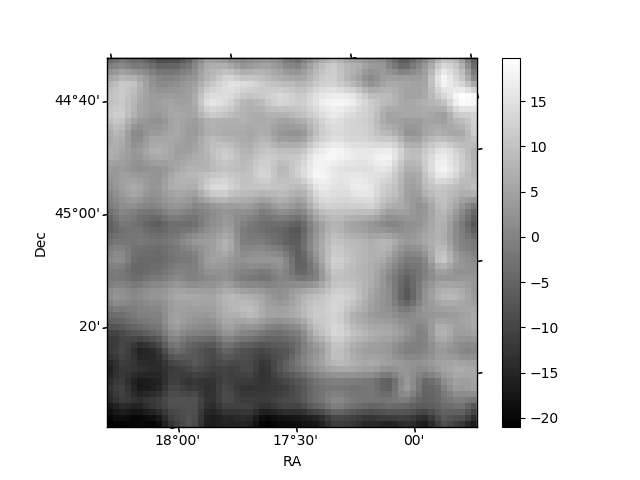
Histogram calculated using DETX and DETY for each event in the final _common_clean file
| Quadrant A | 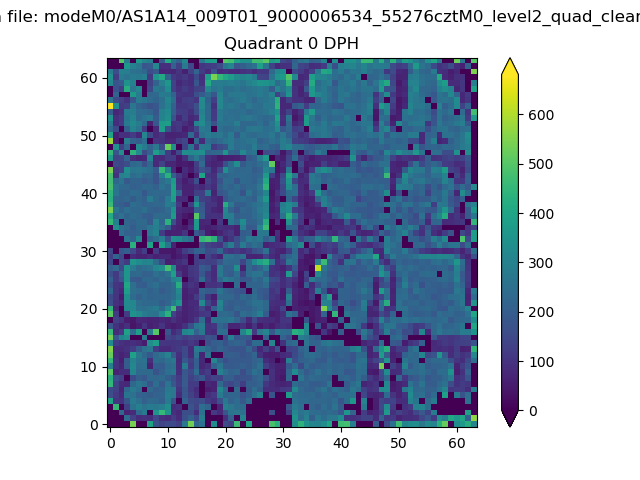 |
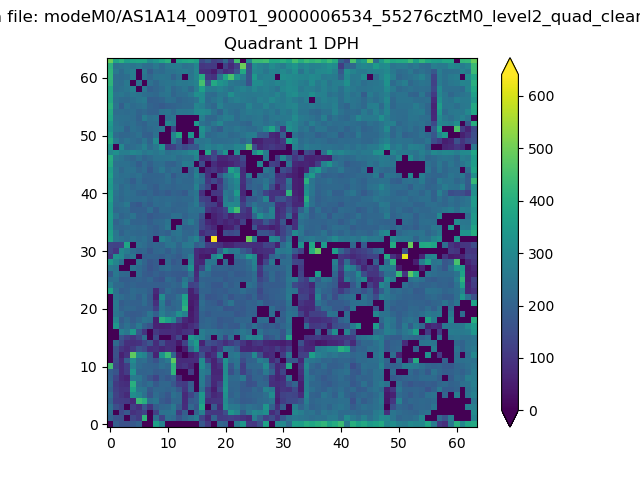 |
Quadrant B |
|---|---|---|---|
| Quadrant D | 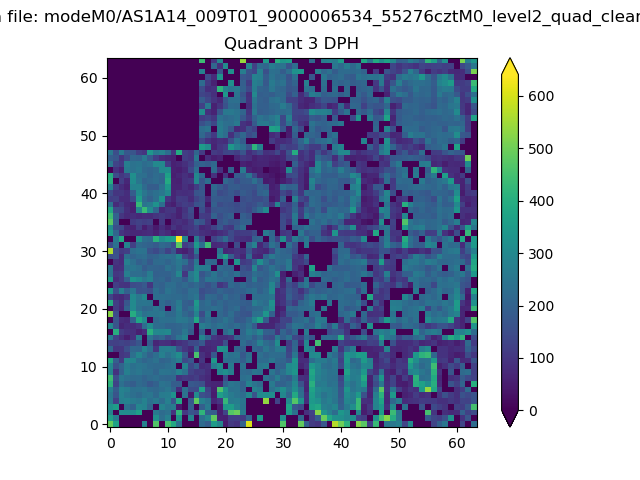 |
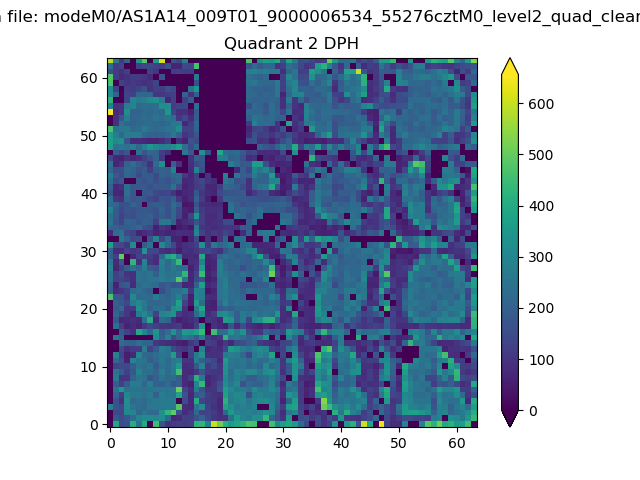 |
Quadrant C |
| Plot type | Count rate plots | Images |
|---|---|---|
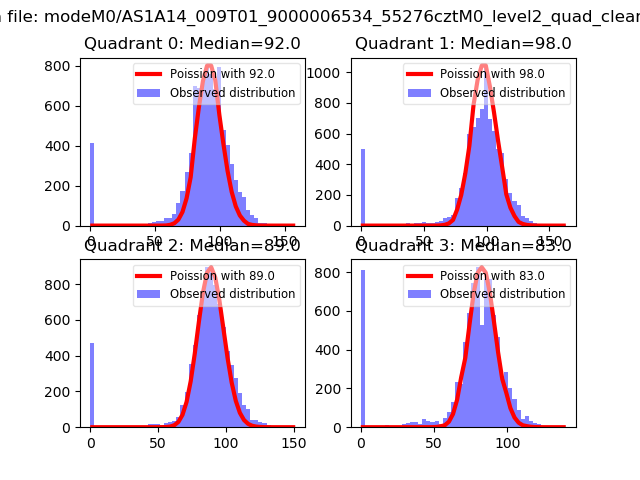
| Comparison with Poisson distribution Blue bars denote a histogram of data divided into 1 sec bins. Red curve is a Poisson curve with rate = median count rate of data. |
 |
 |
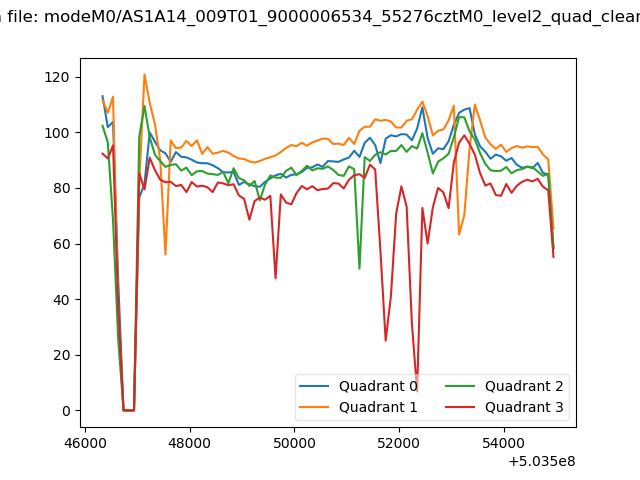
| Quadrant-wise count rates Data is divided into 100 sec bins |
 |
|
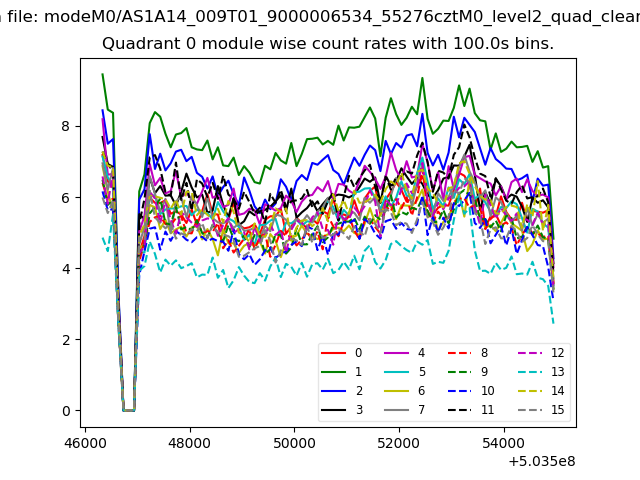
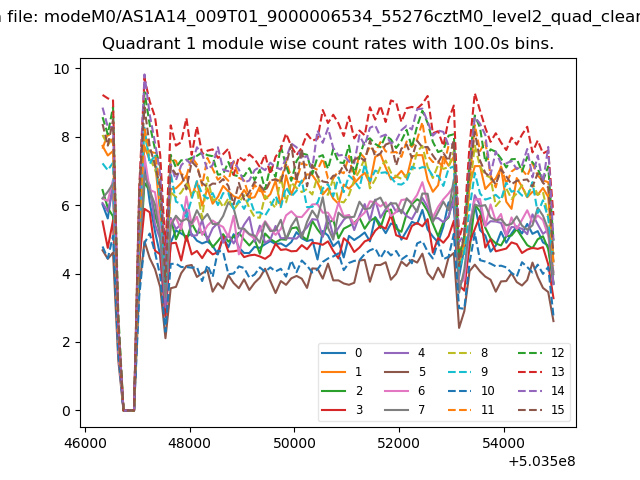
| Module-wise count rates for Quadrant A Data is divided into 100 sec bins |
 |
 |
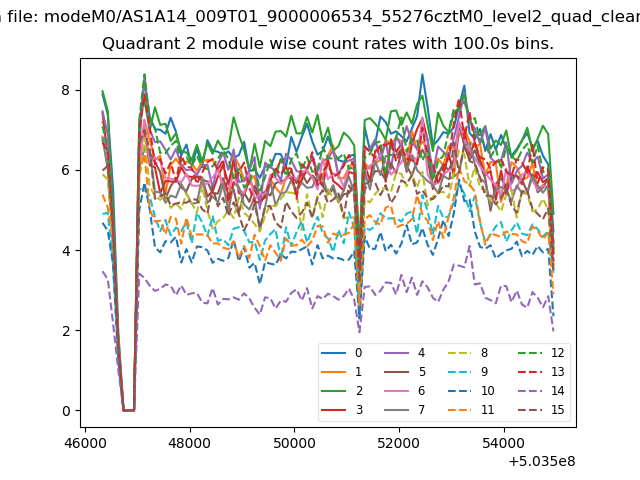
| Module-wise count rates for Quadrant B Data is divided into 100 sec bins |
 |
 |
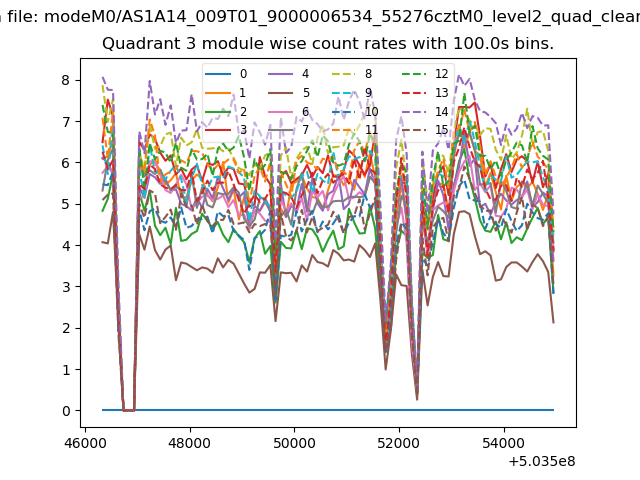
| Module-wise count rates for Quadrant C Data is divided into 100 sec bins |
 |
 |
| Module-wise count rates for Quadrant D Data is divided into 100 sec bins |
 |
 |
| Parameter | Plot |
|---|---|
| CZT HV Monitor | 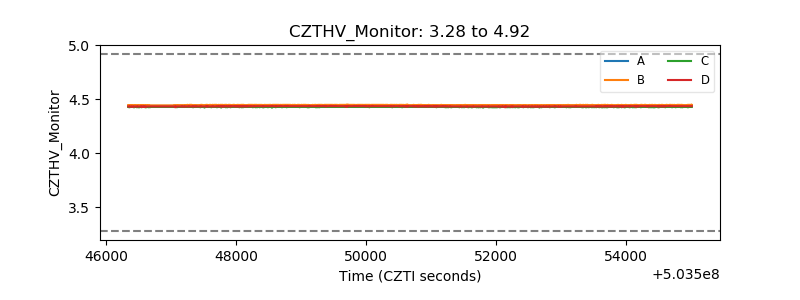 |
| D_VDD | 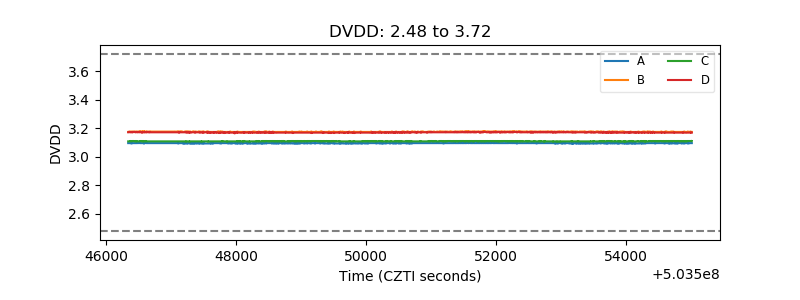 |
| Temperature 1 | 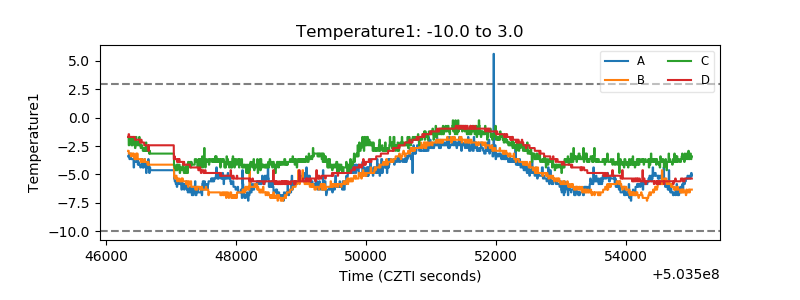 |
| Veto HV Monitor |  |
| Veto LLD | 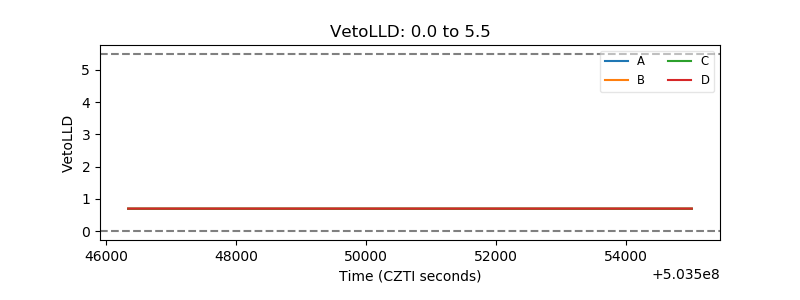 |
| Alpha Counter | 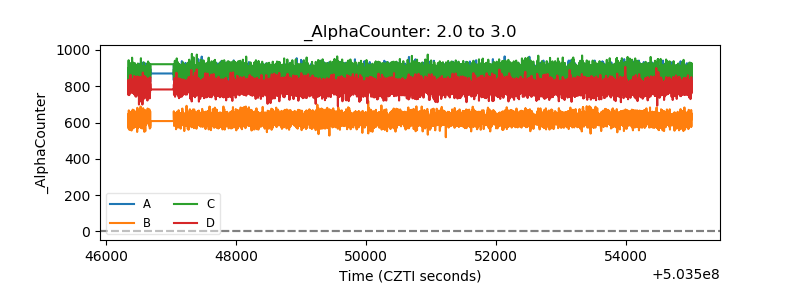 |
| _CPM_Rate | 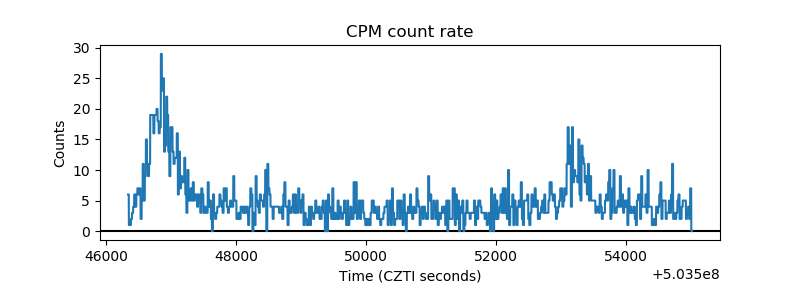 |
| CZT Counter | 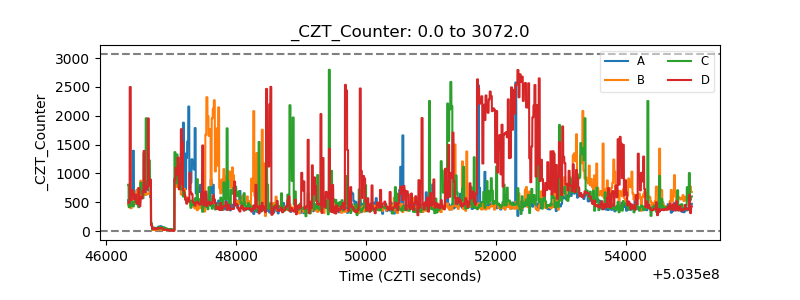 |
| +2.5 Volts monitor | 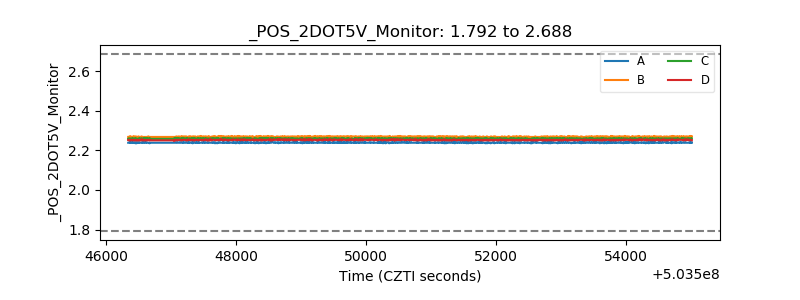 |
| +5 Volts monitor | 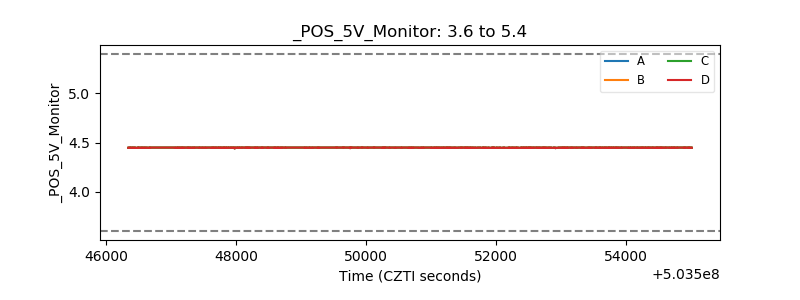 |
| _ROLL_ROT | 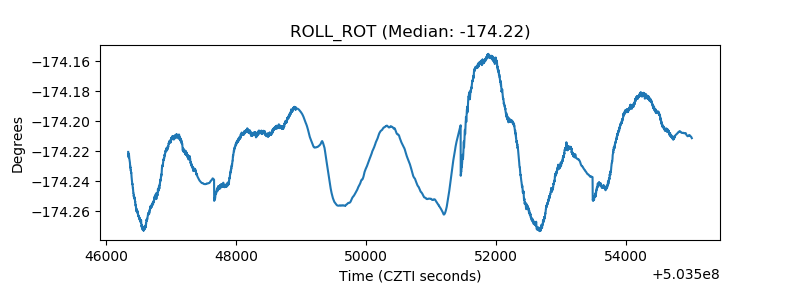 |
| _Roll_DEC | 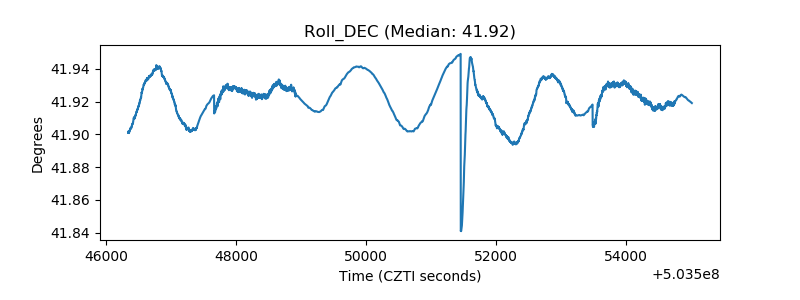 |
| _Roll_RA | 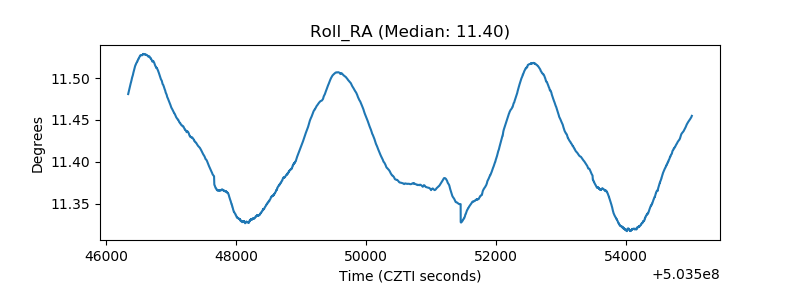 |
| Veto Counter | 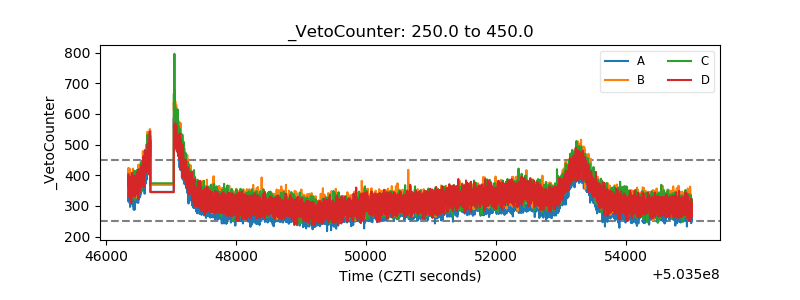 |