| Param | Original file | Final file |
|---|---|---|
| Filename | modeM0/AS1A14_009T01_9000006534_55277cztM0_level2.fits | modeM0/AS1A14_009T01_9000006534_55277cztM0_level2_quad_clean.evt |
| Size (bytes) | 568,624,320 | 118,944,000 |
| Size | 542.3 MB | 113.4 MB |
| Events in quadrant A | 3,941,274 | 772,565 |
| Events in quadrant B | 6,147,638 | 804,758 |
| Events in quadrant C | 4,975,978 | 741,369 |
| Events in quadrant D | 5,330,047 | 697,580 |
| Mode SS | |||
|---|---|---|---|
| Quadrant | BADHDUFLAG | Total packets | Discarded packets |
| A | 0 | 168 | 0 |
| B | 0 | 168 | 0 |
| C | 0 | 168 | 0 |
| D | 0 | 168 | 0 |
| Mode M0 | |||
|---|---|---|---|
| Quadrant | BADHDUFLAG | Total packets | Discarded packets |
| A | 0 | 18237 | 0 |
| B | 0 | 24211 | 0 |
| C | 0 | 20927 | 0 |
| D | 0 | 22105 | 0 |
| Quadrant | Total seconds | Saturated seconds | Saturation percentage |
|---|---|---|---|
| A | 8425 | 37 | 0.439169% |
| B | 8426 | 412 | 4.889627% |
| C | 8426 | 185 | 2.195585% |
| D | 8426 | 207 | 2.456682% |
Noise dominated data is calculated using 1-second bins in cleaned event files. If a bin has >2000 counts, and if more than 50% of those come from <1% of pixels, then it is considered to be noise-dominated and hence unusable.
| Quadrant | # 1 sec bins | Bins with >0 counts | Bins with >2000 counts | High rate bins dominated by noise | Noise dominated (total time) | Noise dominated (detector-on time) | Marked lightcurve |
|---|---|---|---|---|---|---|---|
| A | 8425 | 8425 | 18 | 18 | 0.21% | 0.21% | 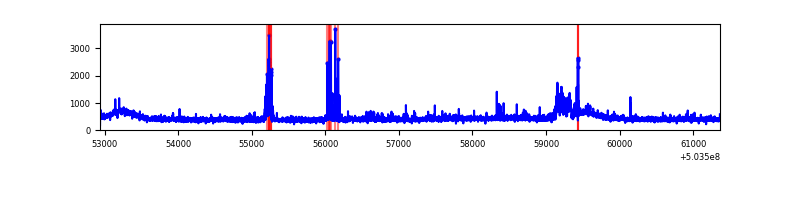 |
| B | 8426 | 8426 | 43 | 43 | 0.51% | 0.51% | 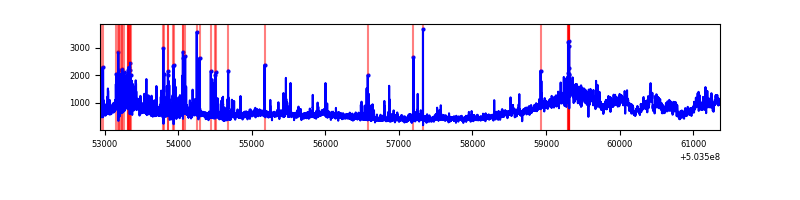 |
| C | 8426 | 8426 | 151 | 151 | 1.79% | 1.79% | 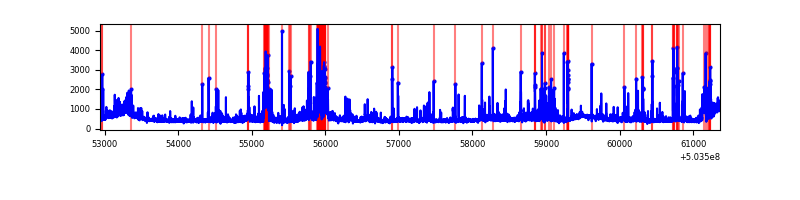 |
| D | 8426 | 8426 | 169 | 169 | 2.01% | 2.01% | 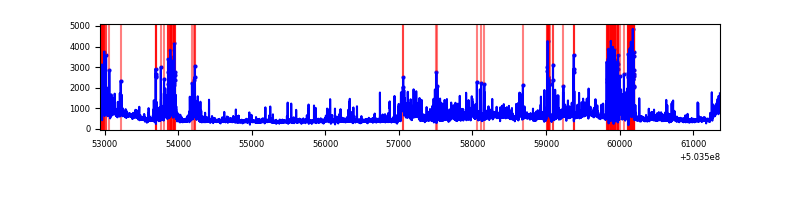 |
Top three noisy pixels from each quadrant. If the there are fewer than three noisy pixels in the level2.evt file, extra rows are filled as -1
| Pixel properties | Quadrant properties | ||||||
|---|---|---|---|---|---|---|---|
| Quadrant | DetID | PixID | Counts | Sigma | Mean | Median | Sigma |
| A | 7 | 7 | 143363 | 650.33 | 896 | 875 | 219.1 |
| A | 0 | 8 | 110351 | 499.66 | 896 | 875 | 219.1 |
| A | 7 | 160 | 87382 | 394.83 | 896 | 875 | 219.1 |
| B | 2 | 249 | 2171556 | 11554.76 | 881 | 847 | 187.9 |
| B | 4 | 81 | 344433 | 1828.92 | 881 | 847 | 187.9 |
| B | 5 | 185 | 55817 | 292.61 | 881 | 847 | 187.9 |
| C | 15 | 128 | 340340 | 1411.71 | 879 | 868 | 240.5 |
| C | 15 | 147 | 288228 | 1195.0 | 879 | 868 | 240.5 |
| C | 13 | 3 | 240310 | 995.73 | 879 | 868 | 240.5 |
| D | 5 | 38 | 409551 | 1688.31 | 865 | 831 | 242.1 |
| D | 11 | 176 | 381745 | 1573.45 | 865 | 831 | 242.1 |
| D | 11 | 129 | 252017 | 1037.58 | 865 | 831 | 242.1 |
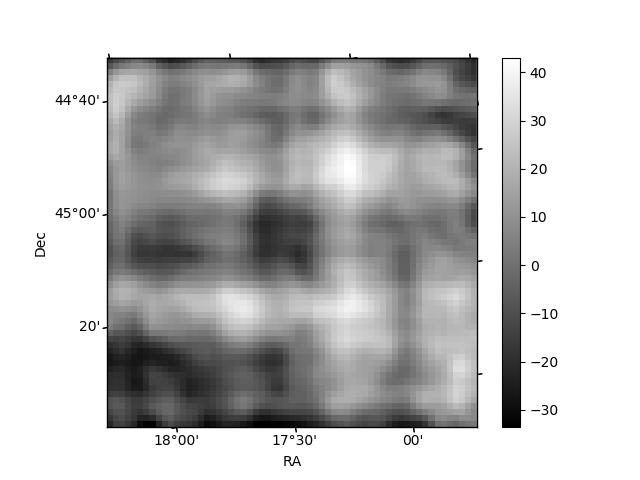
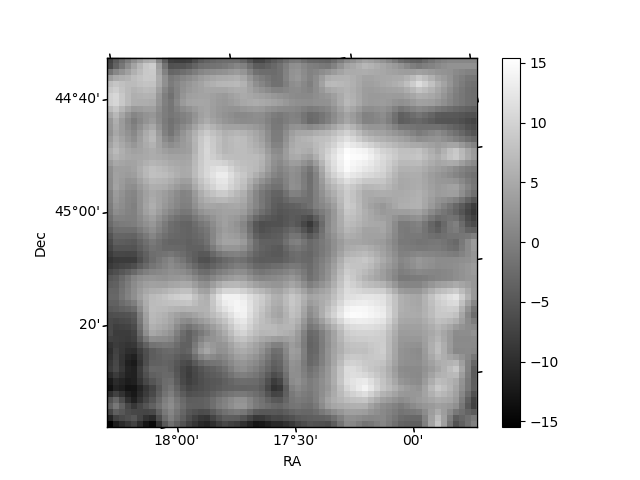
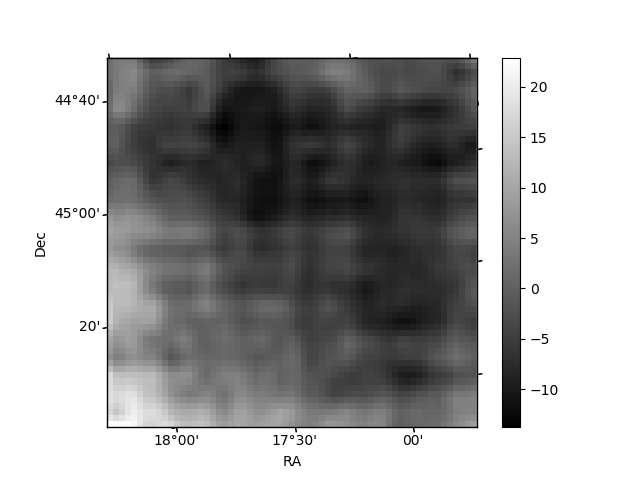
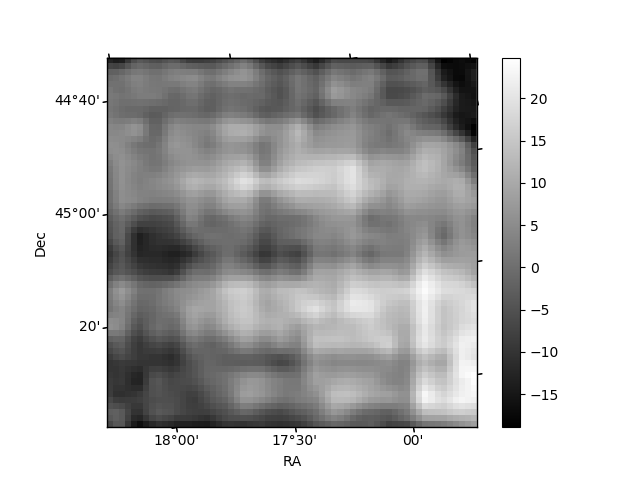
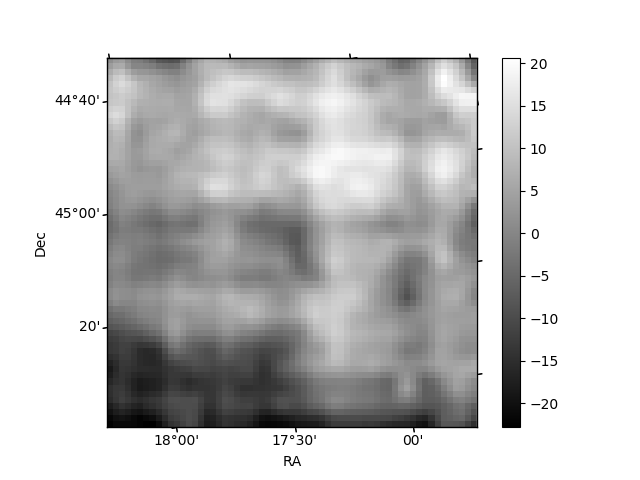
Histogram calculated using DETX and DETY for each event in the final _common_clean file
| Quadrant A | 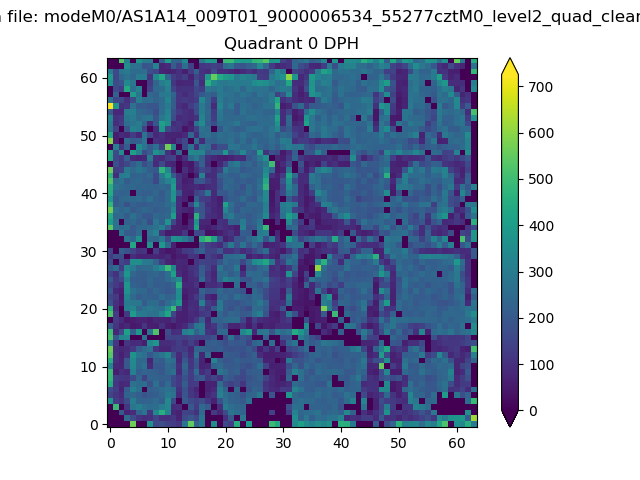 |
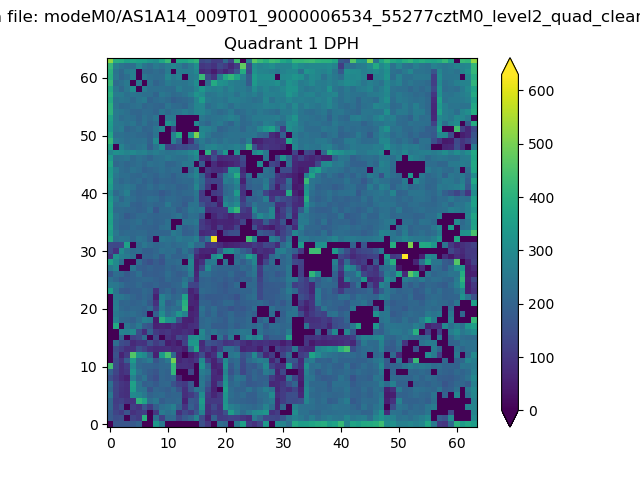 |
Quadrant B |
|---|---|---|---|
| Quadrant D | 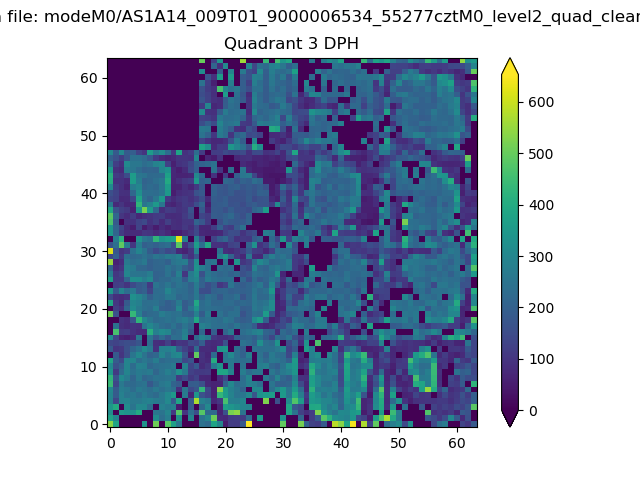 |
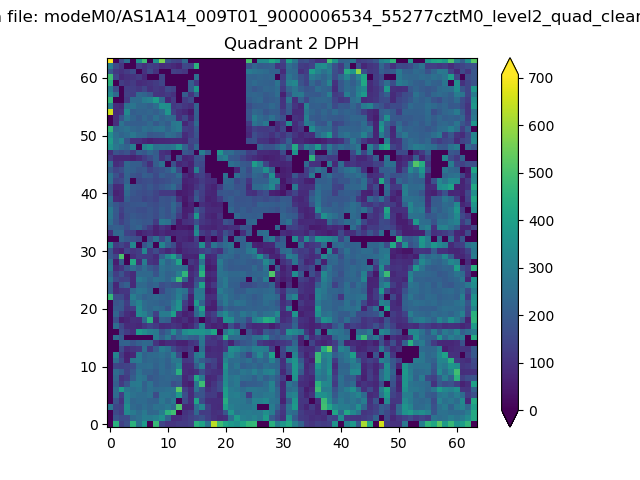 |
Quadrant C |
| Plot type | Count rate plots | Images |
|---|---|---|
| Comparison with Poisson distribution Blue bars denote a histogram of data divided into 1 sec bins. Red curve is a Poisson curve with rate = median count rate of data. |
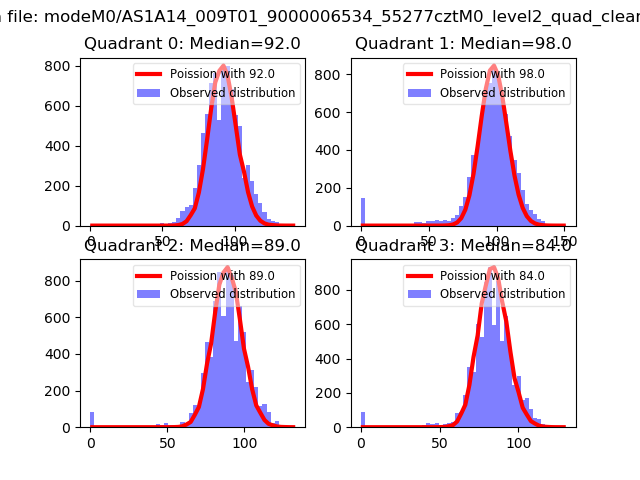 |
 |
| Quadrant-wise count rates Data is divided into 100 sec bins |
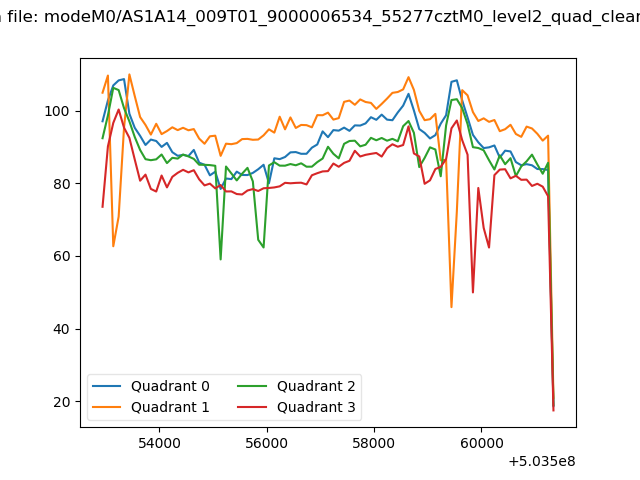 |
|
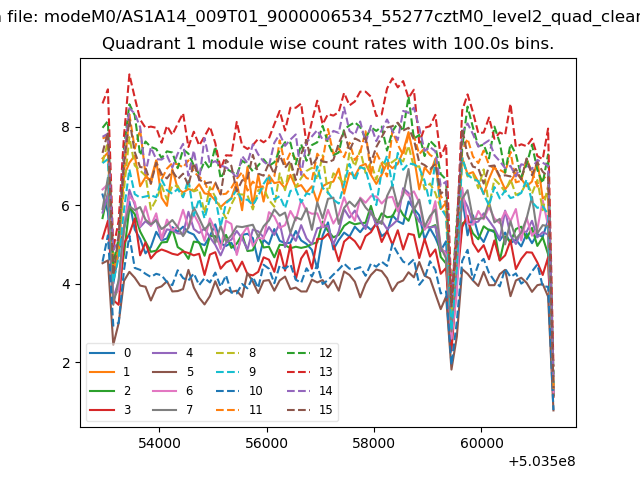
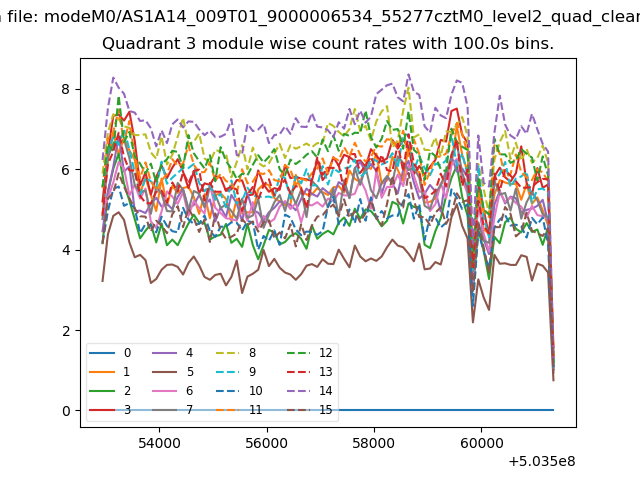
| Module-wise count rates for Quadrant A Data is divided into 100 sec bins |
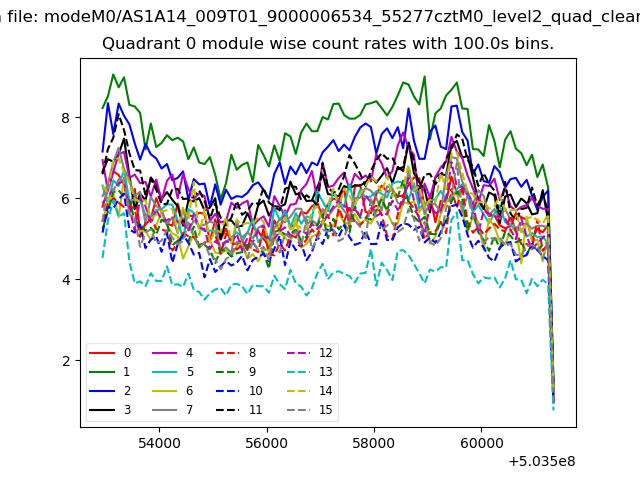 |
 |
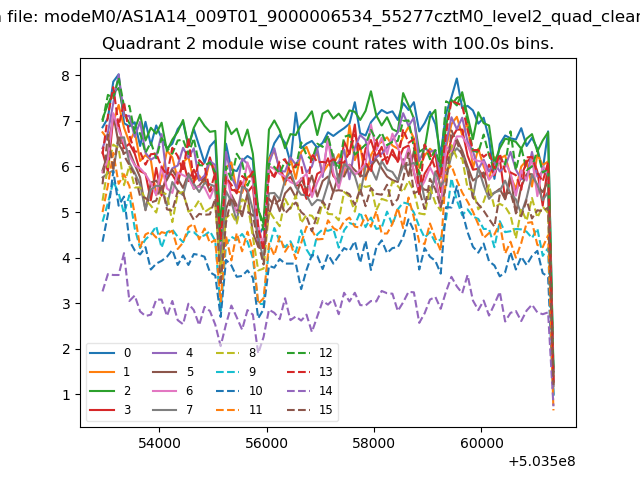
| Module-wise count rates for Quadrant B Data is divided into 100 sec bins |
 |
 |
| Module-wise count rates for Quadrant C Data is divided into 100 sec bins |
 |
 |
| Module-wise count rates for Quadrant D Data is divided into 100 sec bins |
 |
 |
| Parameter | Plot |
|---|---|
| CZT HV Monitor | 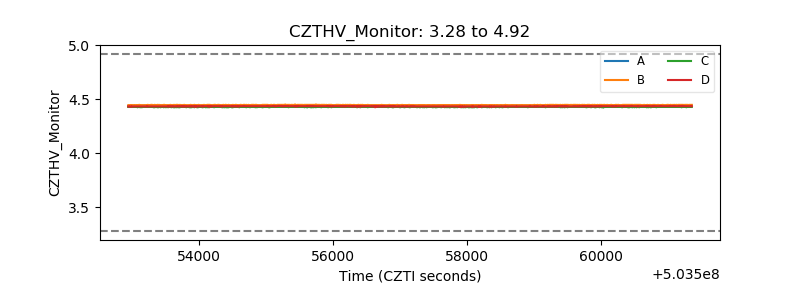 |
| D_VDD | 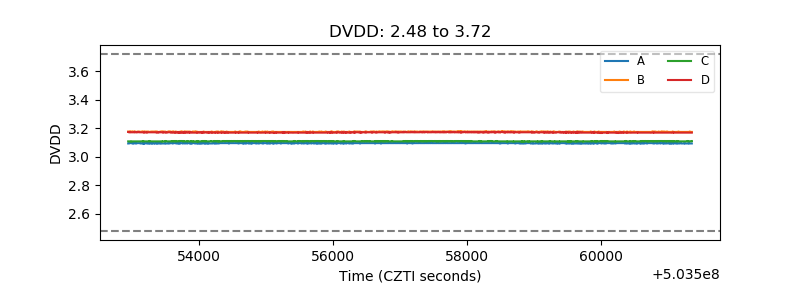 |
| Temperature 1 | 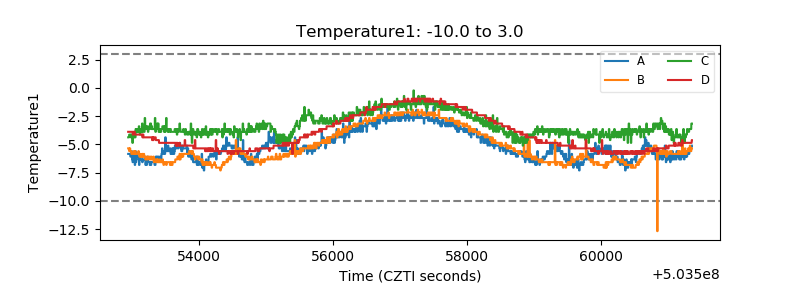 |
| Veto HV Monitor | 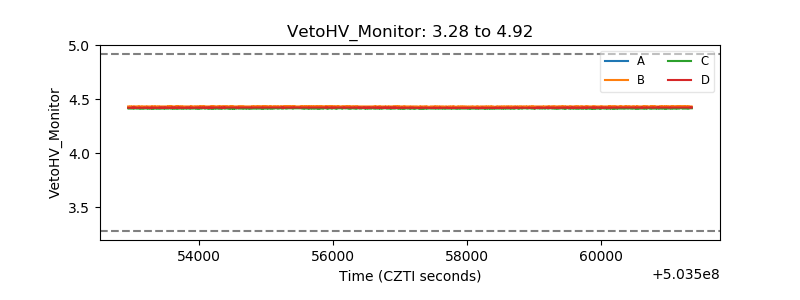 |
| Veto LLD | 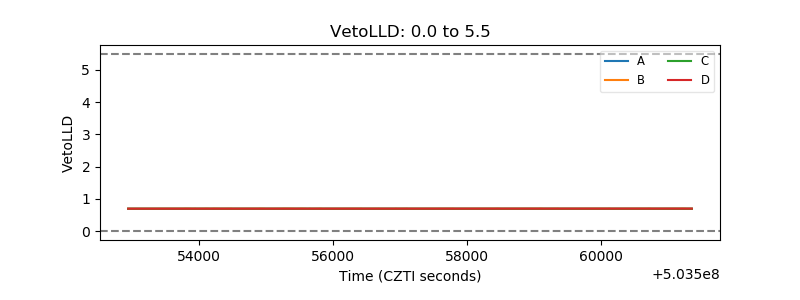 |
| Alpha Counter | 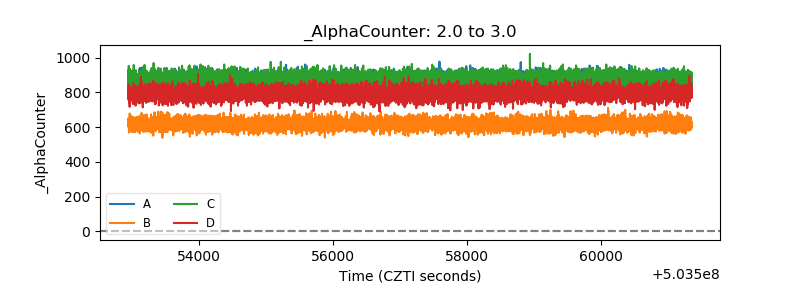 |
| _CPM_Rate | 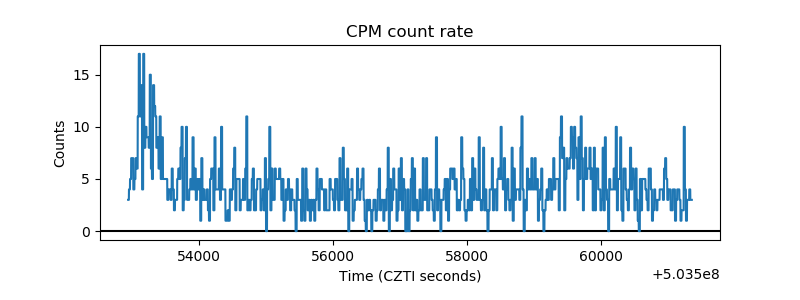 |
| CZT Counter | 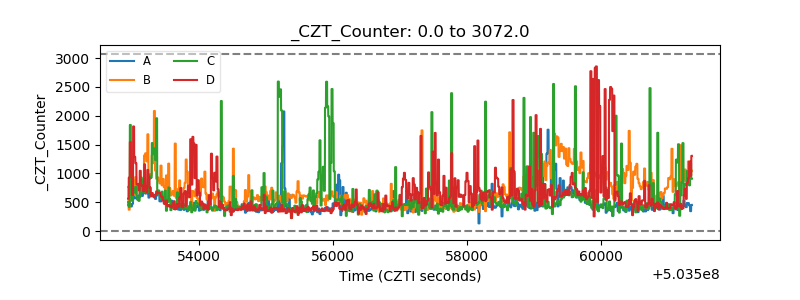 |
| +2.5 Volts monitor | 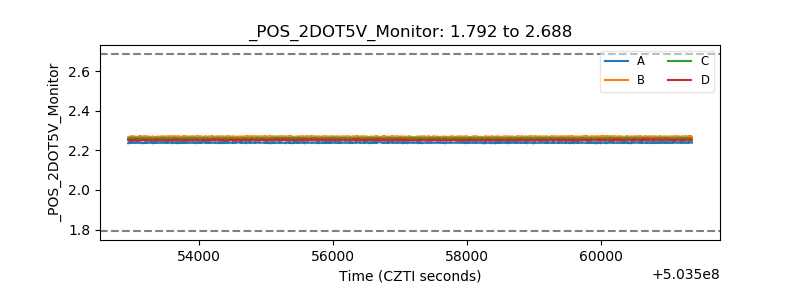 |
| +5 Volts monitor | 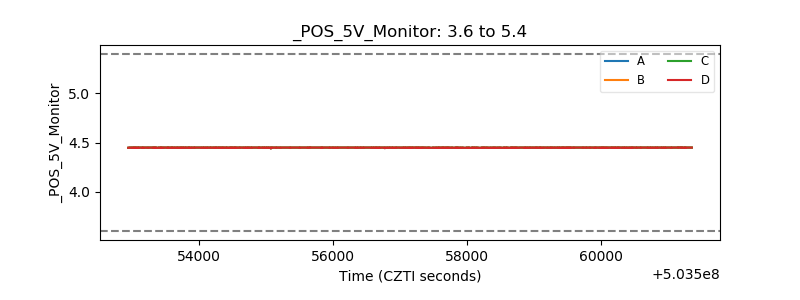 |
| _ROLL_ROT | 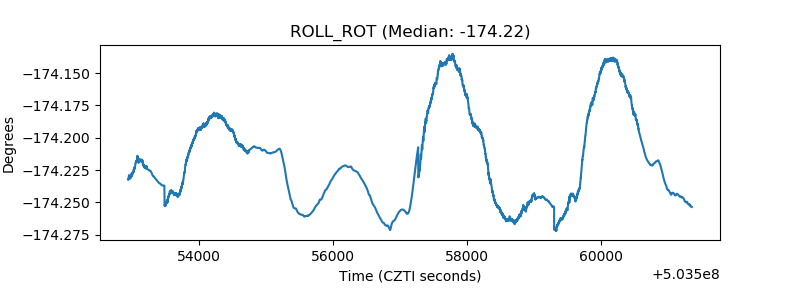 |
| _Roll_DEC | 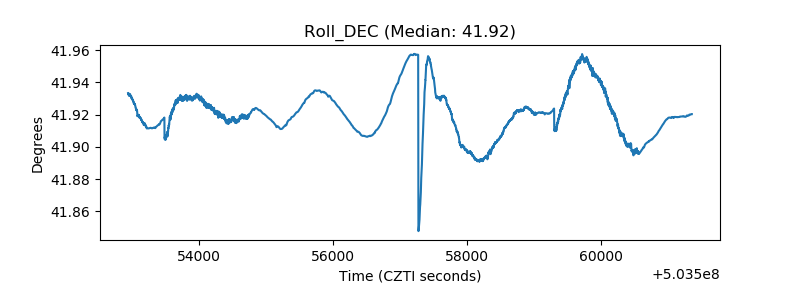 |
| _Roll_RA | 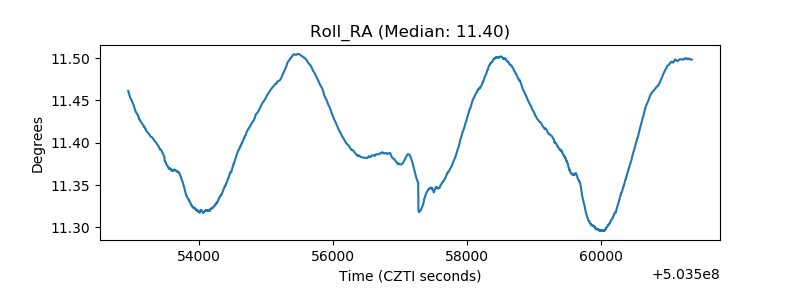 |
| Veto Counter | 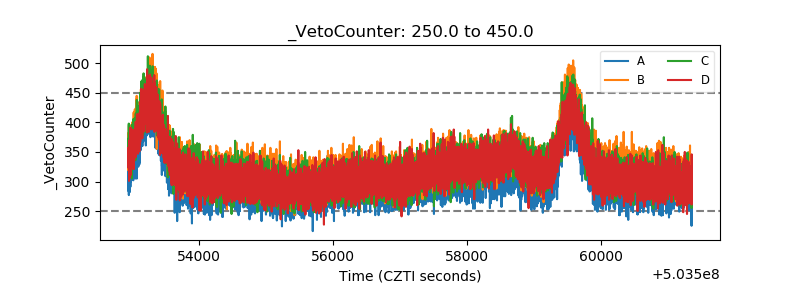 |