| Param | Original file | Final file |
|---|---|---|
| Filename | modeM0/AS1A14_009T01_9000006534_55280cztM0_level2.fits | modeM0/AS1A14_009T01_9000006534_55280cztM0_level2_quad_clean.evt |
| Size (bytes) | 1,206,777,600 | 274,720,320 |
| Size | 1.1 GB | 262.0 MB |
| Events in quadrant A | 8,902,359 | 1,767,864 |
| Events in quadrant B | 9,975,085 | 1,899,488 |
| Events in quadrant C | 10,305,454 | 1,718,873 |
| Events in quadrant D | 13,959,599 | 1,572,539 |
| Mode SS | |||
|---|---|---|---|
| Quadrant | BADHDUFLAG | Total packets | Discarded packets |
| A | 0 | 398 | 0 |
| B | 0 | 398 | 0 |
| C | 0 | 398 | 0 |
| D | 0 | 398 | 0 |
| Mode M0 | |||
|---|---|---|---|
| Quadrant | BADHDUFLAG | Total packets | Discarded packets |
| A | 0 | 41826 | 2 |
| B | 0 | 44711 | 2 |
| C | 0 | 45532 | 2 |
| D | 0 | 54958 | 2 |
| Mode M9 | |||
|---|---|---|---|
| Quadrant | BADHDUFLAG | Total packets | Discarded packets |
| A | 0 | 10 | 0 |
| B | 0 | 10 | 0 |
| C | 0 | 10 | 0 |
| D | 0 | 10 | 0 |
| Quadrant | Total seconds | Saturated seconds | Saturation percentage |
|---|---|---|---|
| A | 19728 | 439 | 2.225264% |
| B | 19728 | 571 | 2.894363% |
| C | 19729 | 479 | 2.427898% |
| D | 19729 | 1072 | 5.433626% |
Noise dominated data is calculated using 1-second bins in cleaned event files. If a bin has >2000 counts, and if more than 50% of those come from <1% of pixels, then it is considered to be noise-dominated and hence unusable.
| Quadrant | # 1 sec bins | Bins with >0 counts | Bins with >2000 counts | High rate bins dominated by noise | Noise dominated (total time) | Noise dominated (detector-on time) | Marked lightcurve |
|---|---|---|---|---|---|---|---|
| A | 20678 | 19729 | 100 | 100 | 0.48% | 0.51% | 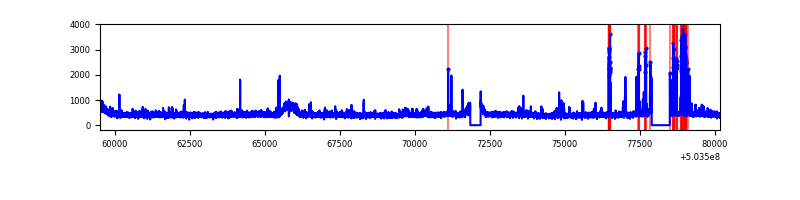 |
| B | 20678 | 19730 | 33 | 33 | 0.16% | 0.17% | 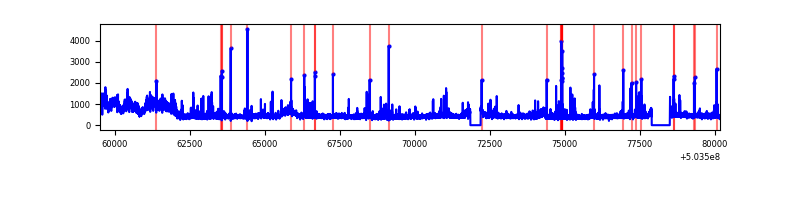 |
| C | 20679 | 19731 | 278 | 278 | 1.34% | 1.41% | 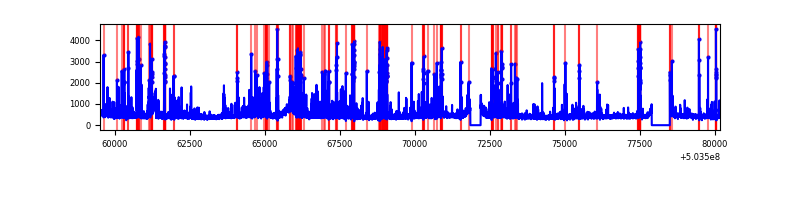 |
| D | 20679 | 19731 | 842 | 842 | 4.07% | 4.27% | 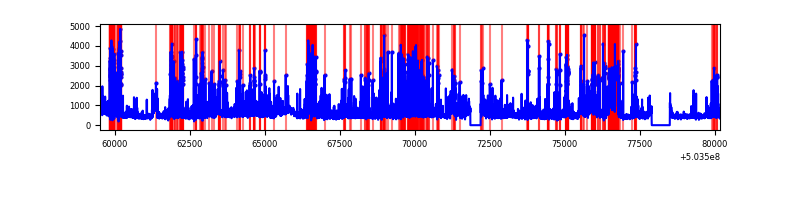 |
Top three noisy pixels from each quadrant. If the there are fewer than three noisy pixels in the level2.evt file, extra rows are filled as -1
| Pixel properties | Quadrant properties | ||||||
|---|---|---|---|---|---|---|---|
| Quadrant | DetID | PixID | Counts | Sigma | Mean | Median | Sigma |
| A | 0 | 8 | 471604 | 923.59 | 2083 | 2026 | 508.4 |
| A | 7 | 243 | 144639 | 280.5 | 2083 | 2026 | 508.4 |
| A | 4 | 3 | 63824 | 121.55 | 2083 | 2026 | 508.4 |
| B | 2 | 249 | 1305574 | 2960.62 | 2061 | 1980 | 440.3 |
| B | 1 | 159 | 161943 | 363.3 | 2061 | 1980 | 440.3 |
| B | 5 | 185 | 120927 | 270.14 | 2061 | 1980 | 440.3 |
| C | 13 | 3 | 990500 | 1792.23 | 2029 | 2017 | 551.5 |
| C | 12 | 252 | 272365 | 490.17 | 2029 | 2017 | 551.5 |
| C | 10 | 22 | 270080 | 486.03 | 2029 | 2017 | 551.5 |
| D | 7 | 70 | 1790391 | 3239.45 | 1991 | 1906 | 552.1 |
| D | 11 | 129 | 1458064 | 2637.52 | 1991 | 1906 | 552.1 |
| D | 2 | 31 | 682383 | 1232.54 | 1991 | 1906 | 552.1 |
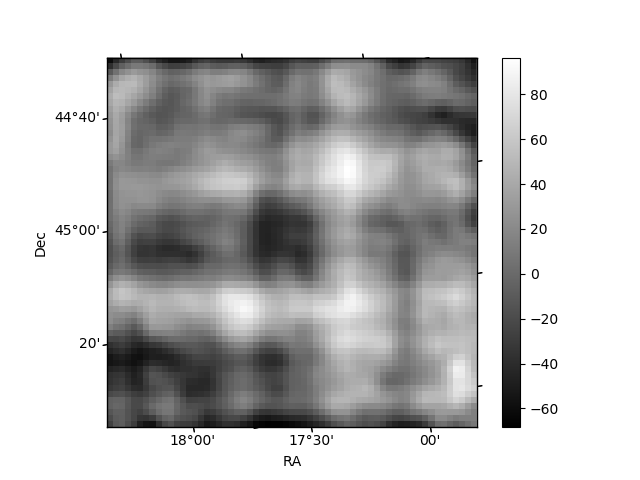
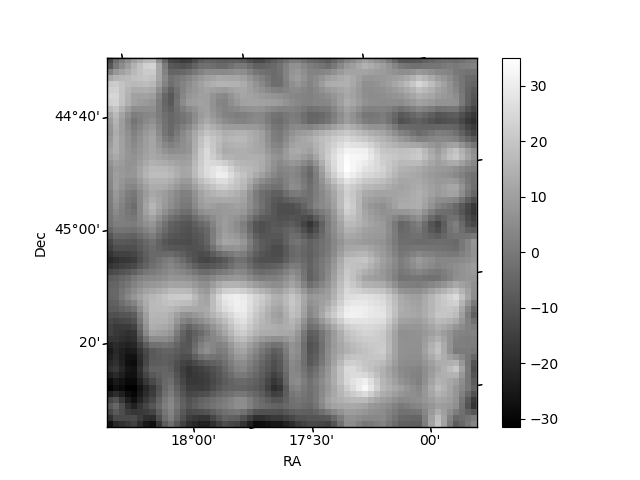
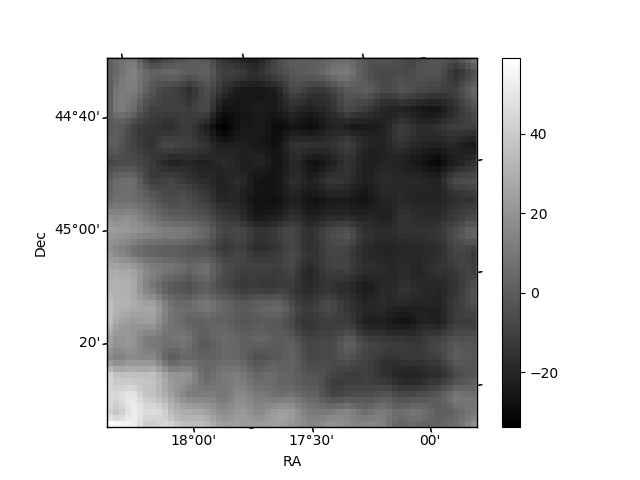
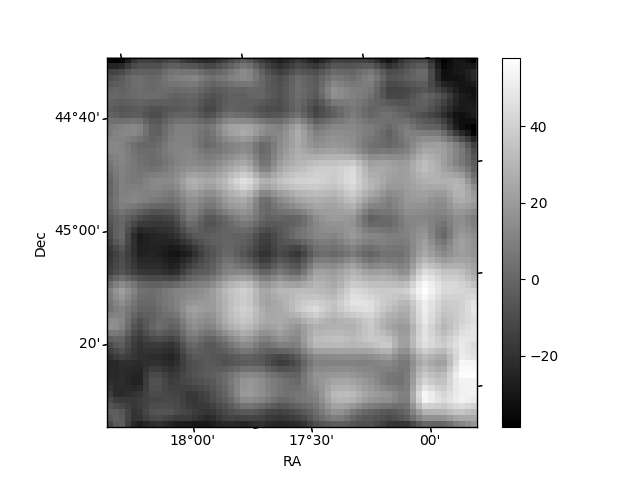
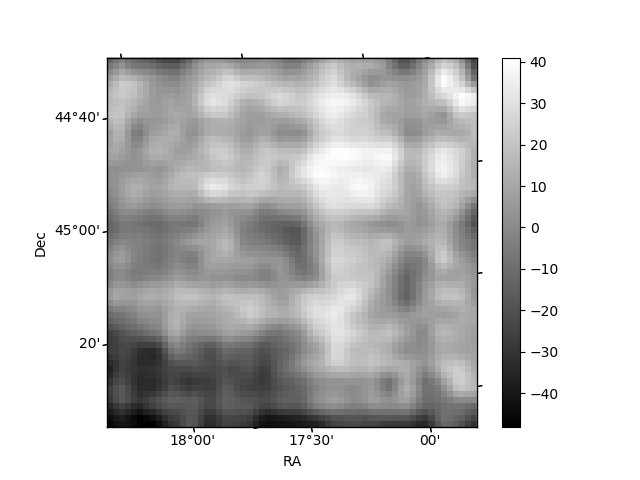
Histogram calculated using DETX and DETY for each event in the final _common_clean file
| Quadrant A | 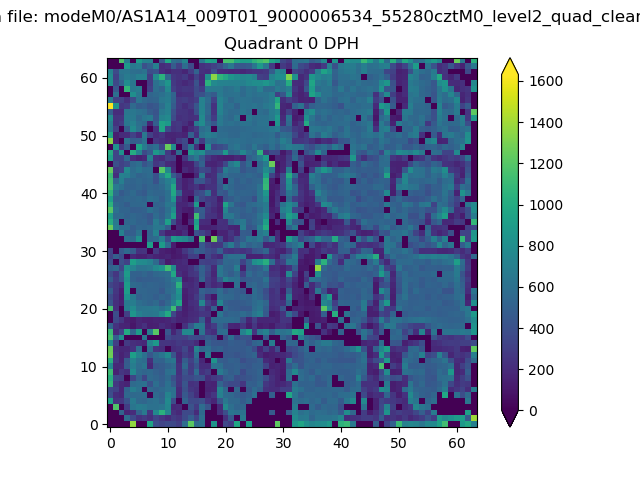 |
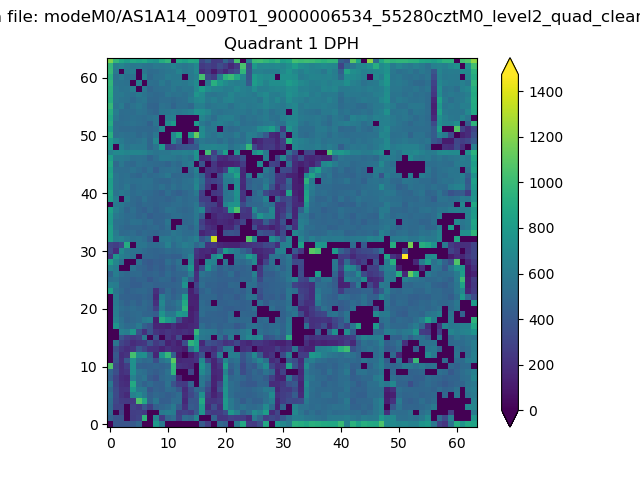 |
Quadrant B |
|---|---|---|---|
| Quadrant D | 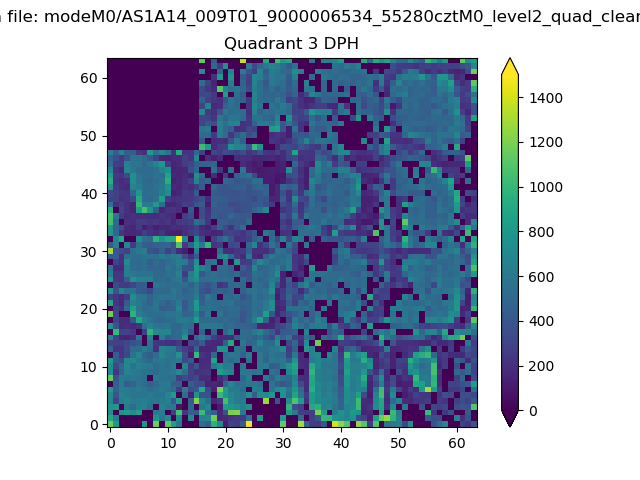 |
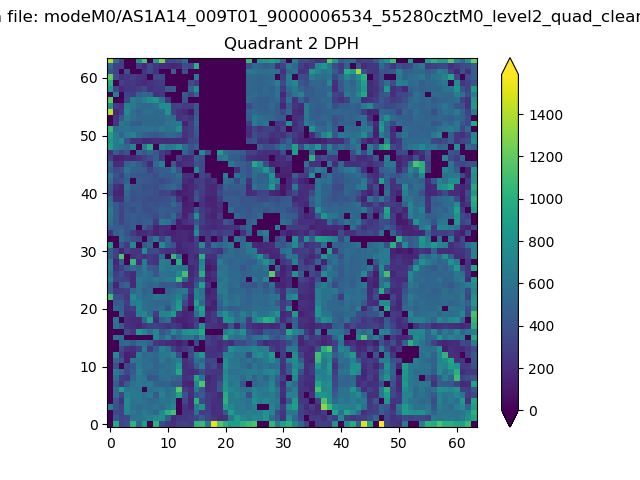 |
Quadrant C |
| Plot type | Count rate plots | Images |
|---|---|---|
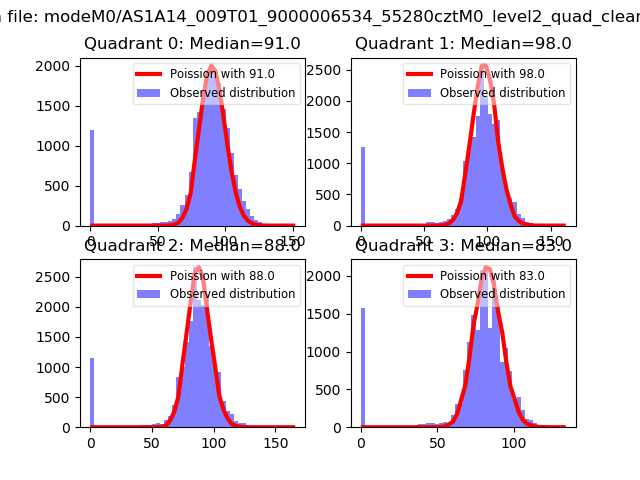
| Comparison with Poisson distribution Blue bars denote a histogram of data divided into 1 sec bins. Red curve is a Poisson curve with rate = median count rate of data. |
 |
 |
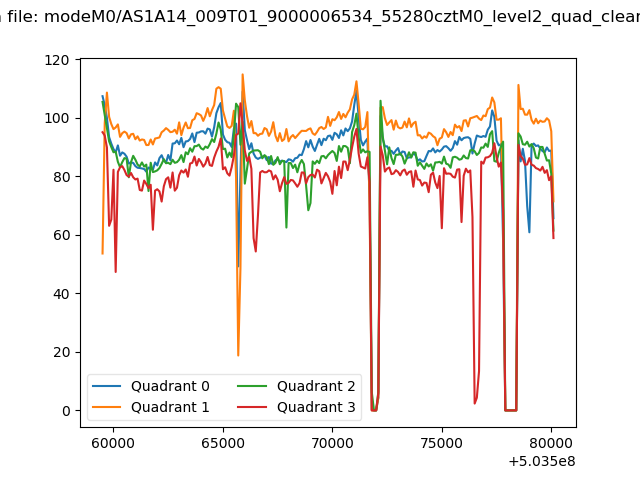
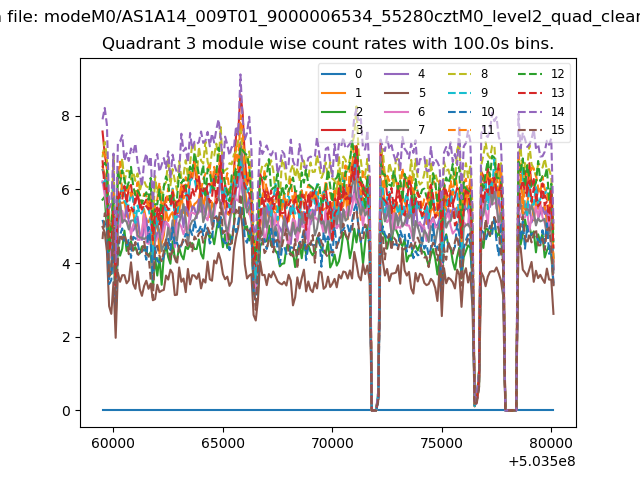
| Quadrant-wise count rates Data is divided into 100 sec bins |
 |
|
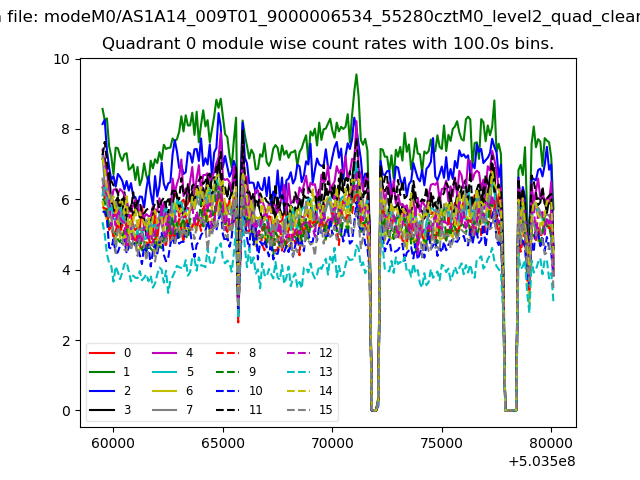
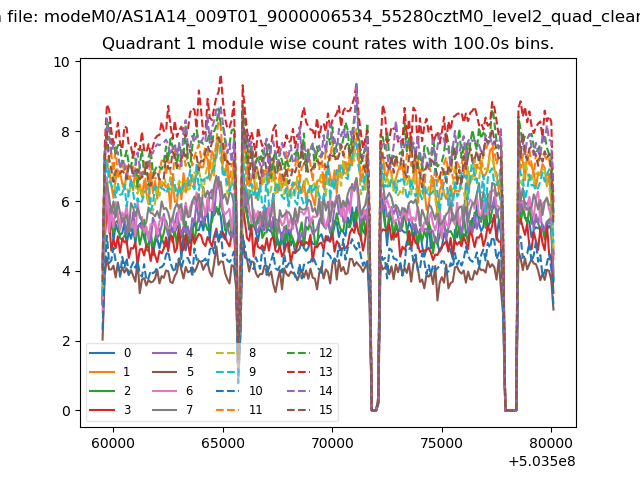
| Module-wise count rates for Quadrant A Data is divided into 100 sec bins |
 |
 |
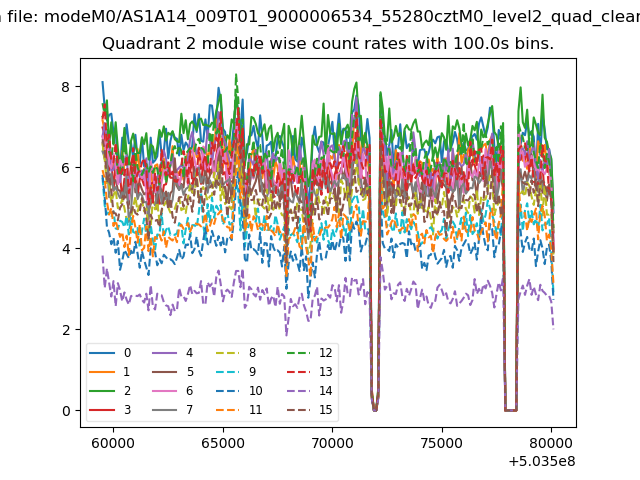
| Module-wise count rates for Quadrant B Data is divided into 100 sec bins |
 |
 |
| Module-wise count rates for Quadrant C Data is divided into 100 sec bins |
 |
 |
| Module-wise count rates for Quadrant D Data is divided into 100 sec bins |
 |
 |
| Parameter | Plot |
|---|---|
| CZT HV Monitor | 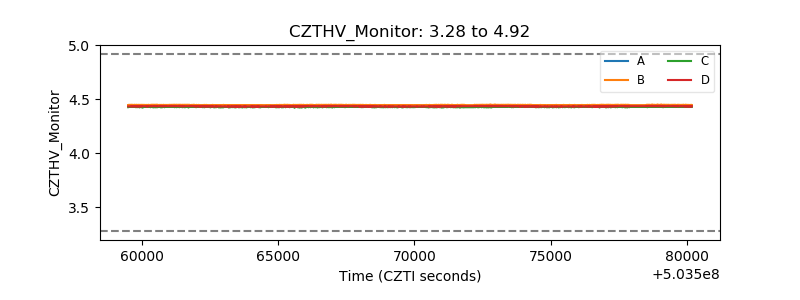 |
| D_VDD |  |
| Temperature 1 |  |
| Veto HV Monitor |  |
| Veto LLD |  |
| Alpha Counter | 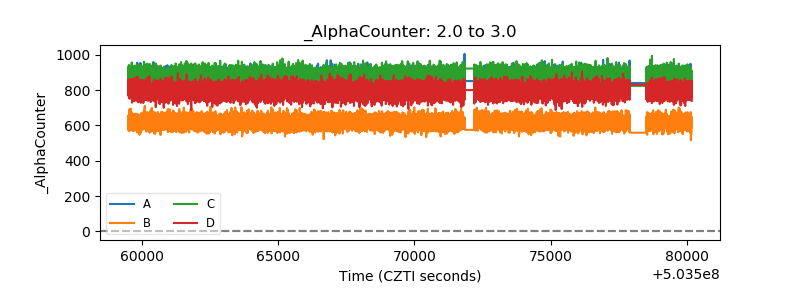 |
| _CPM_Rate | 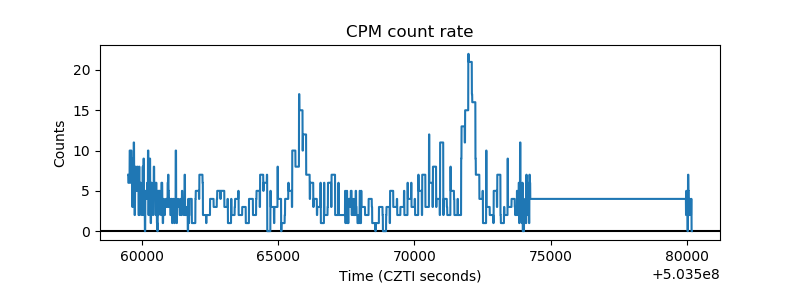 |
| CZT Counter | 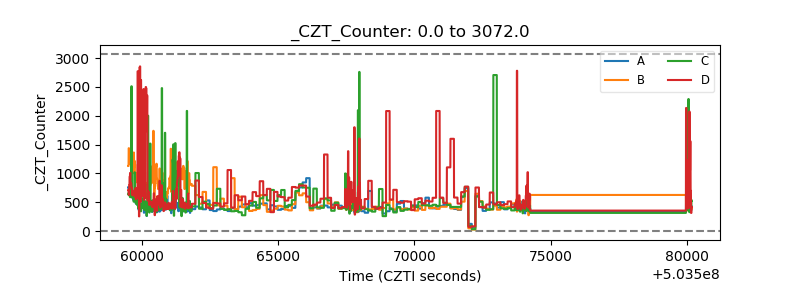 |
| +2.5 Volts monitor |  |
| +5 Volts monitor |  |
| _ROLL_ROT | 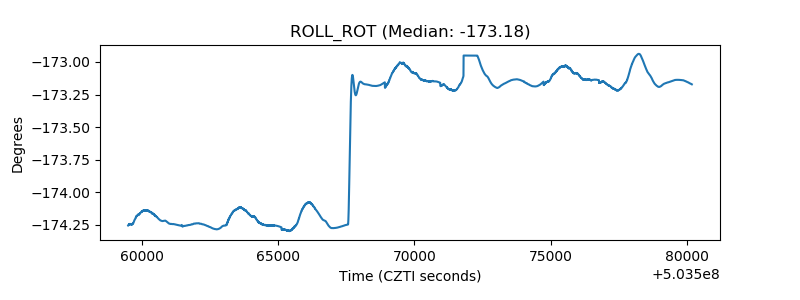 |
| _Roll_DEC | 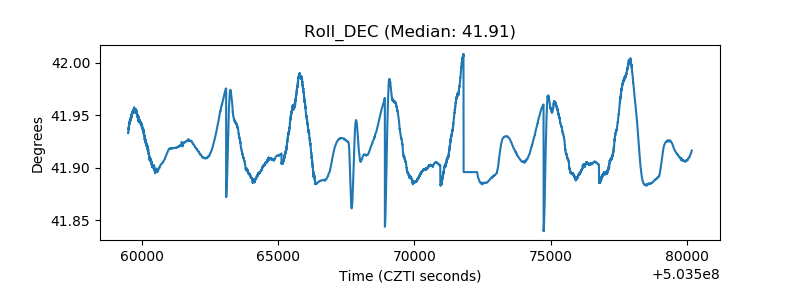 |
| _Roll_RA | 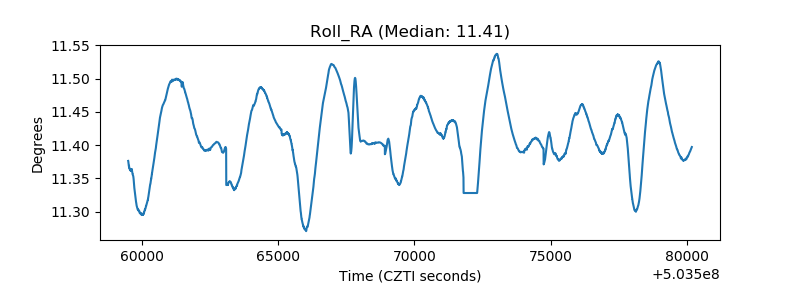 |
| Veto Counter | 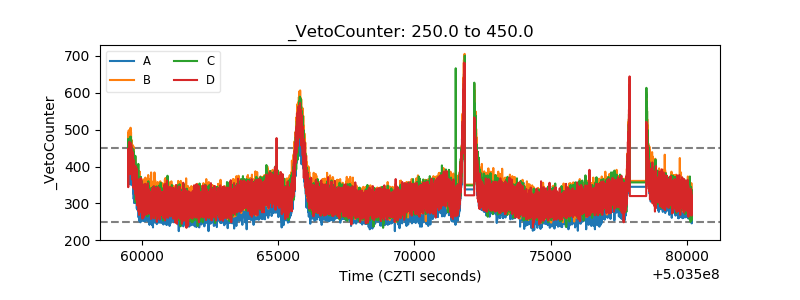 |