| Param | Original file | Final file |
|---|---|---|
| Filename | modeM0/AS1A14_009T01_9000006534_55282cztM0_level2.fits | modeM0/AS1A14_009T01_9000006534_55282cztM0_level2_quad_clean.evt |
| Size (bytes) | 370,126,080 | 96,160,320 |
| Size | 353.0 MB | 91.7 MB |
| Events in quadrant A | 3,157,130 | 622,299 |
| Events in quadrant B | 2,821,872 | 669,653 |
| Events in quadrant C | 3,330,017 | 594,255 |
| Events in quadrant D | 3,872,292 | 560,225 |
| Mode SS | |||
|---|---|---|---|
| Quadrant | BADHDUFLAG | Total packets | Discarded packets |
| A | 0 | 136 | 0 |
| B | 0 | 136 | 0 |
| C | 0 | 136 | 0 |
| D | 0 | 136 | 0 |
| Mode M0 | |||
|---|---|---|---|
| Quadrant | BADHDUFLAG | Total packets | Discarded packets |
| A | 0 | 14302 | 1 |
| B | 0 | 13646 | 1 |
| C | 0 | 14966 | 1 |
| D | 0 | 16091 | 7 |
| Mode M9 | |||
|---|---|---|---|
| Quadrant | BADHDUFLAG | Total packets | Discarded packets |
| A | 0 | 9 | 0 |
| B | 0 | 9 | 0 |
| C | 0 | 9 | 0 |
| D | 0 | 9 | 0 |
| Quadrant | Total seconds | Saturated seconds | Saturation percentage |
|---|---|---|---|
| A | 6669 | 95 | 1.424501% |
| B | 6670 | 51 | 0.764618% |
| C | 6670 | 106 | 1.589205% |
| D | 6669 | 164 | 2.459139% |
Noise dominated data is calculated using 1-second bins in cleaned event files. If a bin has >2000 counts, and if more than 50% of those come from <1% of pixels, then it is considered to be noise-dominated and hence unusable.
| Quadrant | # 1 sec bins | Bins with >0 counts | Bins with >2000 counts | High rate bins dominated by noise | Noise dominated (total time) | Noise dominated (detector-on time) | Marked lightcurve |
|---|---|---|---|---|---|---|---|
| A | 7579 | 6669 | 38 | 38 | 0.50% | 0.57% | 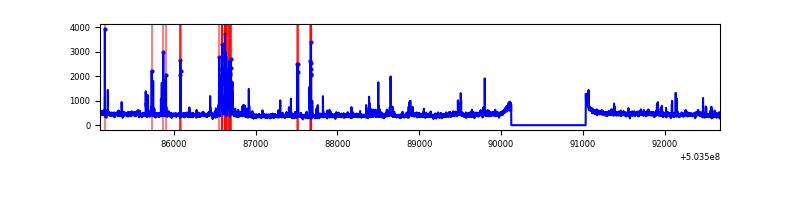 |
| B | 7580 | 6671 | 1 | 1 | 0.01% | 0.01% | 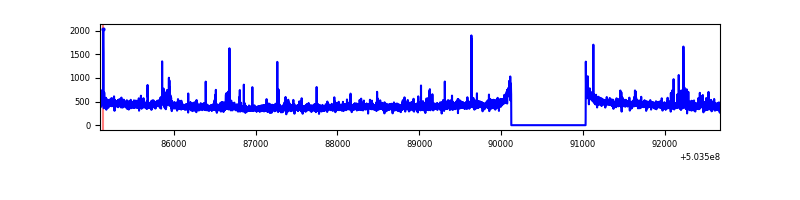 |
| C | 7580 | 6671 | 61 | 61 | 0.80% | 0.91% | 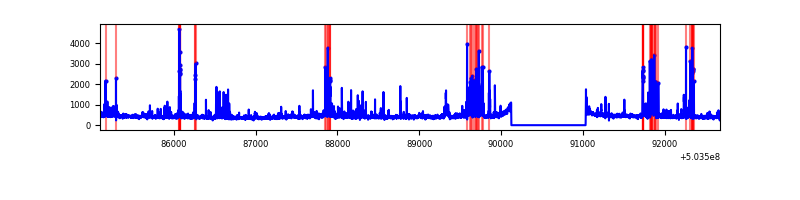 |
| D | 7579 | 6670 | 133 | 133 | 1.75% | 1.99% | 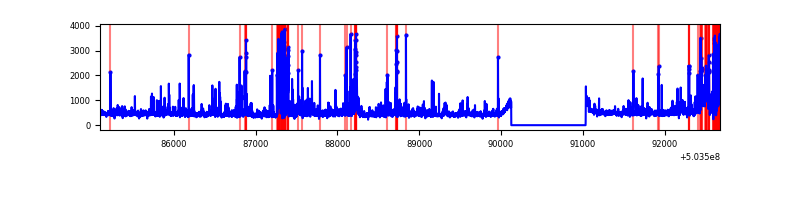 |
Top three noisy pixels from each quadrant. If the there are fewer than three noisy pixels in the level2.evt file, extra rows are filled as -1
| Pixel properties | Quadrant properties | ||||||
|---|---|---|---|---|---|---|---|
| Quadrant | DetID | PixID | Counts | Sigma | Mean | Median | Sigma |
| A | 0 | 8 | 211648 | 1230.31 | 699 | 680 | 171.5 |
| A | 7 | 7 | 106376 | 616.39 | 699 | 680 | 171.5 |
| A | 4 | 3 | 50192 | 288.74 | 699 | 680 | 171.5 |
| B | 0 | 182 | 49238 | 327.47 | 688 | 664 | 148.3 |
| B | 12 | 111 | 17893 | 116.15 | 688 | 664 | 148.3 |
| B | 11 | 111 | 16844 | 109.08 | 688 | 664 | 148.3 |
| C | 13 | 3 | 217070 | 1162.52 | 676 | 668 | 186.1 |
| C | 10 | 22 | 179997 | 963.36 | 676 | 668 | 186.1 |
| C | 12 | 2 | 68566 | 364.75 | 676 | 668 | 186.1 |
| D | 11 | 176 | 333429 | 1747.17 | 678 | 647 | 190.5 |
| D | 6 | 42 | 220023 | 1151.77 | 678 | 647 | 190.5 |
| D | 11 | 129 | 199524 | 1044.15 | 678 | 647 | 190.5 |
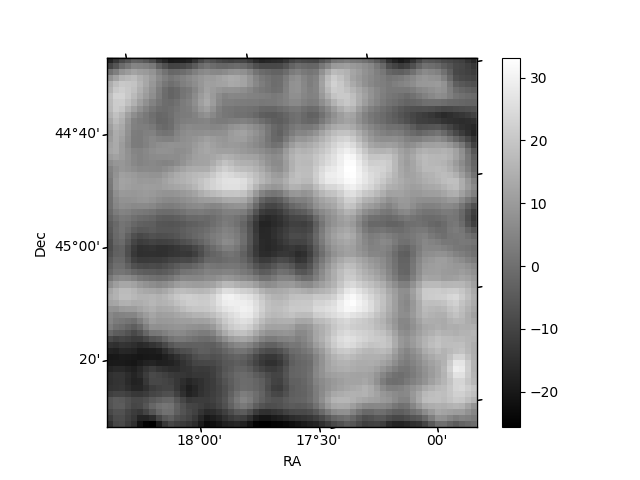
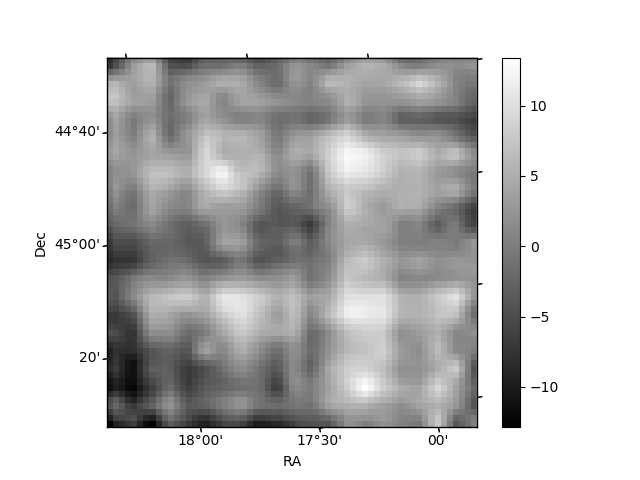
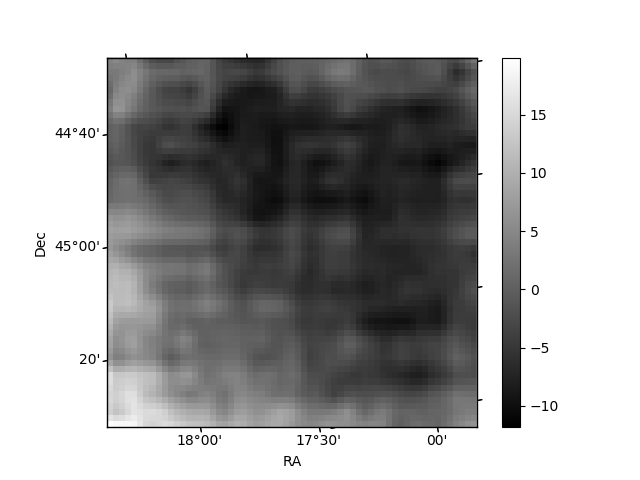
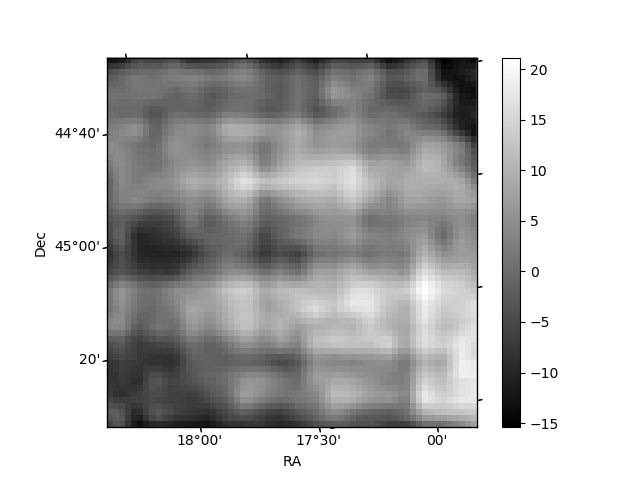
Histogram calculated using DETX and DETY for each event in the final _common_clean file
| Quadrant A | 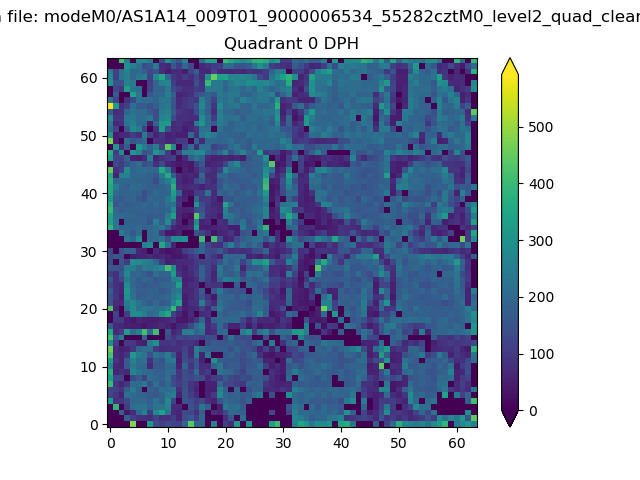 |
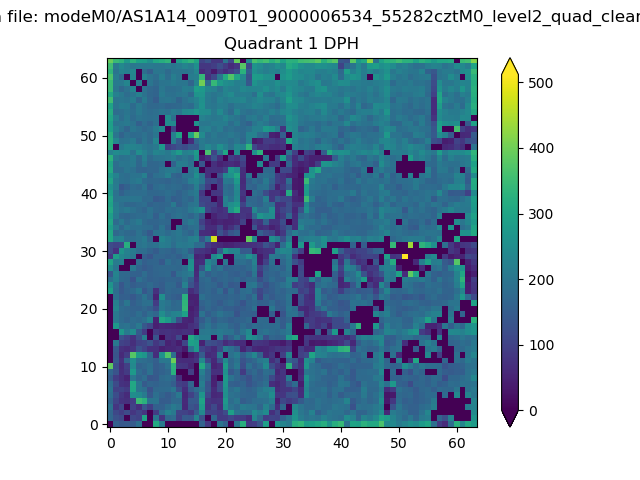 |
Quadrant B |
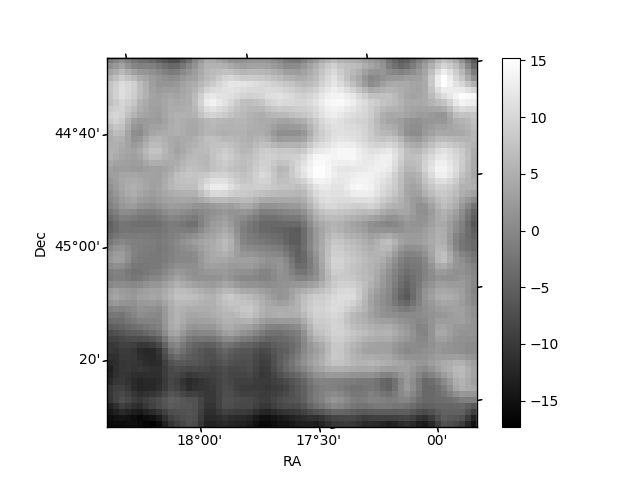
|---|---|---|---|
| Quadrant D | 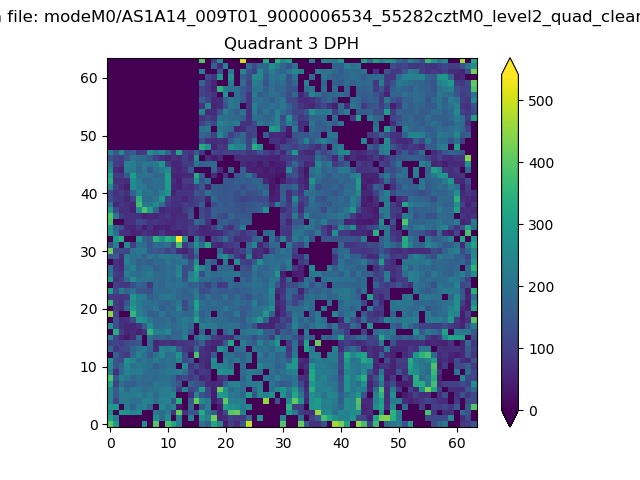 |
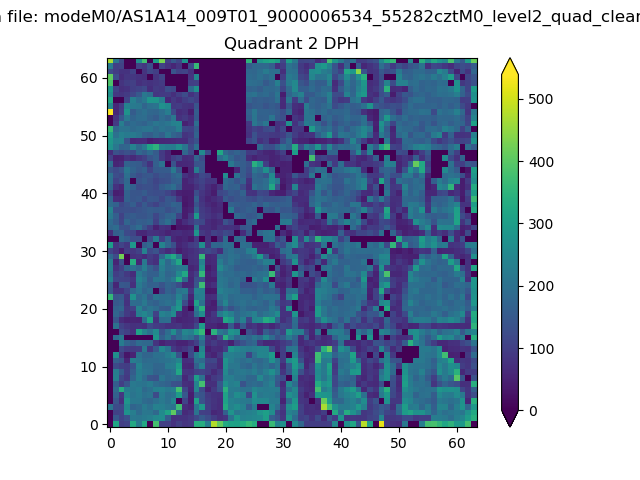 |
Quadrant C |
| Plot type | Count rate plots | Images |
|---|---|---|
| Comparison with Poisson distribution Blue bars denote a histogram of data divided into 1 sec bins. Red curve is a Poisson curve with rate = median count rate of data. |
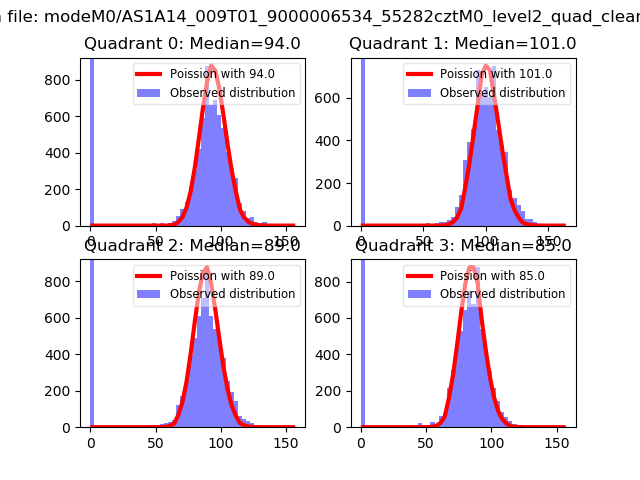 |
 |
| Quadrant-wise count rates Data is divided into 100 sec bins |
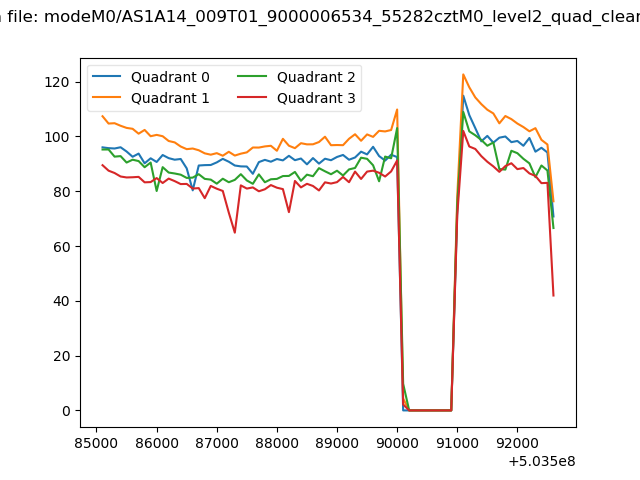 |
|
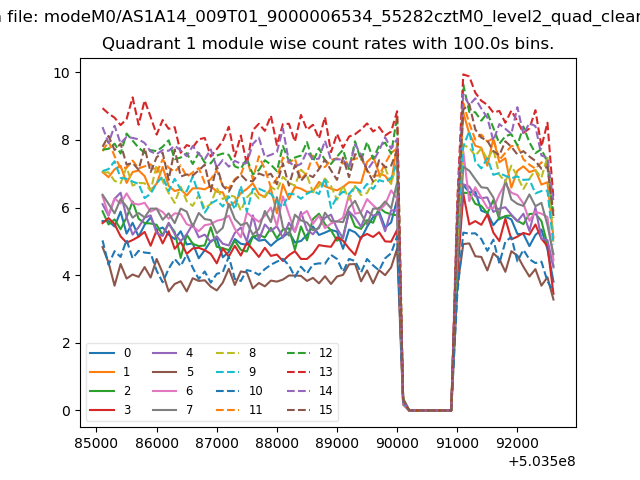
| Module-wise count rates for Quadrant A Data is divided into 100 sec bins |
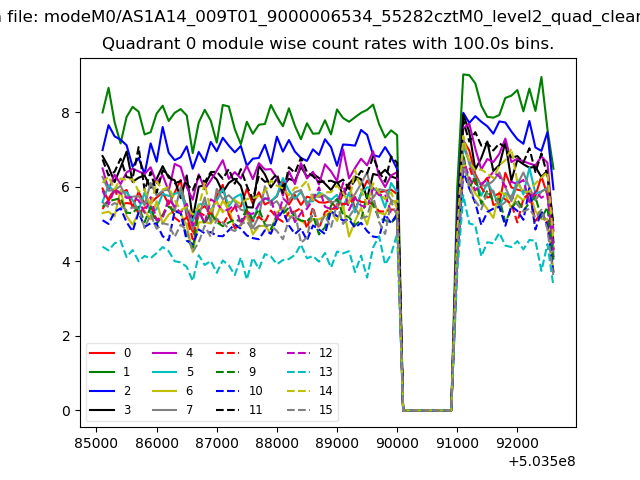 |
 |
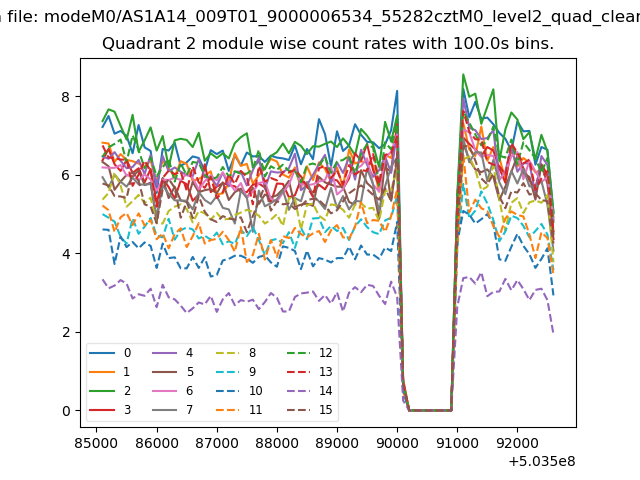
| Module-wise count rates for Quadrant B Data is divided into 100 sec bins |
 |
 |
| Module-wise count rates for Quadrant C Data is divided into 100 sec bins |
 |
 |
| Module-wise count rates for Quadrant D Data is divided into 100 sec bins |
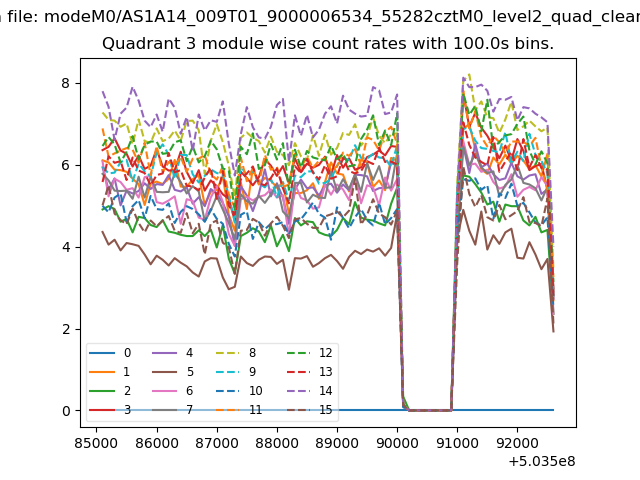 |
 |
| Parameter | Plot |
|---|---|
| CZT HV Monitor | 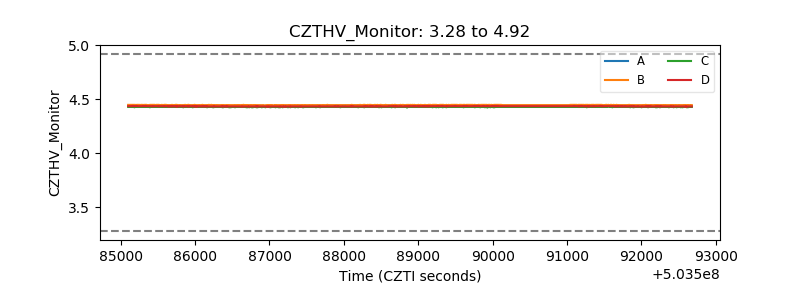 |
| D_VDD | 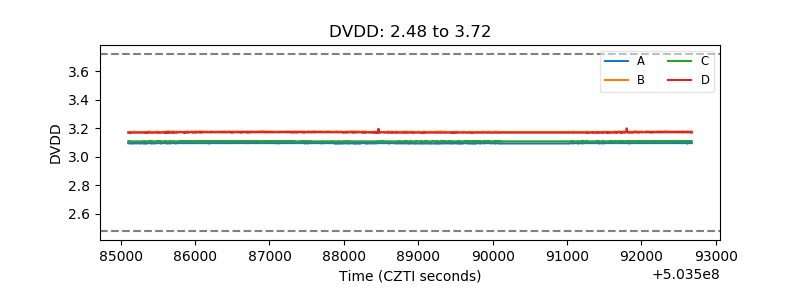 |
| Temperature 1 | 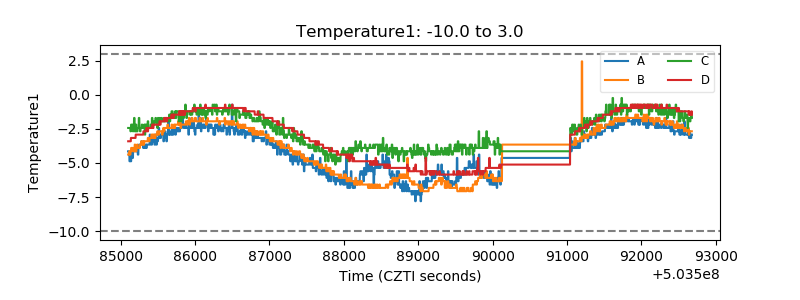 |
| Veto HV Monitor | 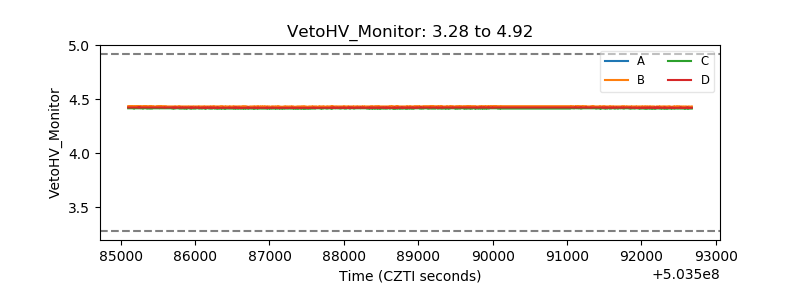 |
| Veto LLD | 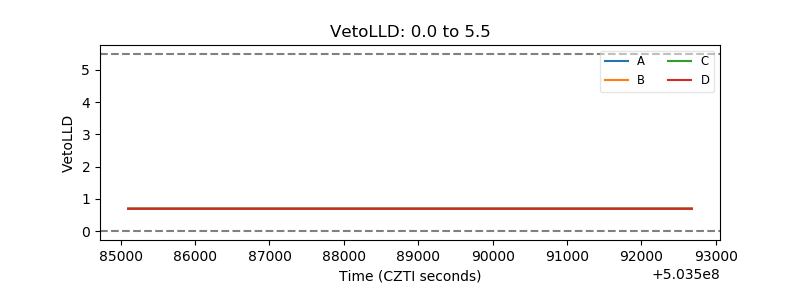 |
| Alpha Counter | 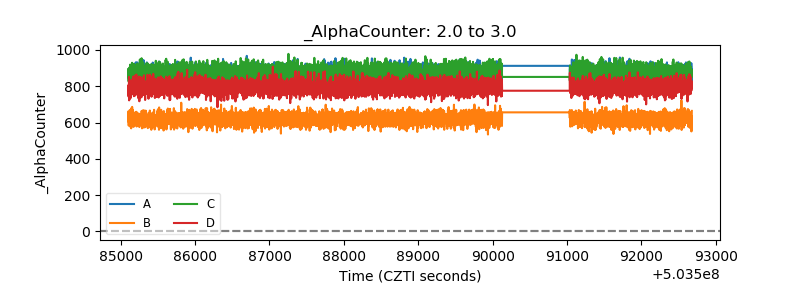 |
| _CPM_Rate | 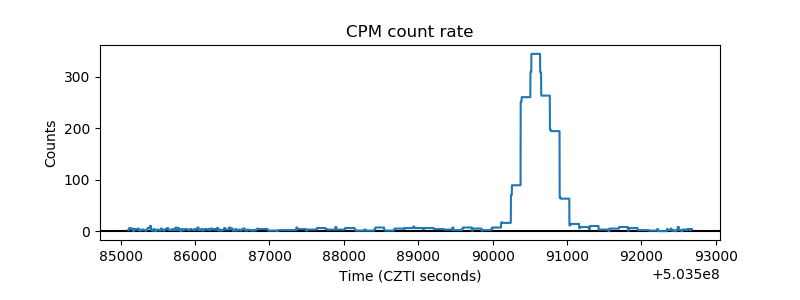 |
| CZT Counter | 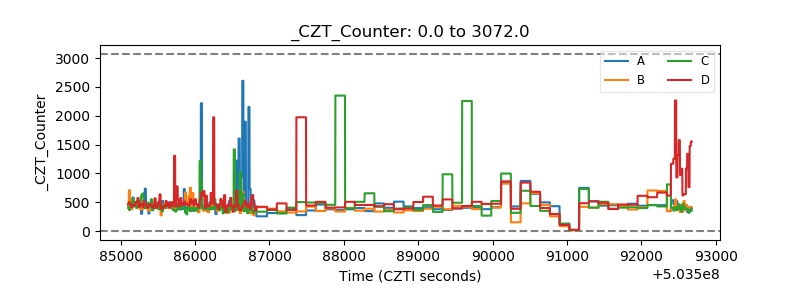 |
| +2.5 Volts monitor |  |
| +5 Volts monitor |  |
| _ROLL_ROT | 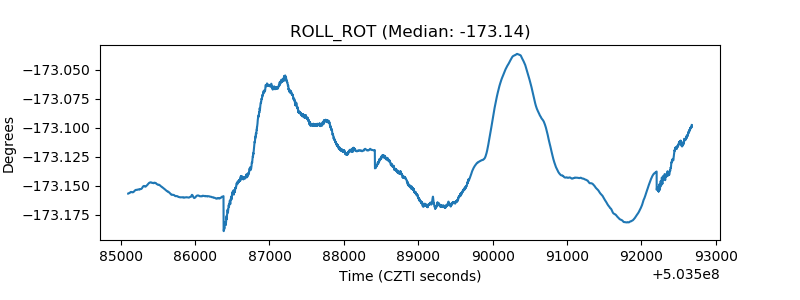 |
| _Roll_DEC | 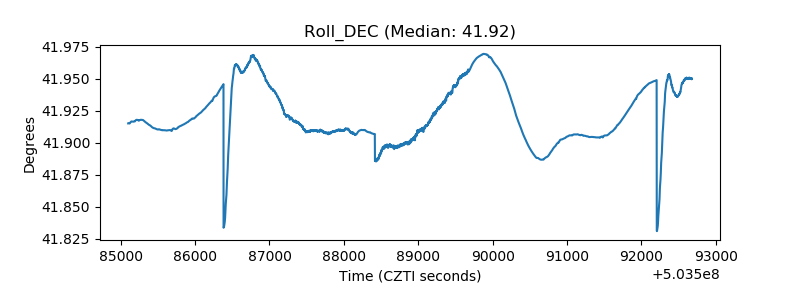 |
| _Roll_RA | 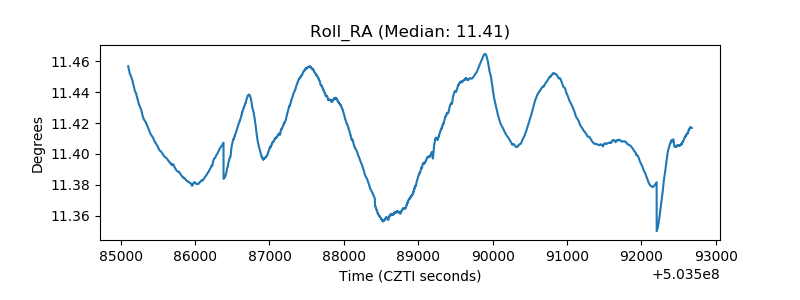 |
| Veto Counter | 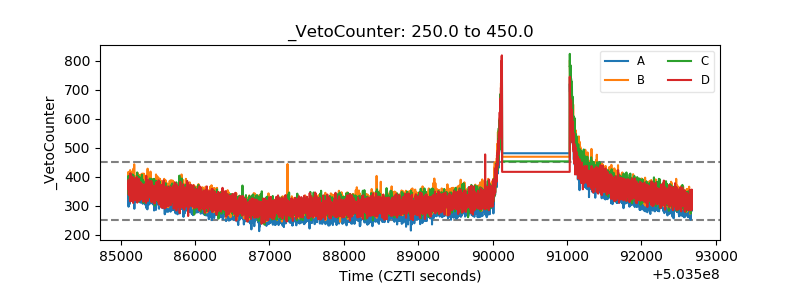 |