| Param | Original file | Final file |
|---|---|---|
| Filename | modeM0/AS1A14_009T01_9000006534_55284cztM0_level2.fits | modeM0/AS1A14_009T01_9000006534_55284cztM0_level2_quad_clean.evt |
| Size (bytes) | 396,138,240 | 97,957,440 |
| Size | 377.8 MB | 93.4 MB |
| Events in quadrant A | 2,970,315 | 641,286 |
| Events in quadrant B | 2,957,563 | 685,902 |
| Events in quadrant C | 3,725,147 | 608,475 |
| Events in quadrant D | 4,491,653 | 565,941 |
| Mode SS | |||
|---|---|---|---|
| Quadrant | BADHDUFLAG | Total packets | Discarded packets |
| A | 0 | 134 | 0 |
| B | 0 | 134 | 0 |
| C | 0 | 134 | 0 |
| D | 0 | 134 | 0 |
| Mode M0 | |||
|---|---|---|---|
| Quadrant | BADHDUFLAG | Total packets | Discarded packets |
| A | 0 | 13710 | 2 |
| B | 0 | 13916 | 2 |
| C | 0 | 16105 | 2 |
| D | 0 | 17893 | 2 |
| Mode M9 | |||
|---|---|---|---|
| Quadrant | BADHDUFLAG | Total packets | Discarded packets |
| A | 0 | 12 | 0 |
| B | 0 | 12 | 0 |
| C | 0 | 13 | 0 |
| D | 0 | 13 | 0 |
| Quadrant | Total seconds | Saturated seconds | Saturation percentage |
|---|---|---|---|
| A | 6667 | 55 | 0.824959% |
| B | 6667 | 78 | 1.169942% |
| C | 6667 | 153 | 2.294885% |
| D | 6667 | 303 | 4.544773% |
Noise dominated data is calculated using 1-second bins in cleaned event files. If a bin has >2000 counts, and if more than 50% of those come from <1% of pixels, then it is considered to be noise-dominated and hence unusable.
| Quadrant | # 1 sec bins | Bins with >0 counts | Bins with >2000 counts | High rate bins dominated by noise | Noise dominated (total time) | Noise dominated (detector-on time) | Marked lightcurve |
|---|---|---|---|---|---|---|---|
| A | 7722 | 6668 | 0 | 0 | 0.00% | 0.00% | 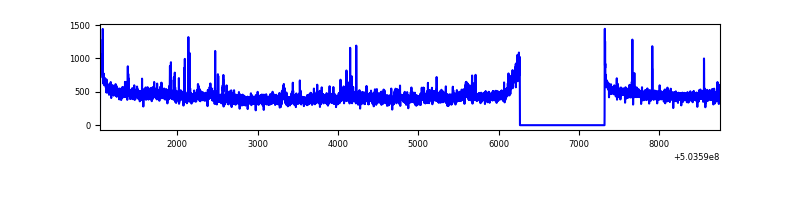 |
| B | 7722 | 6668 | 4 | 4 | 0.05% | 0.06% | 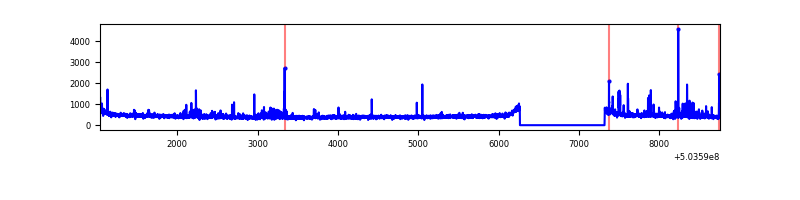 |
| C | 7722 | 6668 | 94 | 94 | 1.22% | 1.41% | 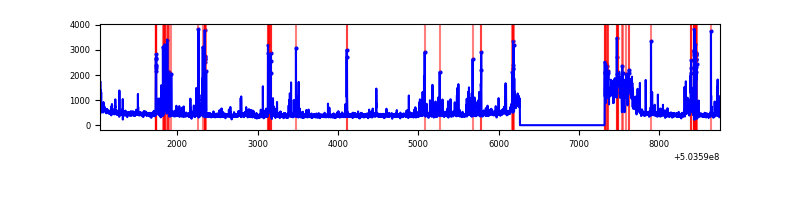 |
| D | 7722 | 6668 | 258 | 258 | 3.34% | 3.87% | 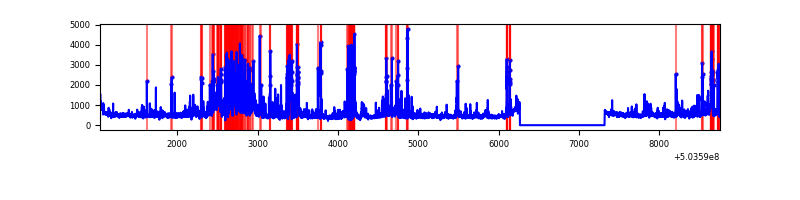 |
Top three noisy pixels from each quadrant. If the there are fewer than three noisy pixels in the level2.evt file, extra rows are filled as -1
| Pixel properties | Quadrant properties | ||||||
|---|---|---|---|---|---|---|---|
| Quadrant | DetID | PixID | Counts | Sigma | Mean | Median | Sigma |
| A | 7 | 243 | 94681 | 531.53 | 714 | 694 | 176.8 |
| A | 4 | 3 | 40472 | 224.96 | 714 | 694 | 176.8 |
| A | 7 | 7 | 31836 | 176.12 | 714 | 694 | 176.8 |
| B | 0 | 199 | 70348 | 461.14 | 702 | 676 | 151.1 |
| B | 0 | 182 | 37345 | 242.7 | 702 | 676 | 151.1 |
| B | 10 | 247 | 24740 | 159.27 | 702 | 676 | 151.1 |
| C | 13 | 3 | 429141 | 2261.27 | 690 | 682 | 189.5 |
| C | 3 | 248 | 366702 | 1931.74 | 690 | 682 | 189.5 |
| C | 10 | 22 | 82207 | 430.26 | 690 | 682 | 189.5 |
| D | 11 | 176 | 654604 | 3408.06 | 688 | 658 | 191.9 |
| D | 11 | 129 | 358926 | 1867.12 | 688 | 658 | 191.9 |
| D | 6 | 42 | 328697 | 1709.58 | 688 | 658 | 191.9 |
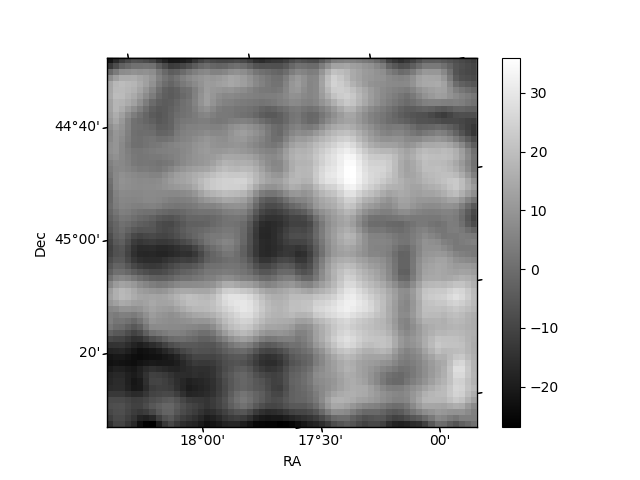
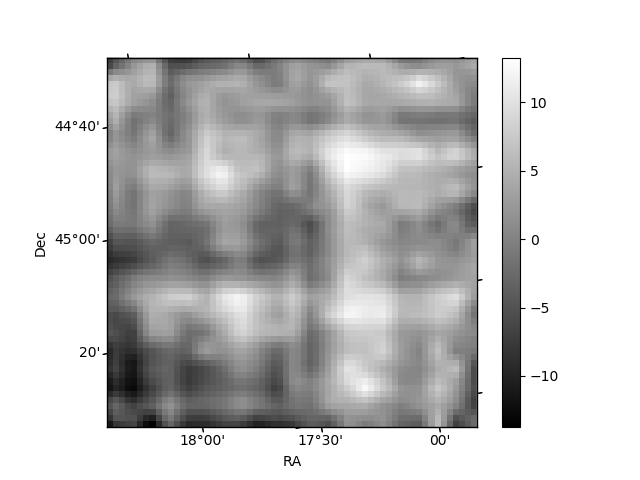
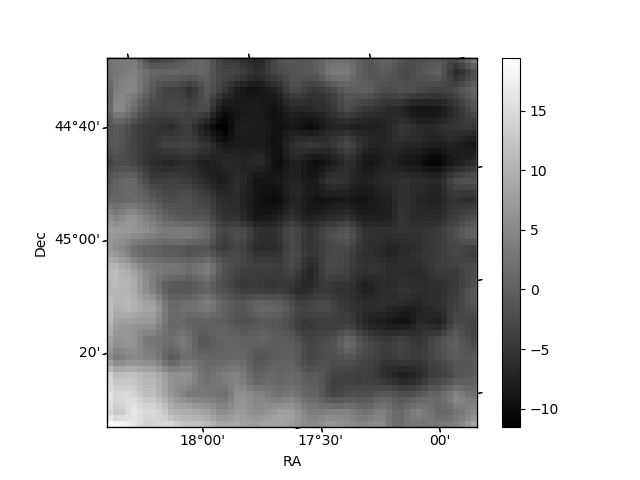
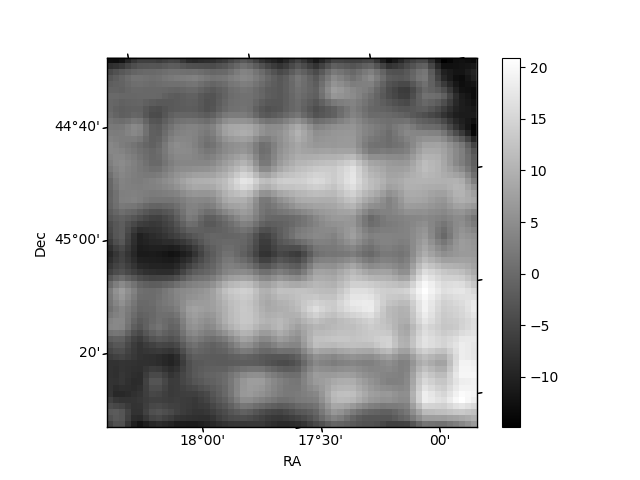
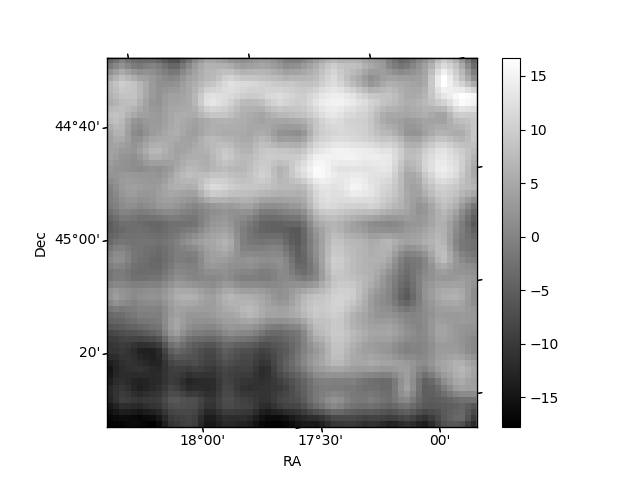
Histogram calculated using DETX and DETY for each event in the final _common_clean file
| Quadrant A | 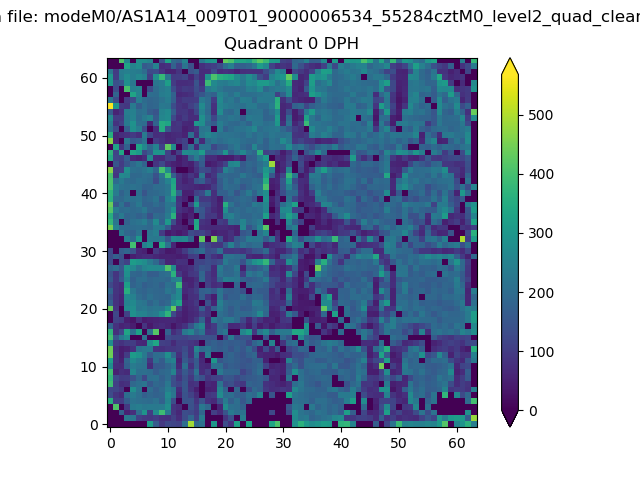 |
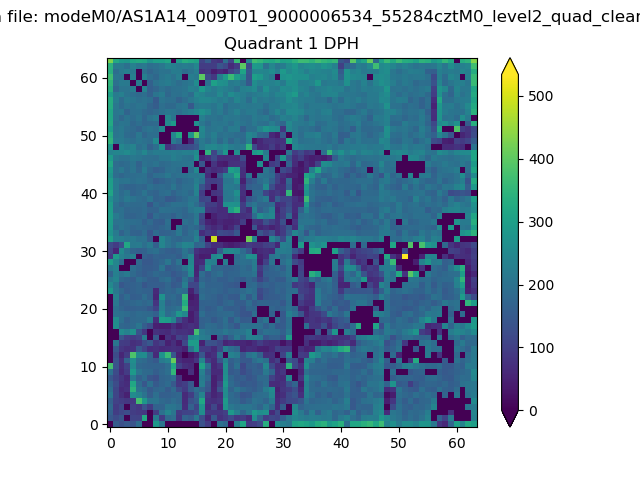 |
Quadrant B |
|---|---|---|---|
| Quadrant D | 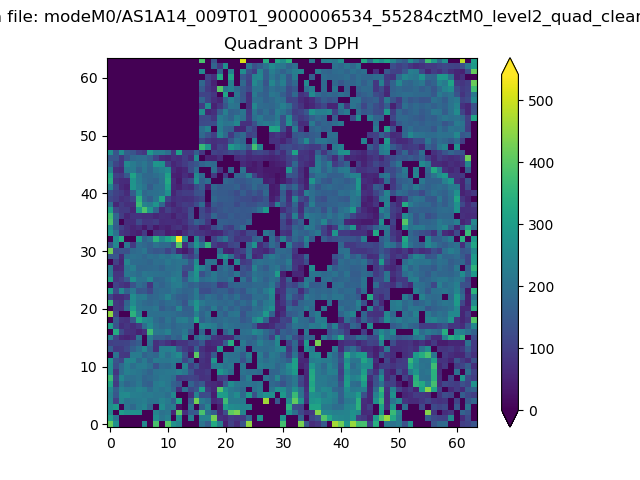 |
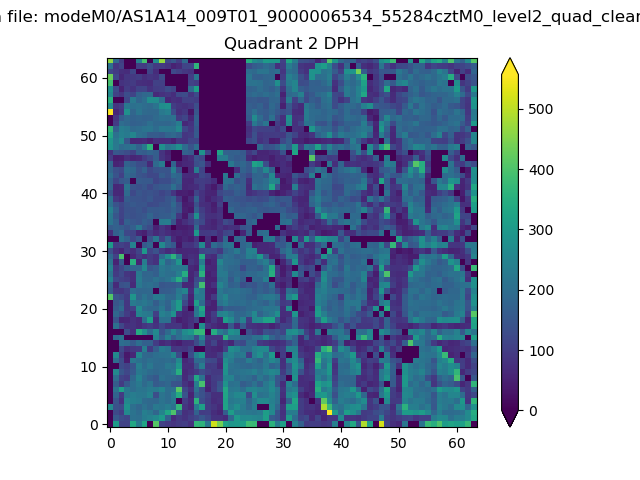 |
Quadrant C |
| Plot type | Count rate plots | Images |
|---|---|---|
| Comparison with Poisson distribution Blue bars denote a histogram of data divided into 1 sec bins. Red curve is a Poisson curve with rate = median count rate of data. |
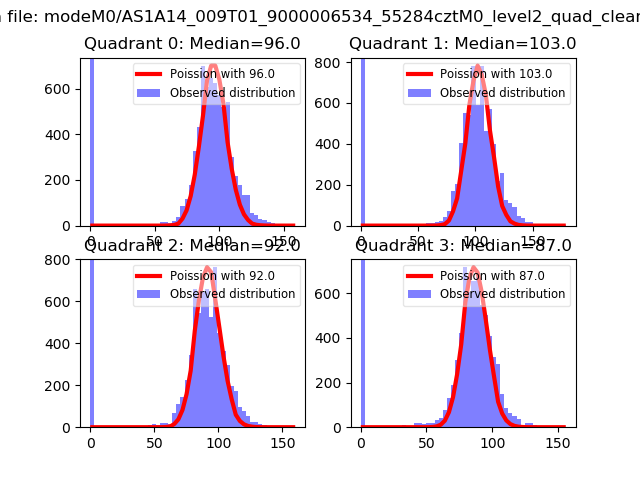 |
 |
| Quadrant-wise count rates Data is divided into 100 sec bins |
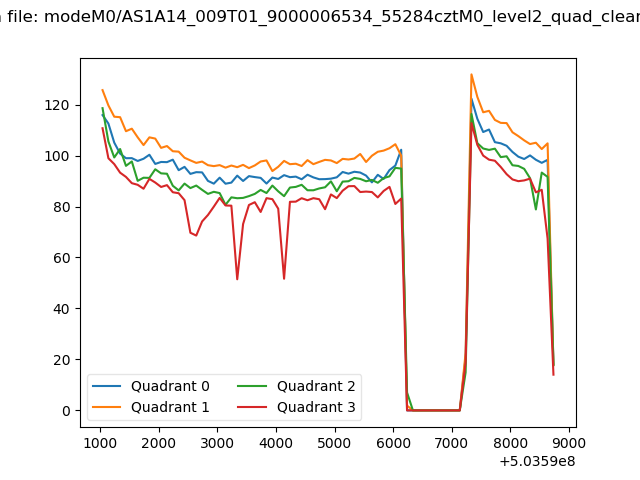 |
|
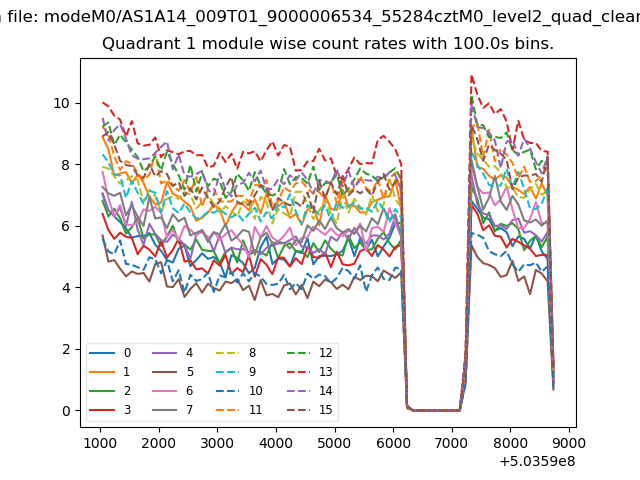
| Module-wise count rates for Quadrant A Data is divided into 100 sec bins |
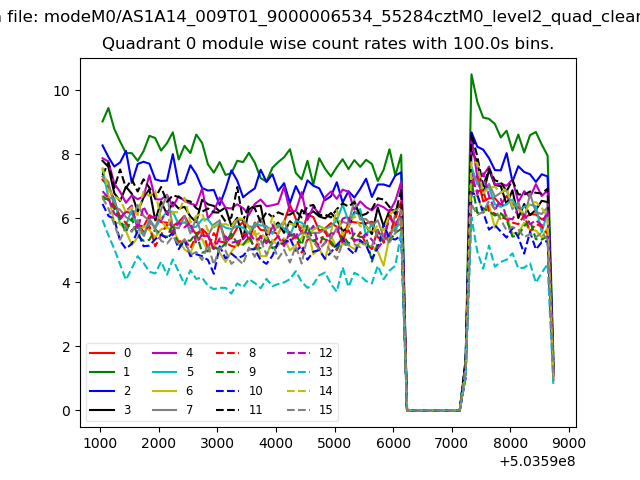 |
 |
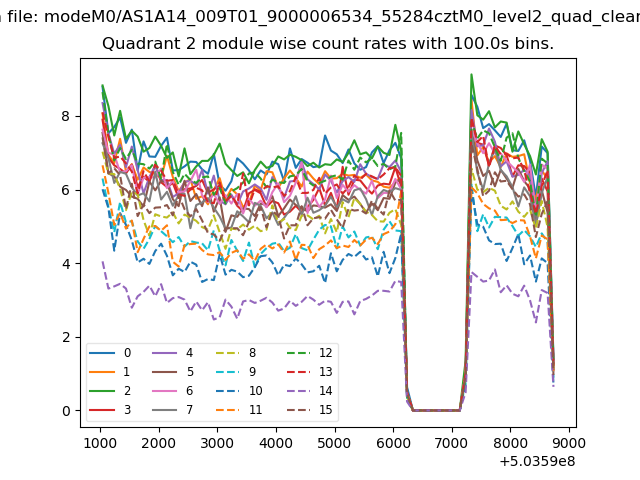
| Module-wise count rates for Quadrant B Data is divided into 100 sec bins |
 |
 |
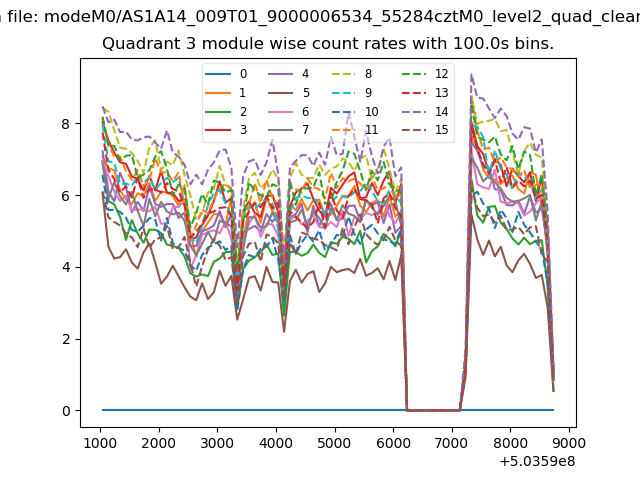
| Module-wise count rates for Quadrant C Data is divided into 100 sec bins |
 |
 |
| Module-wise count rates for Quadrant D Data is divided into 100 sec bins |
 |
 |
| Parameter | Plot |
|---|---|
| CZT HV Monitor | 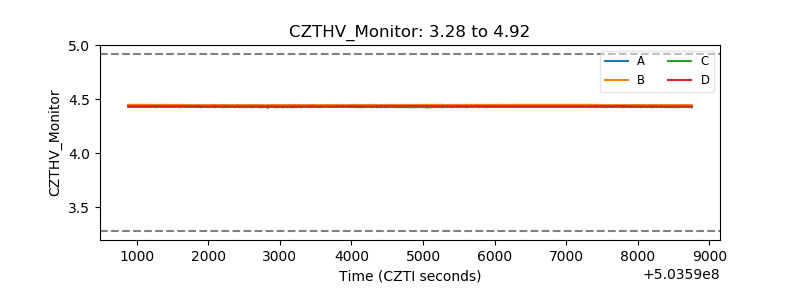 |
| D_VDD | 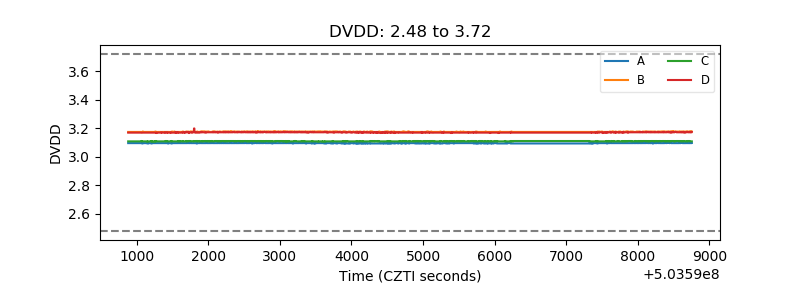 |
| Temperature 1 | 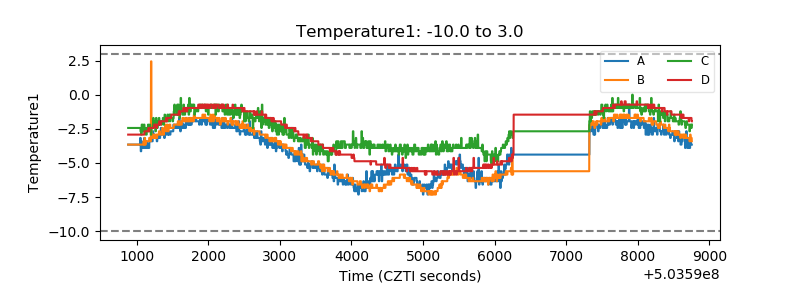 |
| Veto HV Monitor | 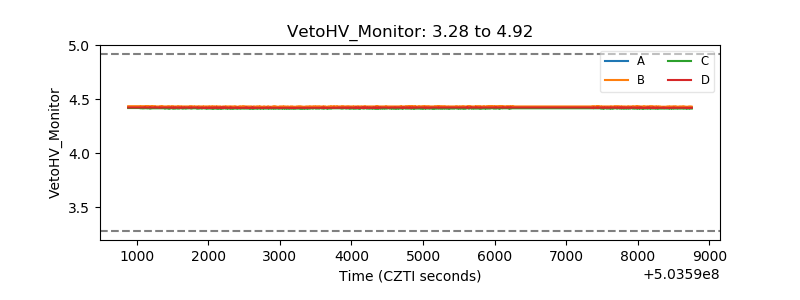 |
| Veto LLD | 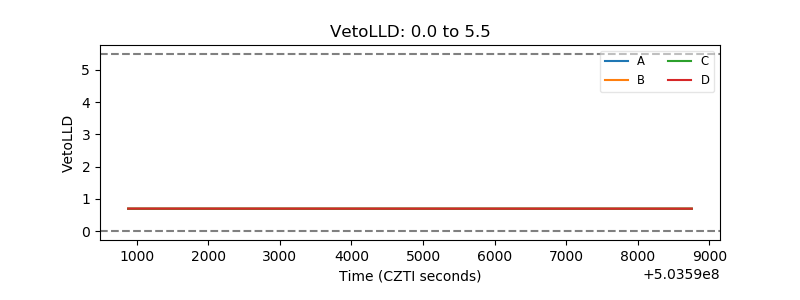 |
| Alpha Counter | 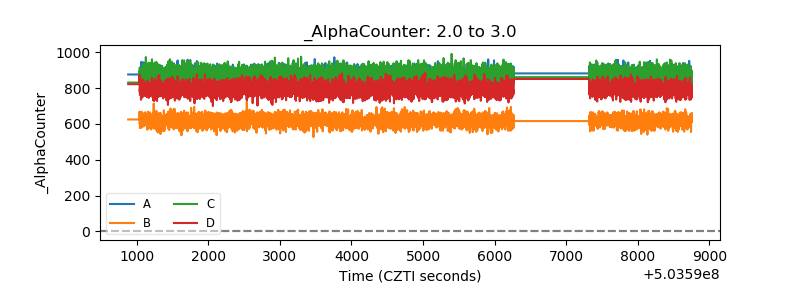 |
| _CPM_Rate | 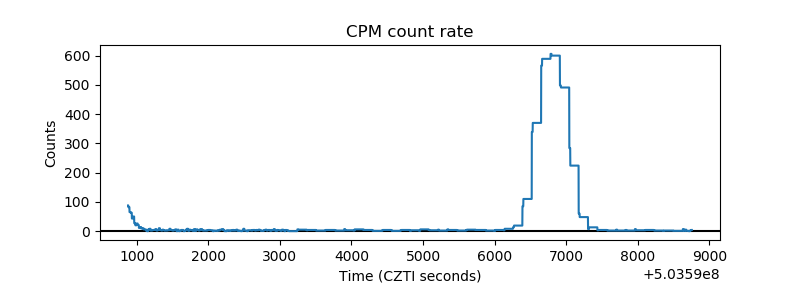 |
| CZT Counter | 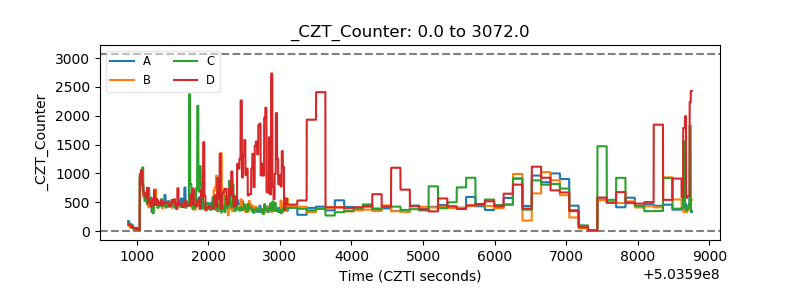 |
| +2.5 Volts monitor |  |
| +5 Volts monitor |  |
| _ROLL_ROT | 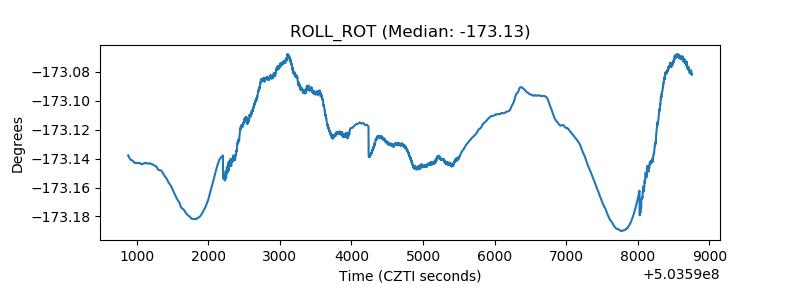 |
| _Roll_DEC | 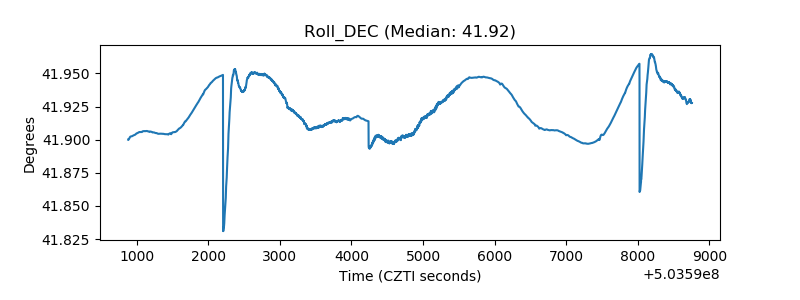 |
| _Roll_RA | 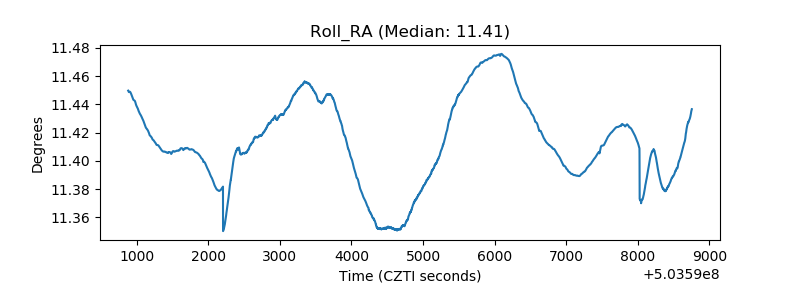 |
| Veto Counter | 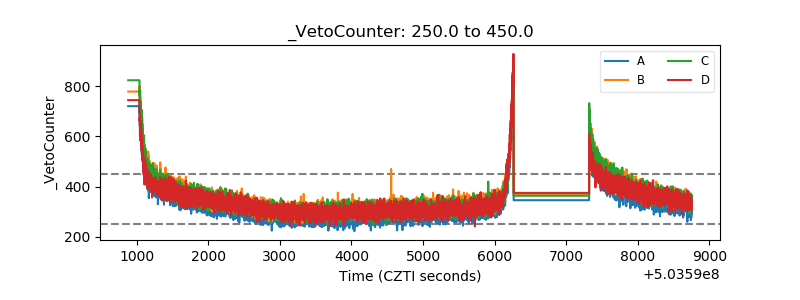 |