| Param | Original file | Final file |
|---|---|---|
| Filename | modeM0/AS1A14_009T01_9000006534_55287cztM0_level2.fits | modeM0/AS1A14_009T01_9000006534_55287cztM0_level2_quad_clean.evt |
| Size (bytes) | 387,912,960 | 95,529,600 |
| Size | 369.9 MB | 91.1 MB |
| Events in quadrant A | 2,950,849 | 625,032 |
| Events in quadrant B | 3,466,252 | 660,648 |
| Events in quadrant C | 3,429,068 | 595,479 |
| Events in quadrant D | 4,008,944 | 559,348 |
| Mode SS | |||
|---|---|---|---|
| Quadrant | BADHDUFLAG | Total packets | Discarded packets |
| A | 0 | 136 | 0 |
| B | 0 | 136 | 0 |
| C | 0 | 136 | 0 |
| D | 0 | 136 | 0 |
| Mode M0 | |||
|---|---|---|---|
| Quadrant | BADHDUFLAG | Total packets | Discarded packets |
| A | 0 | 13720 | 3 |
| B | 0 | 15144 | 4 |
| C | 0 | 15016 | 3 |
| D | 0 | 16554 | 3 |
| Mode M9 | |||
|---|---|---|---|
| Quadrant | BADHDUFLAG | Total packets | Discarded packets |
| A | 0 | 22 | 0 |
| B | 0 | 22 | 0 |
| C | 0 | 22 | 0 |
| D | 0 | 22 | 0 |
| Quadrant | Total seconds | Saturated seconds | Saturation percentage |
|---|---|---|---|
| A | 6474 | 51 | 0.787766% |
| B | 6473 | 213 | 3.290592% |
| C | 6473 | 150 | 2.317318% |
| D | 6473 | 190 | 2.935270% |
Noise dominated data is calculated using 1-second bins in cleaned event files. If a bin has >2000 counts, and if more than 50% of those come from <1% of pixels, then it is considered to be noise-dominated and hence unusable.
| Quadrant | # 1 sec bins | Bins with >0 counts | Bins with >2000 counts | High rate bins dominated by noise | Noise dominated (total time) | Noise dominated (detector-on time) | Marked lightcurve |
|---|---|---|---|---|---|---|---|
| A | 8774 | 6476 | 29 | 29 | 0.33% | 0.45% | 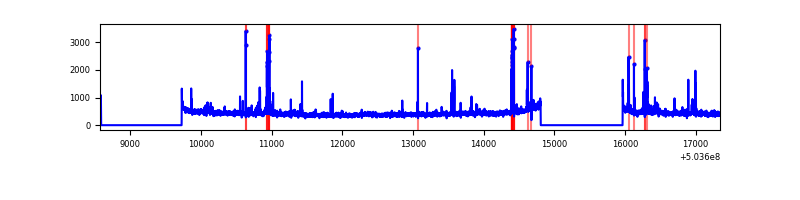 |
| B | 8773 | 6475 | 120 | 120 | 1.37% | 1.85% | 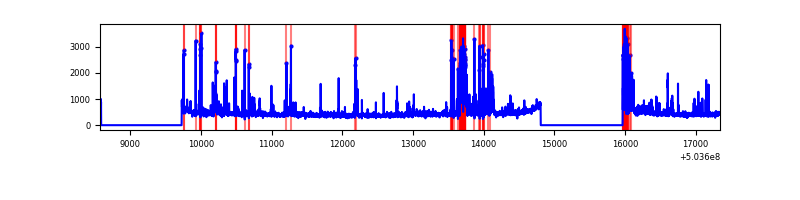 |
| C | 8773 | 6475 | 120 | 120 | 1.37% | 1.85% | 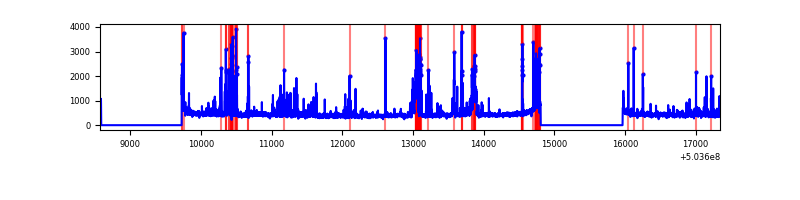 |
| D | 8773 | 6475 | 155 | 155 | 1.77% | 2.39% | 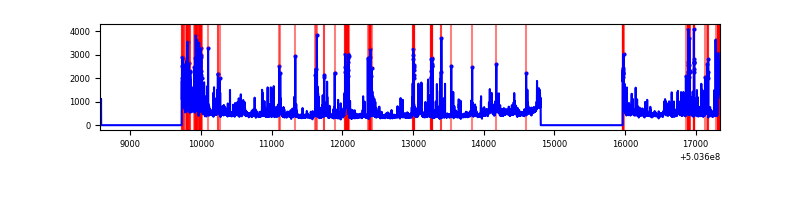 |
Top three noisy pixels from each quadrant. If the there are fewer than three noisy pixels in the level2.evt file, extra rows are filled as -1
| Pixel properties | Quadrant properties | ||||||
|---|---|---|---|---|---|---|---|
| Quadrant | DetID | PixID | Counts | Sigma | Mean | Median | Sigma |
| A | 0 | 8 | 116131 | 685.5 | 681 | 665 | 168.4 |
| A | 4 | 205 | 68764 | 404.29 | 681 | 665 | 168.4 |
| A | 4 | 3 | 47044 | 275.35 | 681 | 665 | 168.4 |
| B | 2 | 249 | 343000 | 2397.77 | 670 | 645 | 142.8 |
| B | 10 | 247 | 154661 | 1078.69 | 670 | 645 | 142.8 |
| B | 0 | 199 | 151156 | 1054.14 | 670 | 645 | 142.8 |
| C | 13 | 3 | 386651 | 2086.43 | 669 | 663 | 185.0 |
| C | 12 | 252 | 182926 | 985.21 | 669 | 663 | 185.0 |
| C | 12 | 249 | 113825 | 611.69 | 669 | 663 | 185.0 |
| D | 11 | 129 | 824448 | 4441.07 | 660 | 634 | 185.5 |
| D | 11 | 176 | 144463 | 775.36 | 660 | 634 | 185.5 |
| D | 2 | 31 | 71569 | 382.4 | 660 | 634 | 185.5 |
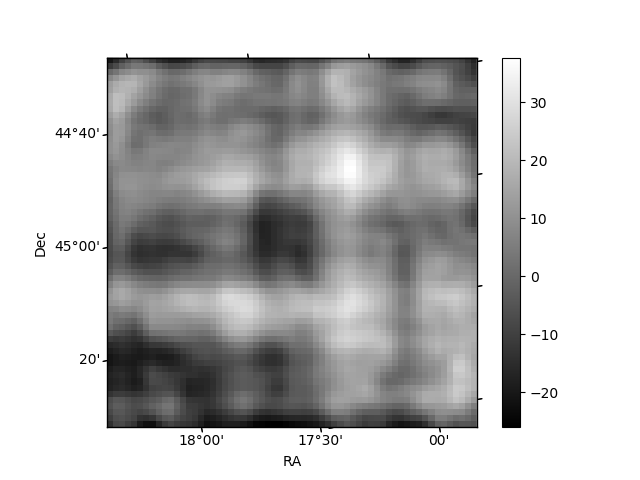
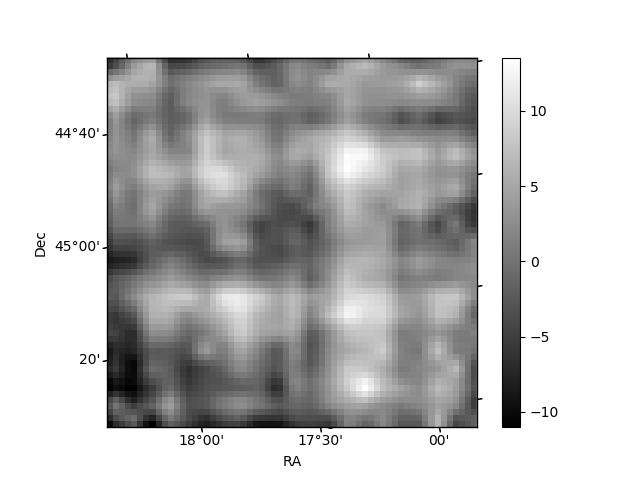
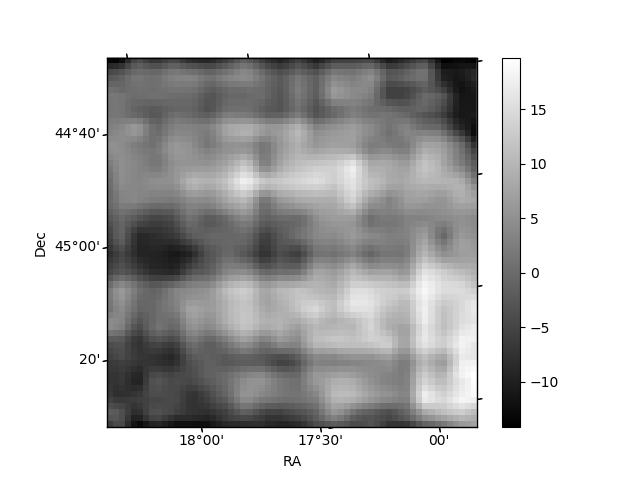
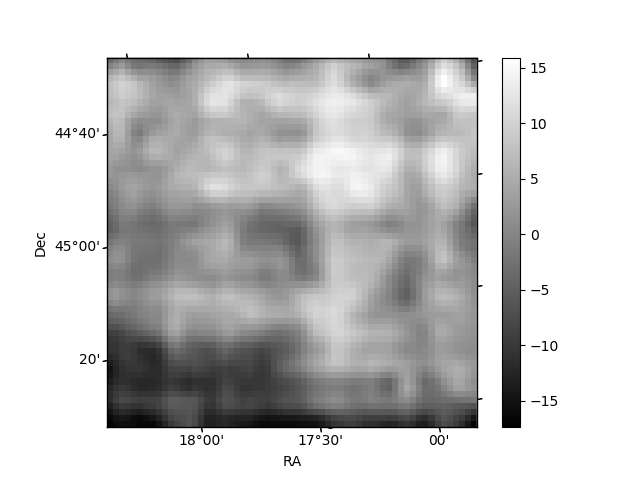
Histogram calculated using DETX and DETY for each event in the final _common_clean file
| Quadrant A | 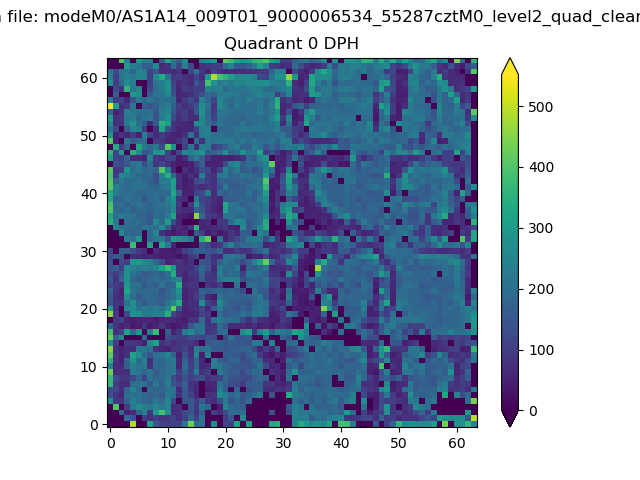 |
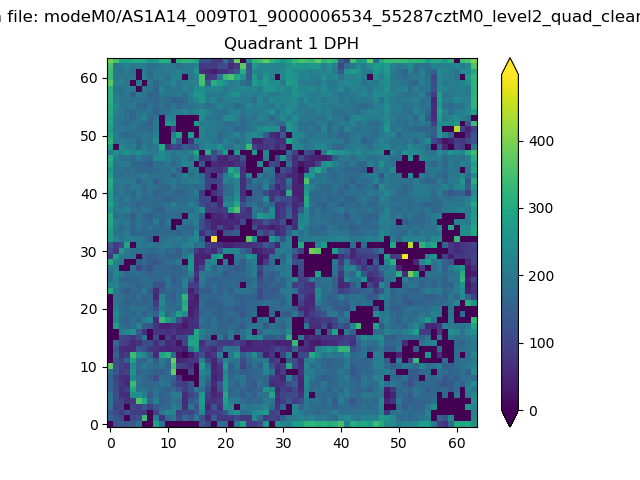 |
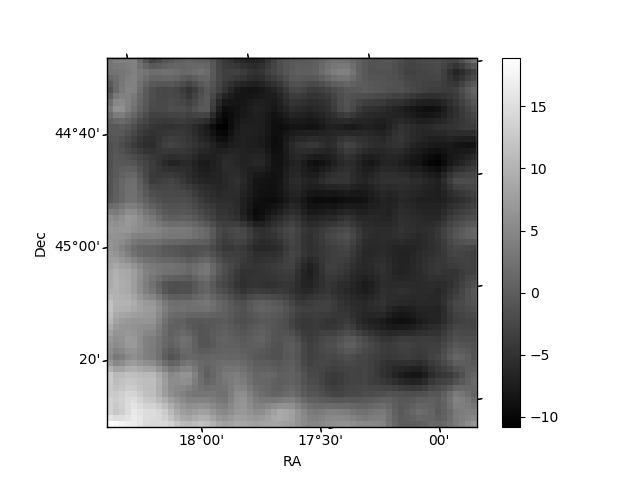
Quadrant B |
|---|---|---|---|
| Quadrant D | 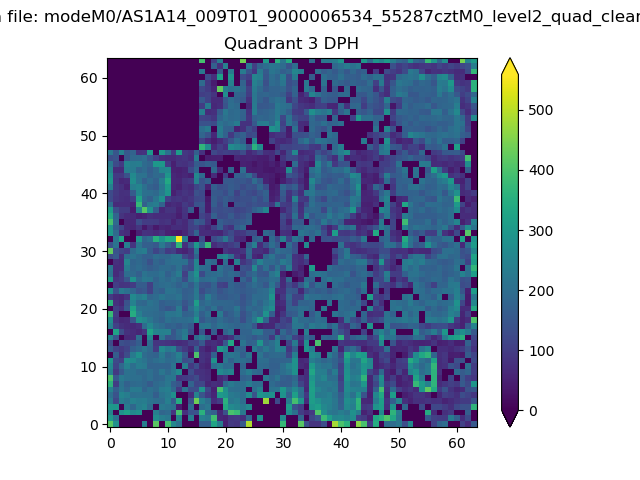 |
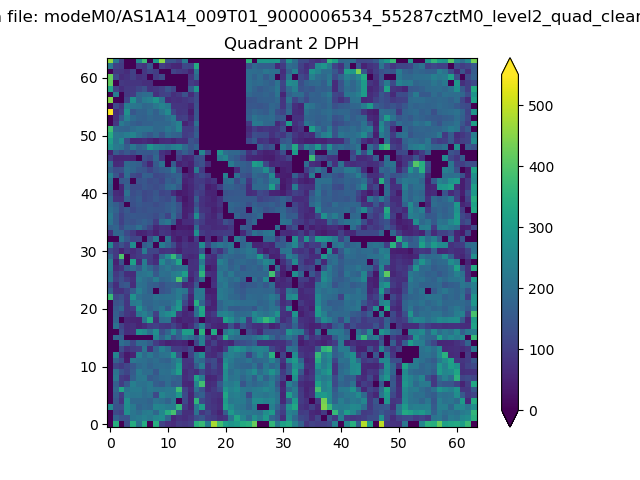 |
Quadrant C |
| Plot type | Count rate plots | Images |
|---|---|---|
| Comparison with Poisson distribution Blue bars denote a histogram of data divided into 1 sec bins. Red curve is a Poisson curve with rate = median count rate of data. |
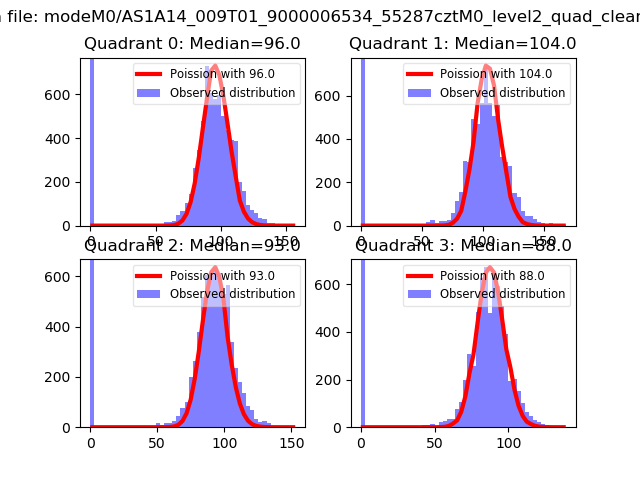 |
 |
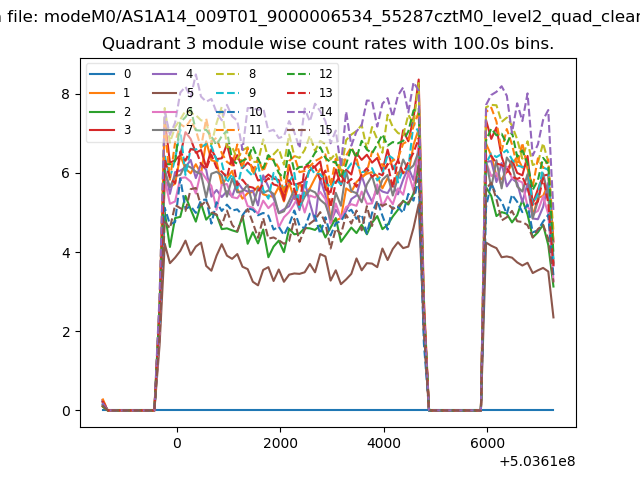
| Quadrant-wise count rates Data is divided into 100 sec bins |
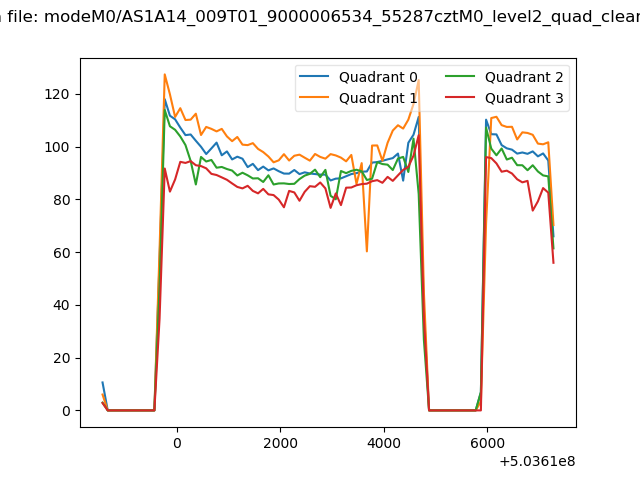 |
|
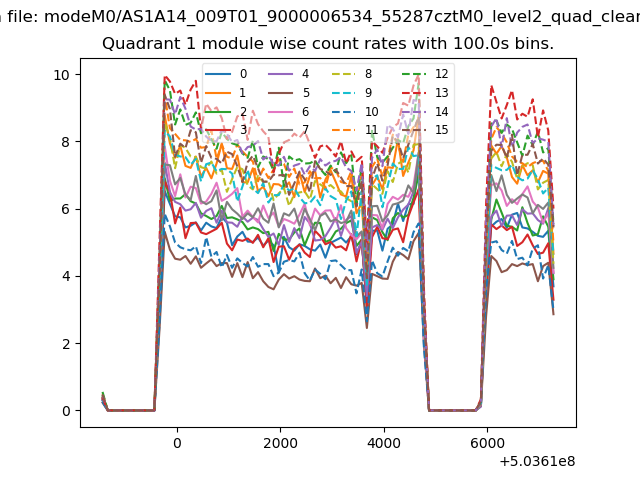
| Module-wise count rates for Quadrant A Data is divided into 100 sec bins |
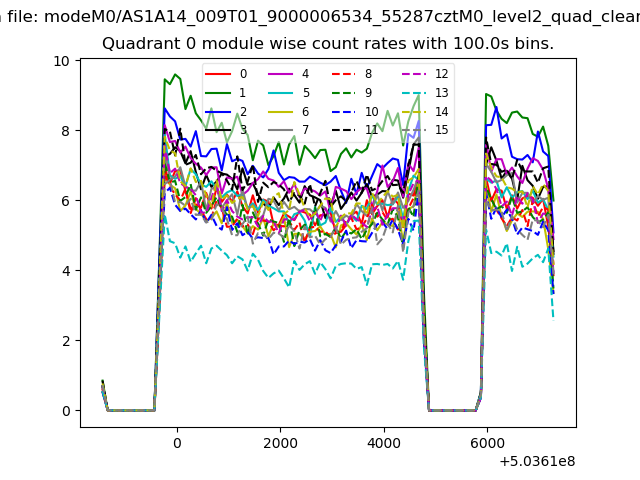 |
 |
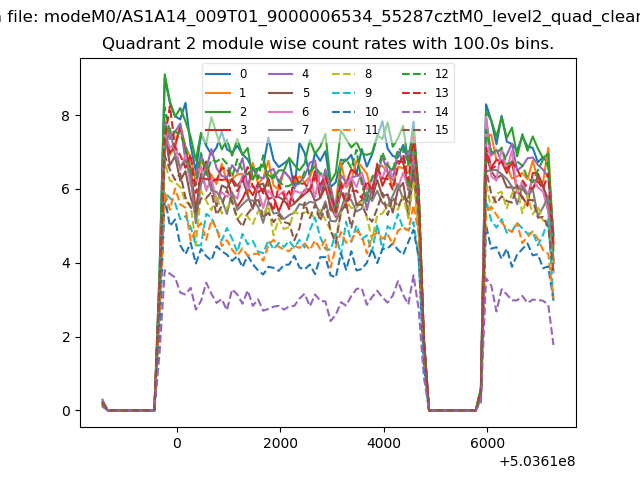
| Module-wise count rates for Quadrant B Data is divided into 100 sec bins |
 |
 |
| Module-wise count rates for Quadrant C Data is divided into 100 sec bins |
 |
 |
| Module-wise count rates for Quadrant D Data is divided into 100 sec bins |
 |
 |
| Parameter | Plot |
|---|---|
| CZT HV Monitor | 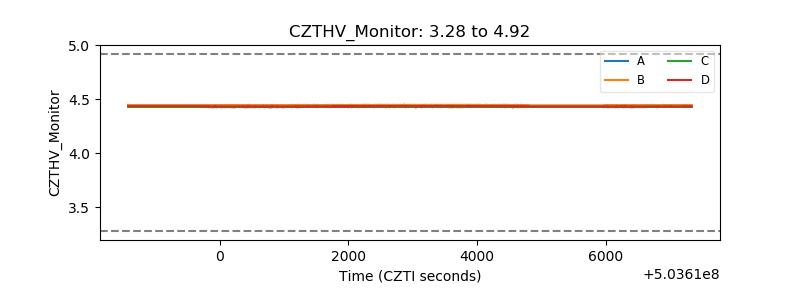 |
| D_VDD | 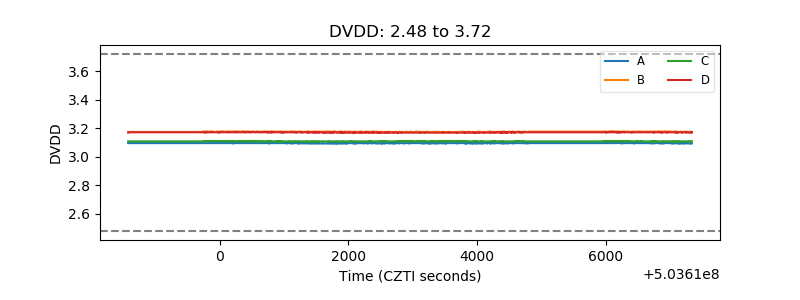 |
| Temperature 1 | 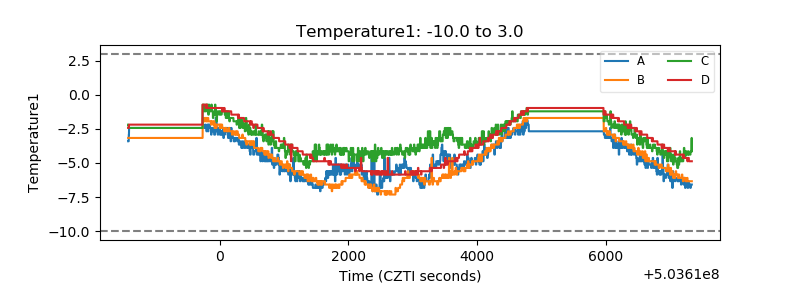 |
| Veto HV Monitor | 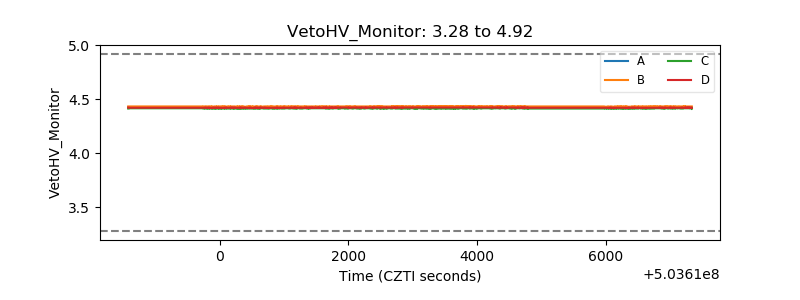 |
| Veto LLD | 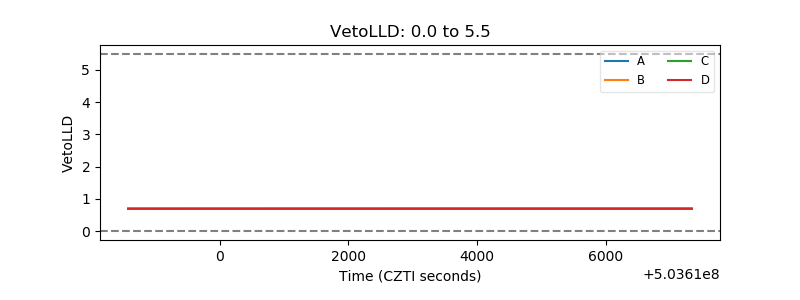 |
| Alpha Counter | 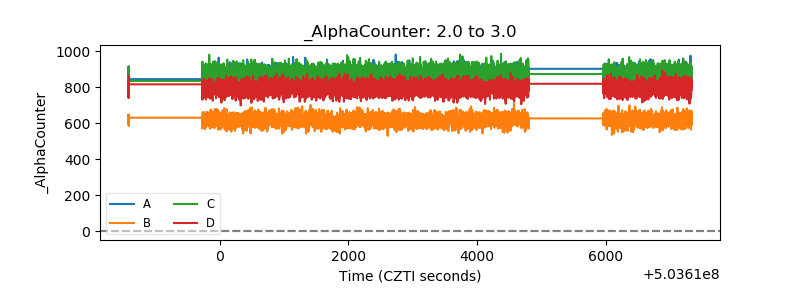 |
| _CPM_Rate | 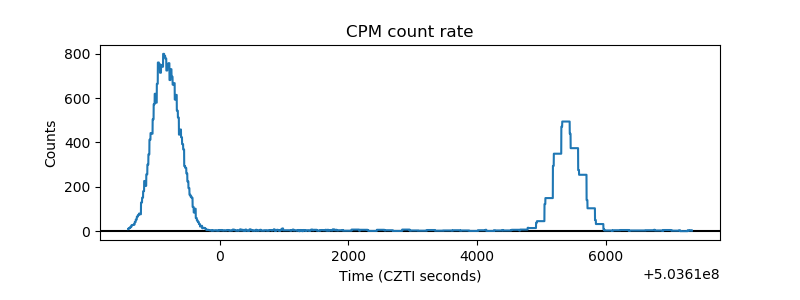 |
| CZT Counter | 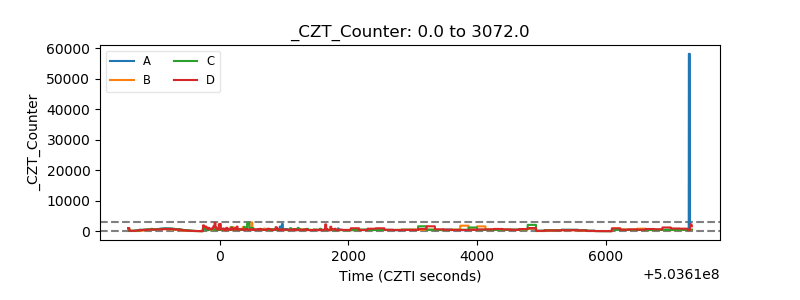 |
| +2.5 Volts monitor | 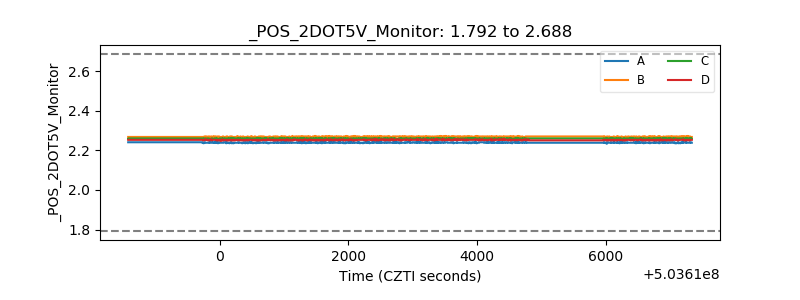 |
| +5 Volts monitor | 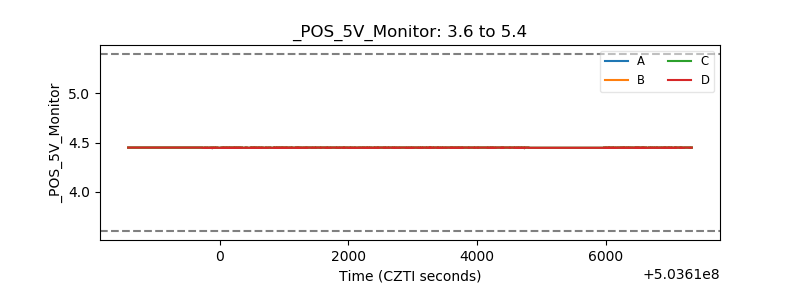 |
| _ROLL_ROT | 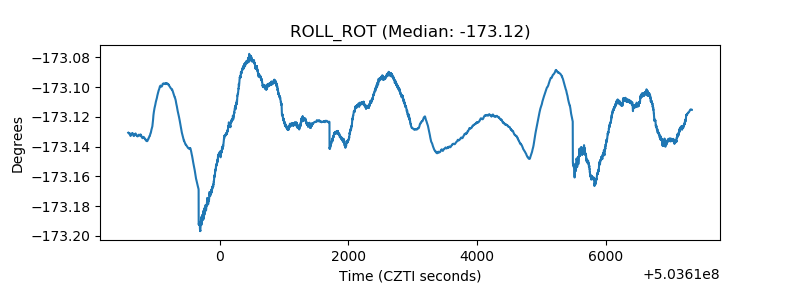 |
| _Roll_DEC | 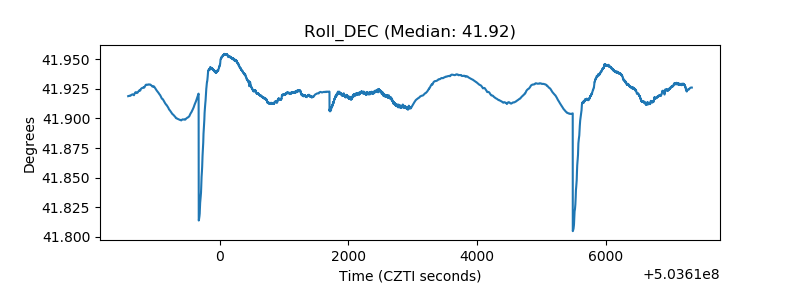 |
| _Roll_RA | 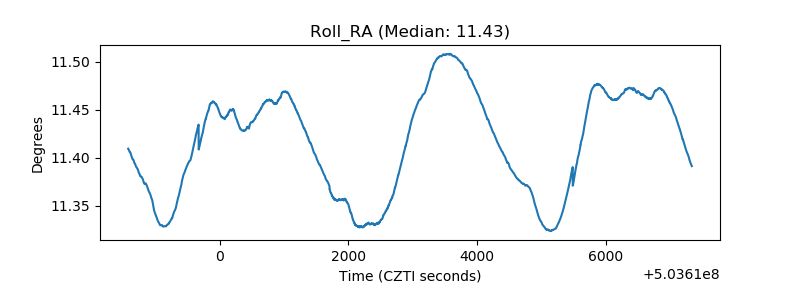 |
| Veto Counter | 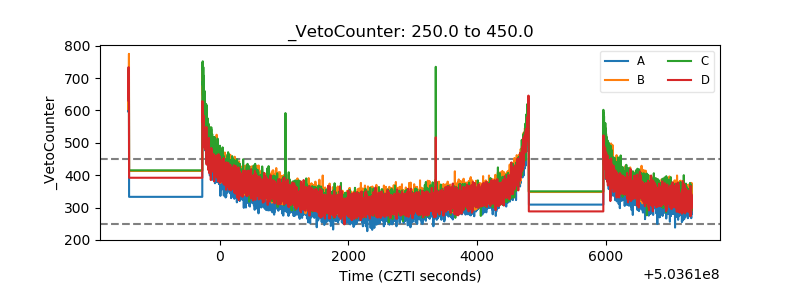 |