| Param | Original file | Final file |
|---|---|---|
| Filename | modeM0/AS1A14_009T01_9000006534_55290cztM0_level2.fits | modeM0/AS1A14_009T01_9000006534_55290cztM0_level2_quad_clean.evt |
| Size (bytes) | 535,944,960 | 127,074,240 |
| Size | 511.1 MB | 121.2 MB |
| Events in quadrant A | 4,759,335 | 820,556 |
| Events in quadrant B | 4,351,693 | 882,502 |
| Events in quadrant C | 4,618,585 | 783,818 |
| Events in quadrant D | 5,418,331 | 743,337 |
| Mode SS | |||
|---|---|---|---|
| Quadrant | BADHDUFLAG | Total packets | Discarded packets |
| A | 0 | 180 | 0 |
| B | 0 | 180 | 0 |
| C | 0 | 180 | 0 |
| D | 0 | 180 | 0 |
| Mode M0 | |||
|---|---|---|---|
| Quadrant | BADHDUFLAG | Total packets | Discarded packets |
| A | 0 | 20786 | 3 |
| B | 0 | 19789 | 3 |
| C | 0 | 20454 | 3 |
| D | 0 | 22653 | 3 |
| Mode M9 | |||
|---|---|---|---|
| Quadrant | BADHDUFLAG | Total packets | Discarded packets |
| A | 0 | 7 | 0 |
| B | 0 | 7 | 0 |
| C | 0 | 7 | 0 |
| D | 0 | 7 | 0 |
| Quadrant | Total seconds | Saturated seconds | Saturation percentage |
|---|---|---|---|
| A | 8893 | 216 | 2.428877% |
| B | 8894 | 220 | 2.473578% |
| C | 8894 | 240 | 2.698448% |
| D | 8894 | 238 | 2.675961% |
Noise dominated data is calculated using 1-second bins in cleaned event files. If a bin has >2000 counts, and if more than 50% of those come from <1% of pixels, then it is considered to be noise-dominated and hence unusable.
| Quadrant | # 1 sec bins | Bins with >0 counts | Bins with >2000 counts | High rate bins dominated by noise | Noise dominated (total time) | Noise dominated (detector-on time) | Marked lightcurve |
|---|---|---|---|---|---|---|---|
| A | 9593 | 8895 | 106 | 106 | 1.10% | 1.19% | 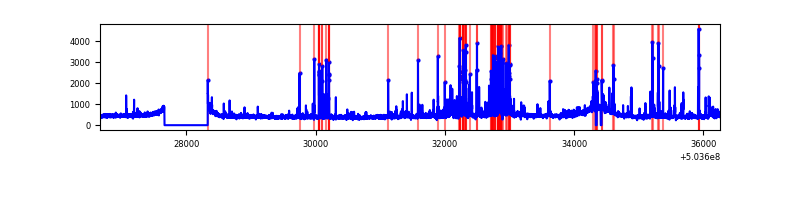 |
| B | 9594 | 8897 | 48 | 48 | 0.50% | 0.54% | 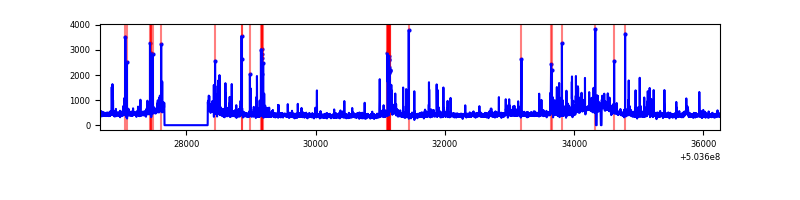 |
| C | 9594 | 8897 | 177 | 177 | 1.84% | 1.99% | 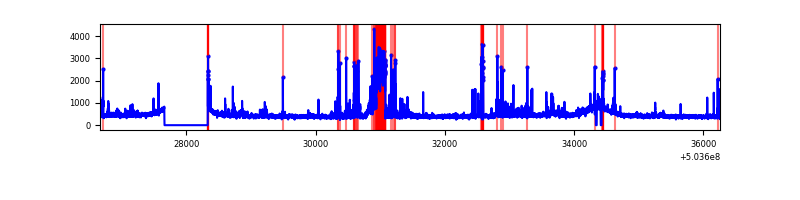 |
| D | 9594 | 8897 | 166 | 166 | 1.73% | 1.87% | 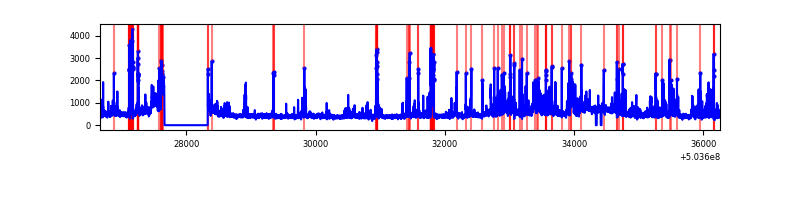 |
Top three noisy pixels from each quadrant. If the there are fewer than three noisy pixels in the level2.evt file, extra rows are filled as -1
| Pixel properties | Quadrant properties | ||||||
|---|---|---|---|---|---|---|---|
| Quadrant | DetID | PixID | Counts | Sigma | Mean | Median | Sigma |
| A | 3 | 78 | 641173 | 2755.9 | 952 | 927 | 232.3 |
| A | 0 | 8 | 225017 | 964.58 | 952 | 927 | 232.3 |
| A | 7 | 243 | 54696 | 231.44 | 952 | 927 | 232.3 |
| B | 7 | 252 | 158844 | 775.31 | 948 | 910 | 203.7 |
| B | 2 | 249 | 149317 | 728.54 | 948 | 910 | 203.7 |
| B | 0 | 199 | 132699 | 646.96 | 948 | 910 | 203.7 |
| C | 13 | 3 | 301703 | 1180.23 | 935 | 924 | 254.8 |
| C | 3 | 248 | 292847 | 1145.48 | 935 | 924 | 254.8 |
| C | 3 | 208 | 109967 | 427.87 | 935 | 924 | 254.8 |
| D | 11 | 129 | 1035798 | 3995.94 | 925 | 884 | 259.0 |
| D | 7 | 70 | 165399 | 635.21 | 925 | 884 | 259.0 |
| D | 2 | 31 | 134555 | 516.12 | 925 | 884 | 259.0 |
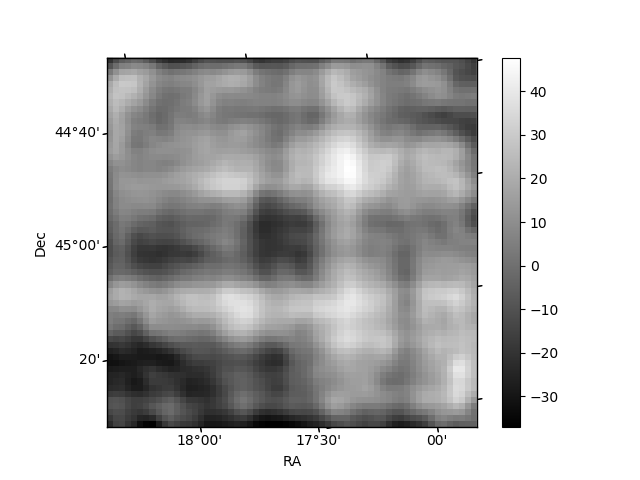
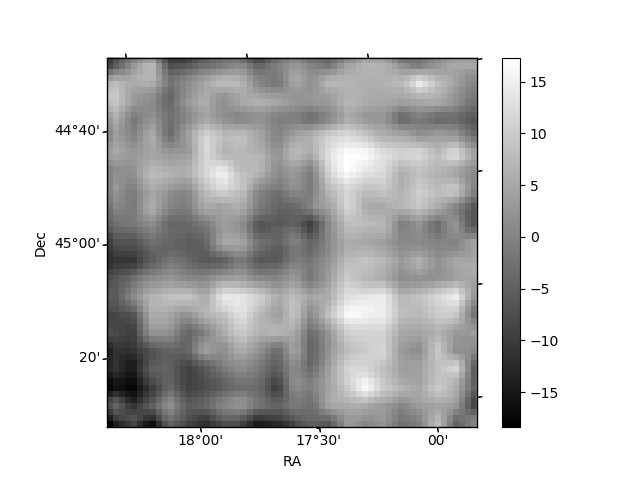
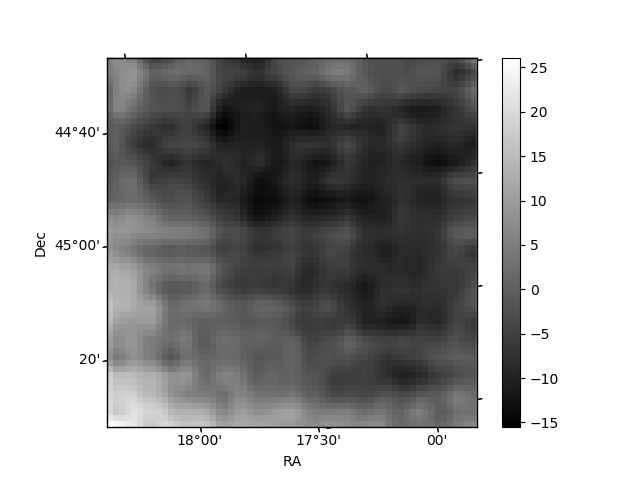
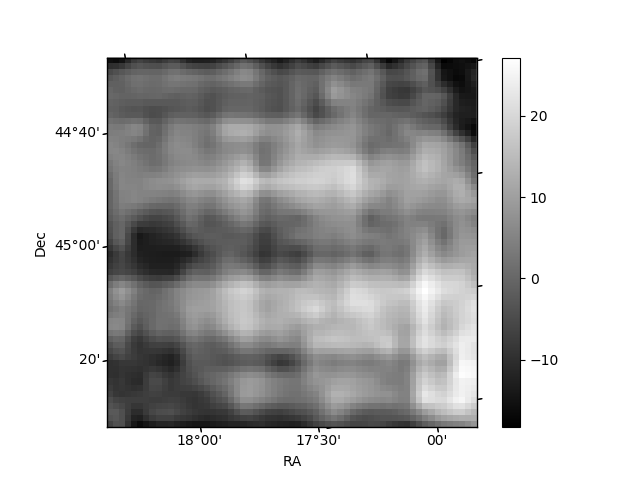
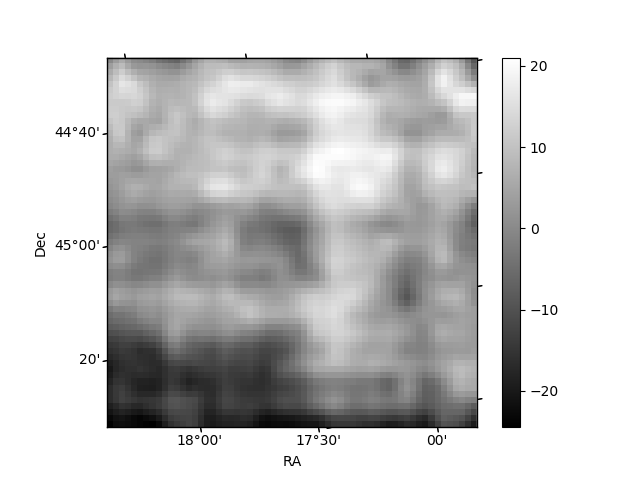
Histogram calculated using DETX and DETY for each event in the final _common_clean file
| Quadrant A | 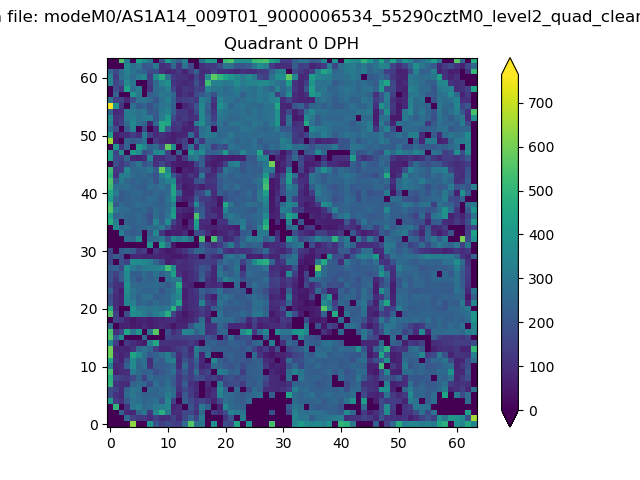 |
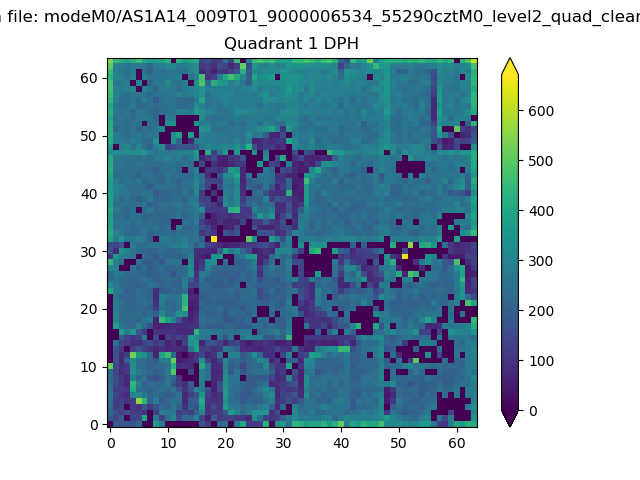 |
Quadrant B |
|---|---|---|---|
| Quadrant D | 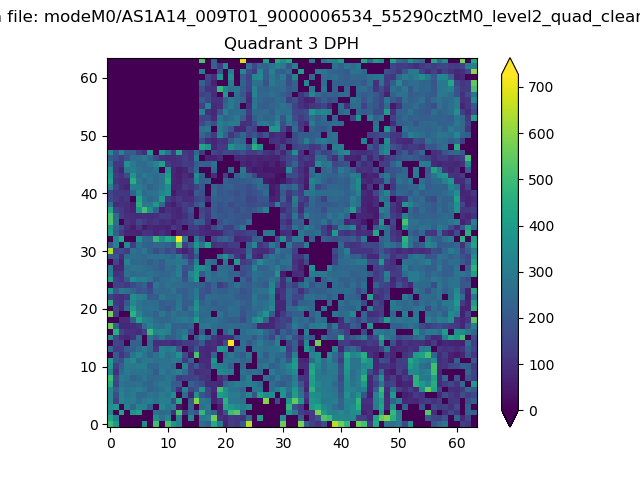 |
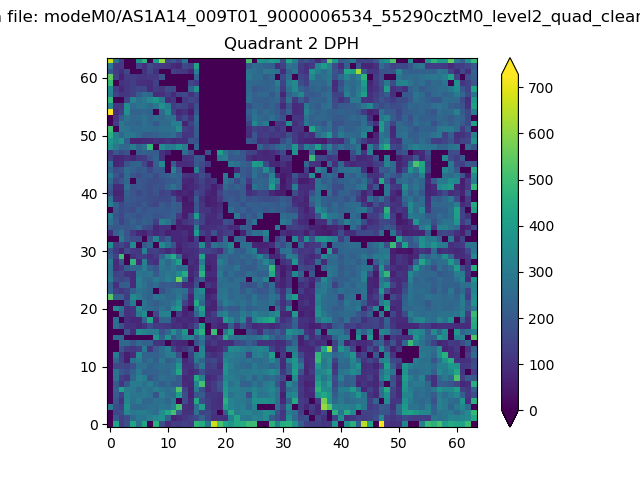 |
Quadrant C |
| Plot type | Count rate plots | Images |
|---|---|---|
| Comparison with Poisson distribution Blue bars denote a histogram of data divided into 1 sec bins. Red curve is a Poisson curve with rate = median count rate of data. |
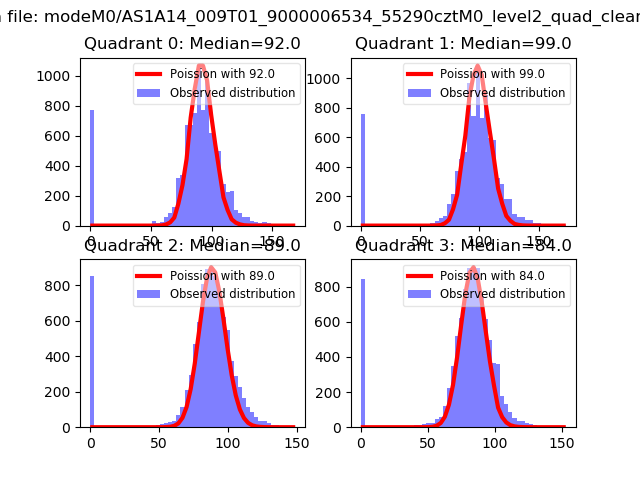 |
 |
| Quadrant-wise count rates Data is divided into 100 sec bins |
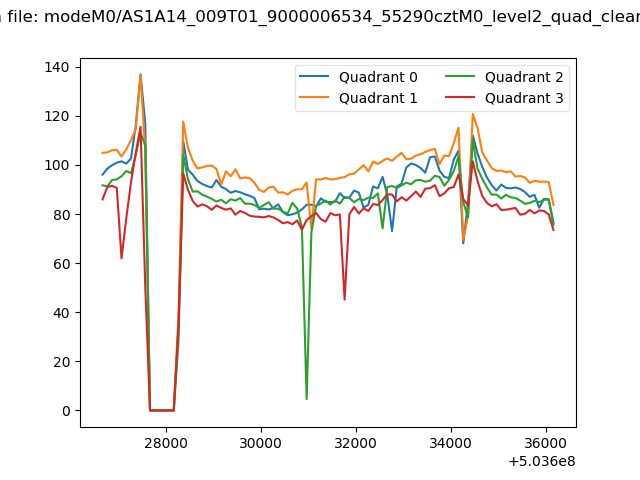 |
|
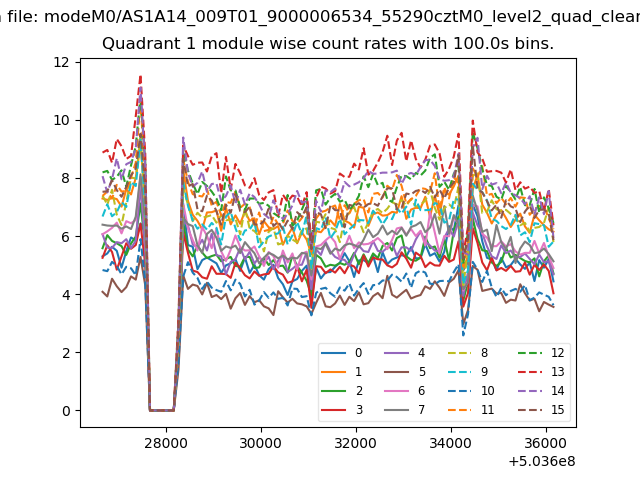
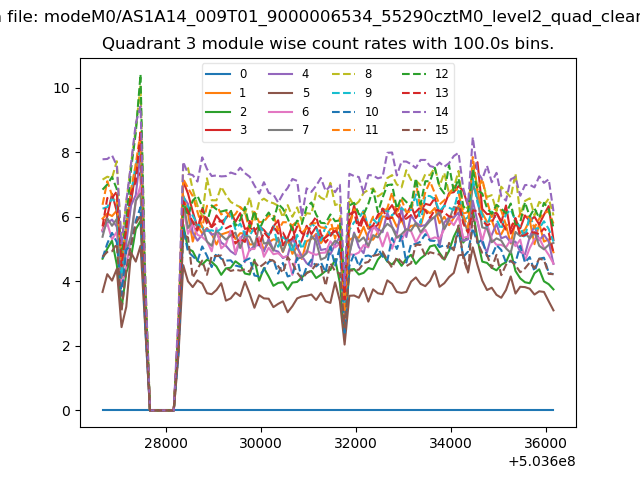
| Module-wise count rates for Quadrant A Data is divided into 100 sec bins |
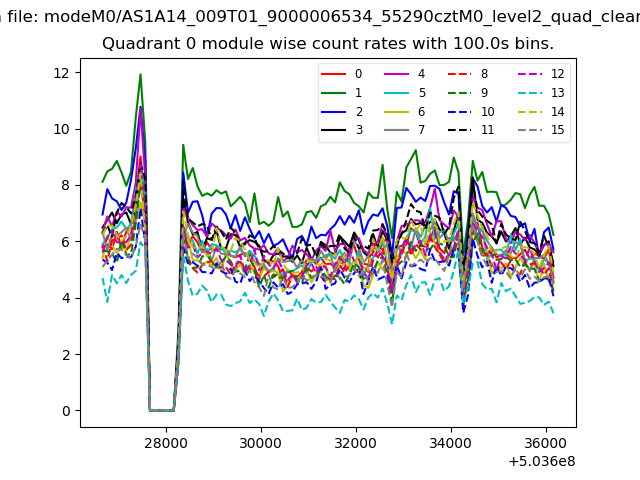 |
 |
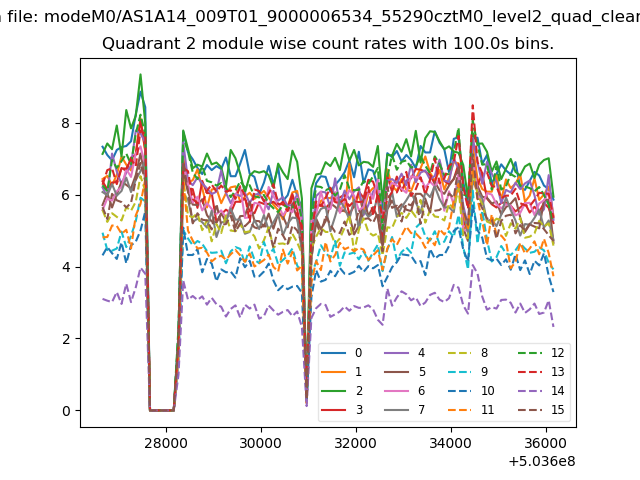
| Module-wise count rates for Quadrant B Data is divided into 100 sec bins |
 |
 |
| Module-wise count rates for Quadrant C Data is divided into 100 sec bins |
 |
 |
| Module-wise count rates for Quadrant D Data is divided into 100 sec bins |
 |
 |
| Parameter | Plot |
|---|---|
| CZT HV Monitor | 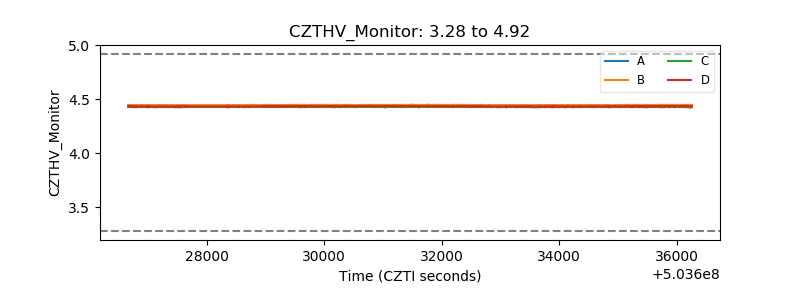 |
| D_VDD | 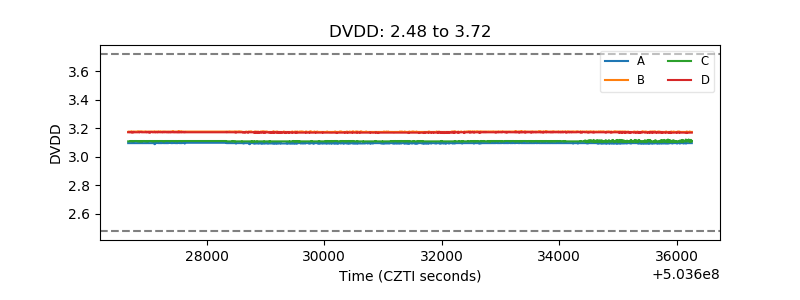 |
| Temperature 1 | 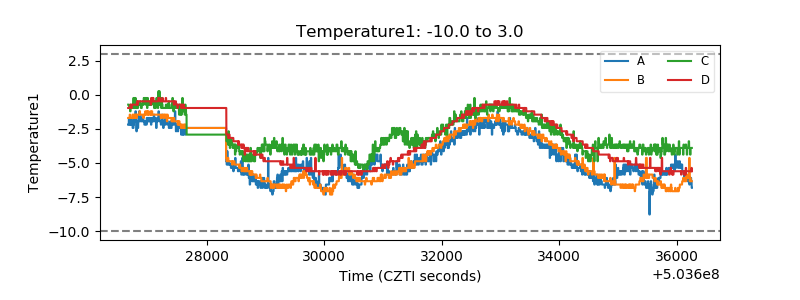 |
| Veto HV Monitor | 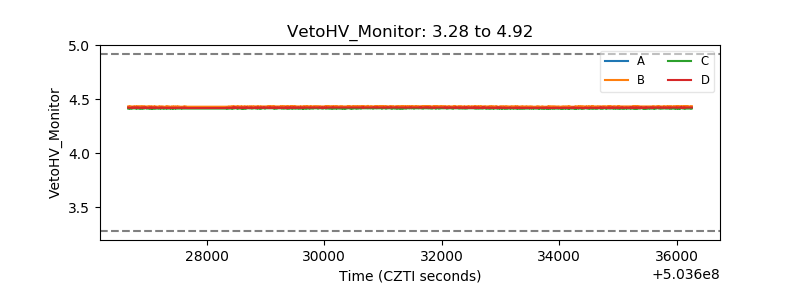 |
| Veto LLD | 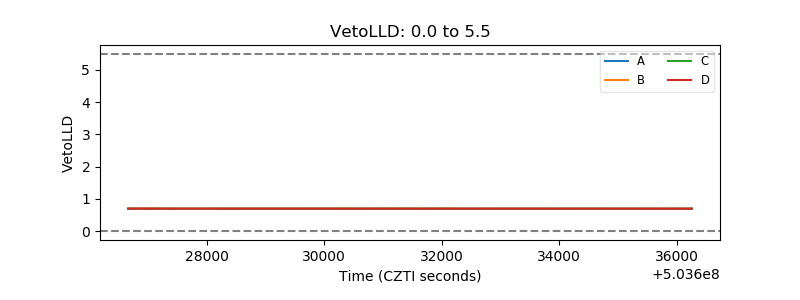 |
| Alpha Counter | 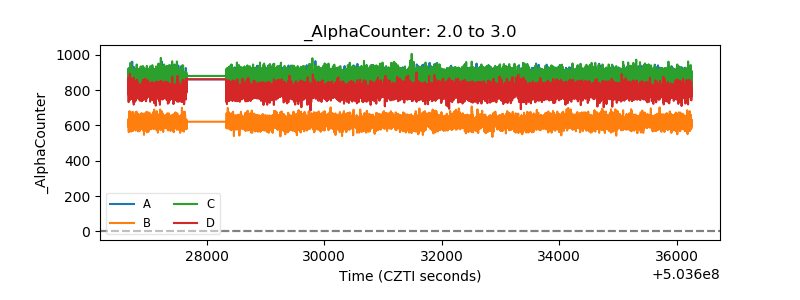 |
| _CPM_Rate | 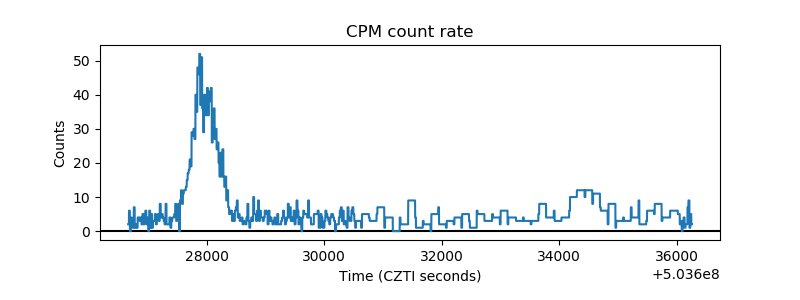 |
| CZT Counter | 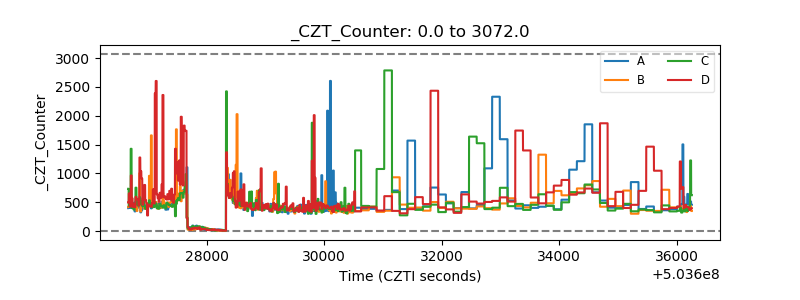 |
| +2.5 Volts monitor | 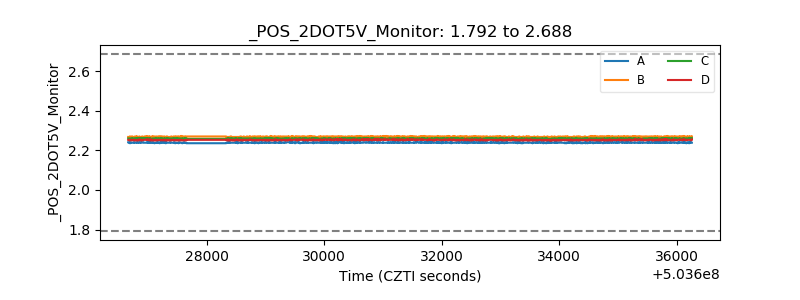 |
| +5 Volts monitor | 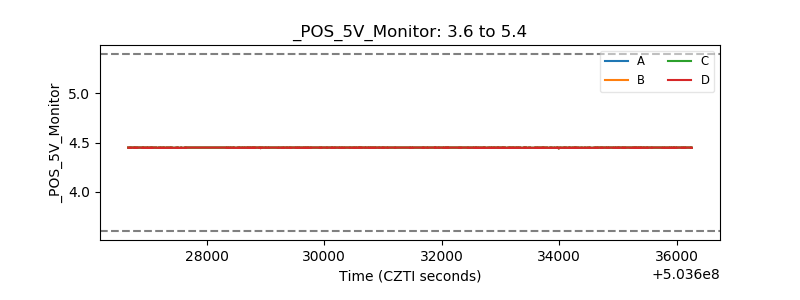 |
| _ROLL_ROT | 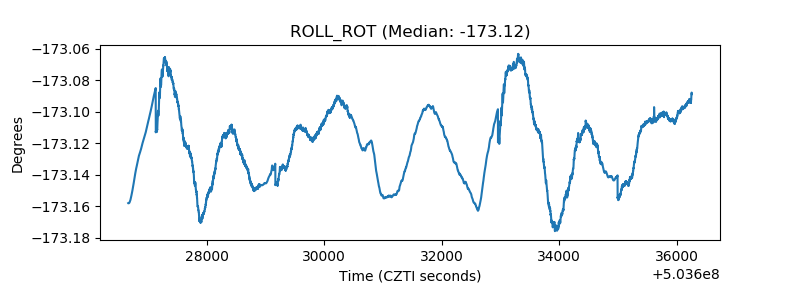 |
| _Roll_DEC | 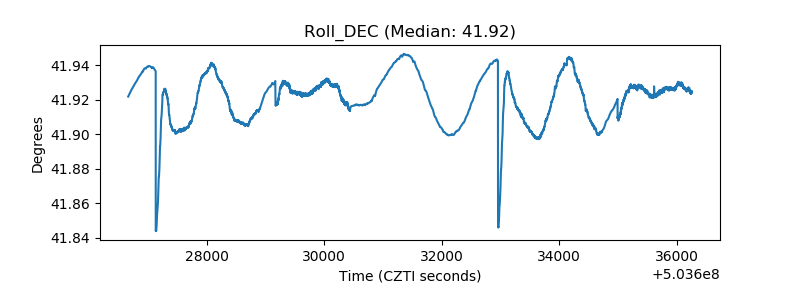 |
| _Roll_RA | 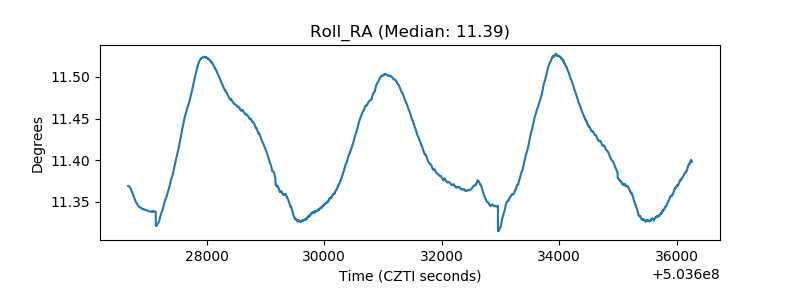 |
| Veto Counter | 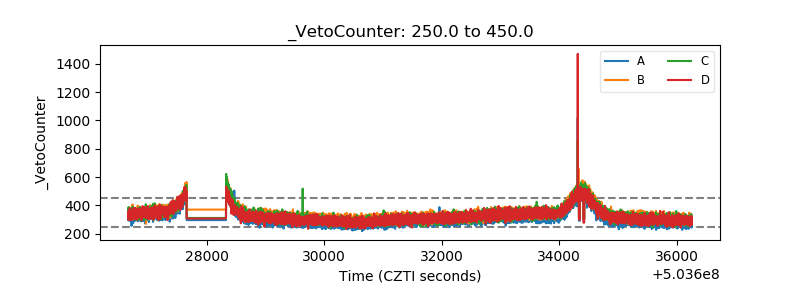 |