| Param | Original file | Final file |
|---|---|---|
| Filename | modeM0/AS1A14_009T01_9000006534_55291cztM0_level2.fits | modeM0/AS1A14_009T01_9000006534_55291cztM0_level2_quad_clean.evt |
| Size (bytes) | 559,572,480 | 128,528,640 |
| Size | 533.6 MB | 122.6 MB |
| Events in quadrant A | 4,443,157 | 831,155 |
| Events in quadrant B | 4,322,854 | 895,960 |
| Events in quadrant C | 4,348,130 | 809,538 |
| Events in quadrant D | 6,894,945 | 725,657 |
| Mode SS | |||
|---|---|---|---|
| Quadrant | BADHDUFLAG | Total packets | Discarded packets |
| A | 0 | 182 | 0 |
| B | 0 | 182 | 0 |
| C | 0 | 182 | 0 |
| D | 0 | 182 | 0 |
| Mode M0 | |||
|---|---|---|---|
| Quadrant | BADHDUFLAG | Total packets | Discarded packets |
| A | 0 | 20018 | 2 |
| B | 0 | 19683 | 2 |
| C | 0 | 19714 | 2 |
| D | 0 | 26914 | 2 |
| Quadrant | Total seconds | Saturated seconds | Saturation percentage |
|---|---|---|---|
| A | 9068 | 133 | 1.466696% |
| B | 9068 | 157 | 1.731363% |
| C | 9068 | 100 | 1.102779% |
| D | 9069 | 537 | 5.921270% |
Noise dominated data is calculated using 1-second bins in cleaned event files. If a bin has >2000 counts, and if more than 50% of those come from <1% of pixels, then it is considered to be noise-dominated and hence unusable.
| Quadrant | # 1 sec bins | Bins with >0 counts | Bins with >2000 counts | High rate bins dominated by noise | Noise dominated (total time) | Noise dominated (detector-on time) | Marked lightcurve |
|---|---|---|---|---|---|---|---|
| A | 9098 | 9069 | 53 | 53 | 0.58% | 0.58% | 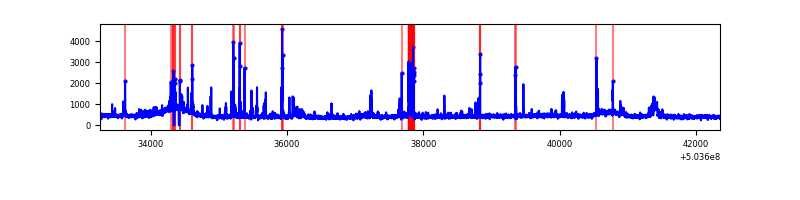 |
| B | 9098 | 9070 | 13 | 13 | 0.14% | 0.14% | 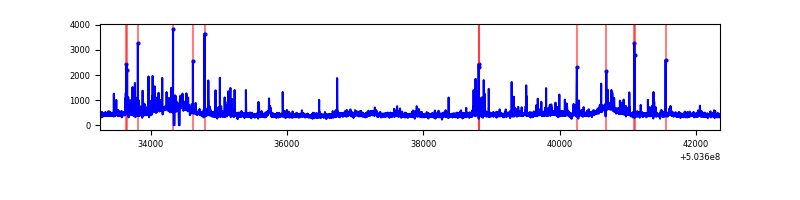 |
| C | 9098 | 9070 | 46 | 46 | 0.51% | 0.51% | 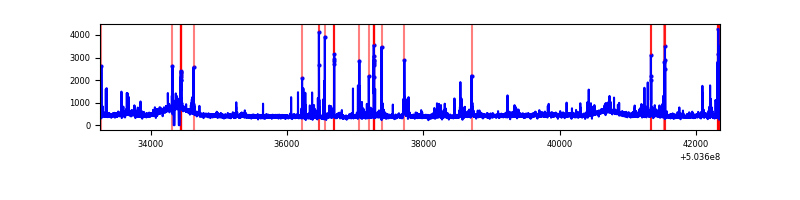 |
| D | 9099 | 9071 | 504 | 504 | 5.54% | 5.56% | 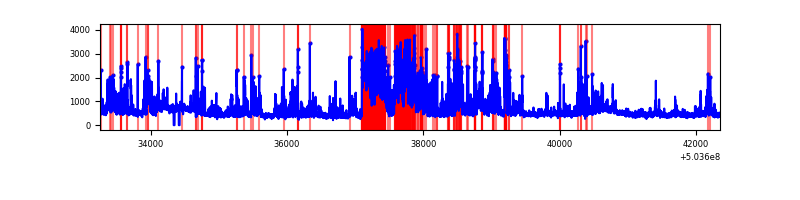 |
Top three noisy pixels from each quadrant. If the there are fewer than three noisy pixels in the level2.evt file, extra rows are filled as -1
| Pixel properties | Quadrant properties | ||||||
|---|---|---|---|---|---|---|---|
| Quadrant | DetID | PixID | Counts | Sigma | Mean | Median | Sigma |
| A | 0 | 8 | 266478 | 1121.95 | 970 | 943 | 236.7 |
| A | 7 | 7 | 86027 | 359.5 | 970 | 943 | 236.7 |
| A | 3 | 78 | 78665 | 328.39 | 970 | 943 | 236.7 |
| B | 0 | 199 | 132347 | 629.03 | 969 | 931 | 208.9 |
| B | 7 | 252 | 104463 | 495.56 | 969 | 931 | 208.9 |
| B | 2 | 249 | 96276 | 456.37 | 969 | 931 | 208.9 |
| C | 13 | 3 | 242683 | 925.34 | 960 | 950 | 261.2 |
| C | 12 | 252 | 113330 | 430.18 | 960 | 950 | 261.2 |
| C | 14 | 254 | 67765 | 255.76 | 960 | 950 | 261.2 |
| D | 6 | 42 | 1026212 | 3925.37 | 934 | 892 | 261.2 |
| D | 2 | 207 | 693553 | 2651.81 | 934 | 892 | 261.2 |
| D | 11 | 129 | 584539 | 2234.46 | 934 | 892 | 261.2 |
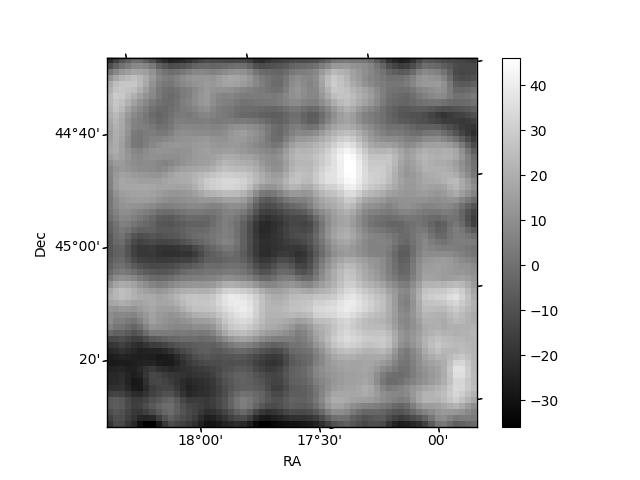
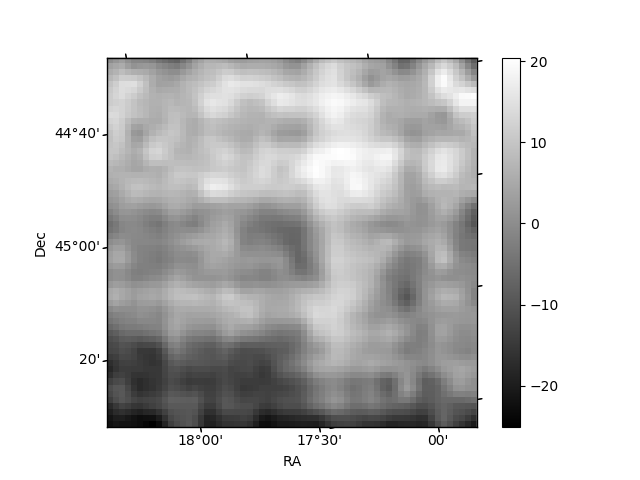
Histogram calculated using DETX and DETY for each event in the final _common_clean file
| Quadrant A | 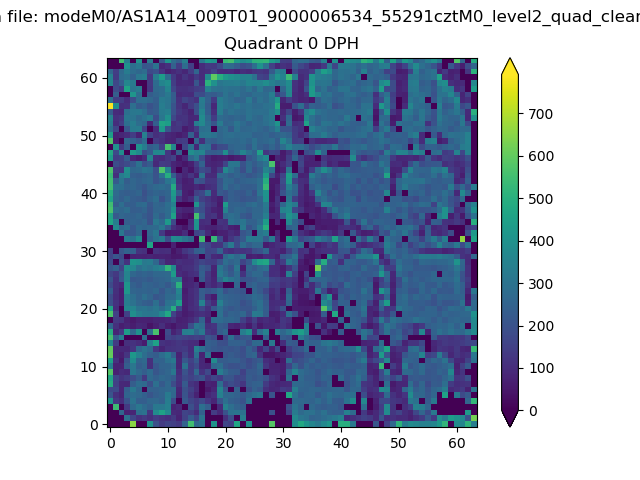 |
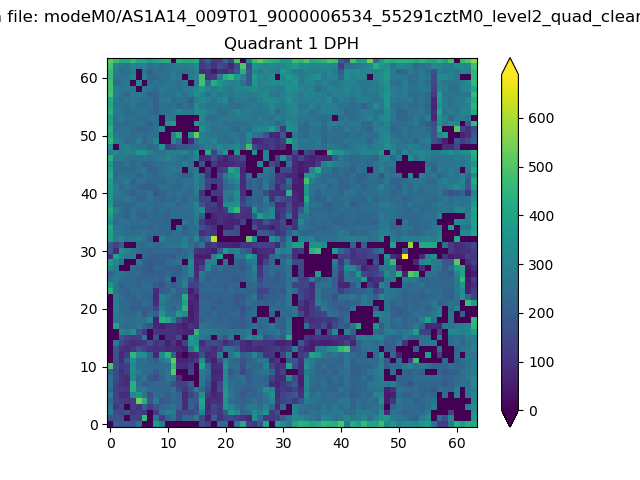 |
Quadrant B |
|---|---|---|---|
| Quadrant D | 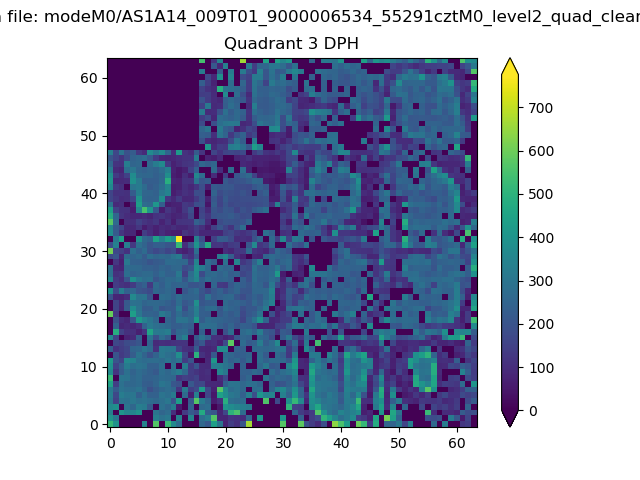 |
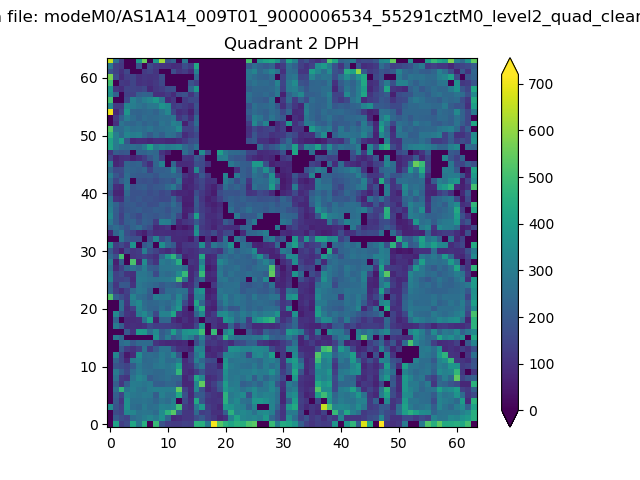 |
Quadrant C |
| Plot type | Count rate plots | Images |
|---|---|---|
| Comparison with Poisson distribution Blue bars denote a histogram of data divided into 1 sec bins. Red curve is a Poisson curve with rate = median count rate of data. |
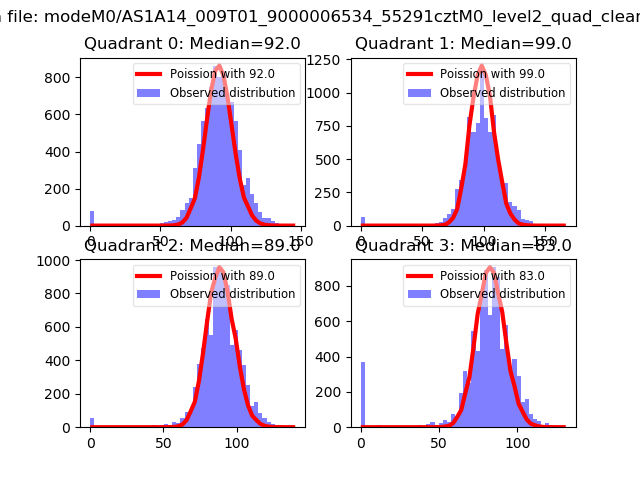 |
 |
| Quadrant-wise count rates Data is divided into 100 sec bins |
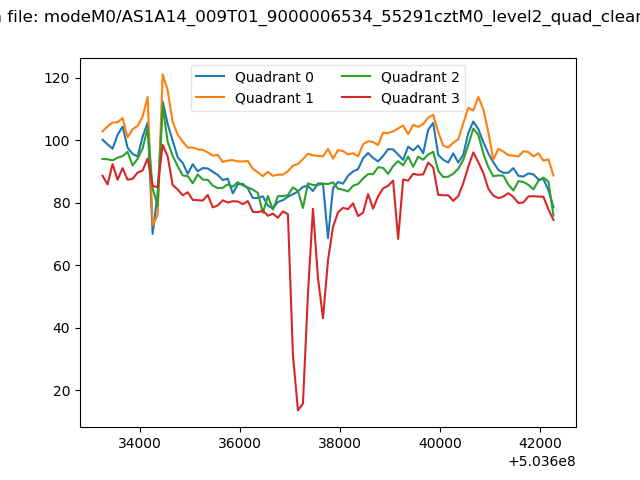 |
|
| Module-wise count rates for Quadrant A Data is divided into 100 sec bins |
 |
 |
| Module-wise count rates for Quadrant B Data is divided into 100 sec bins |
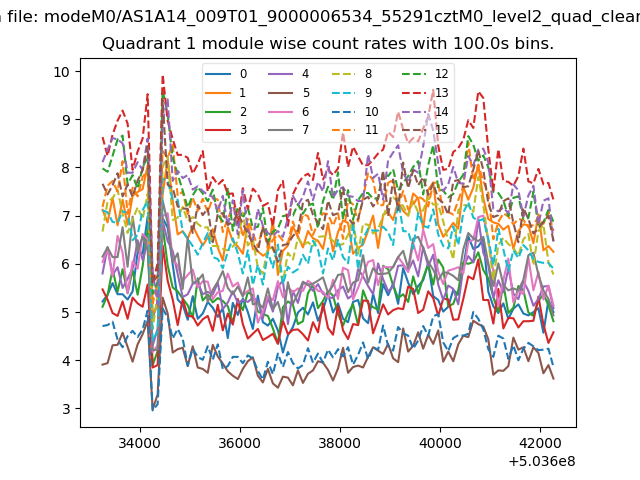 |
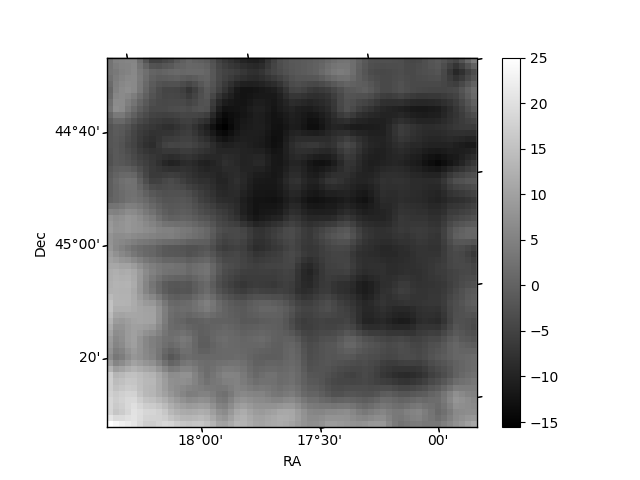 |
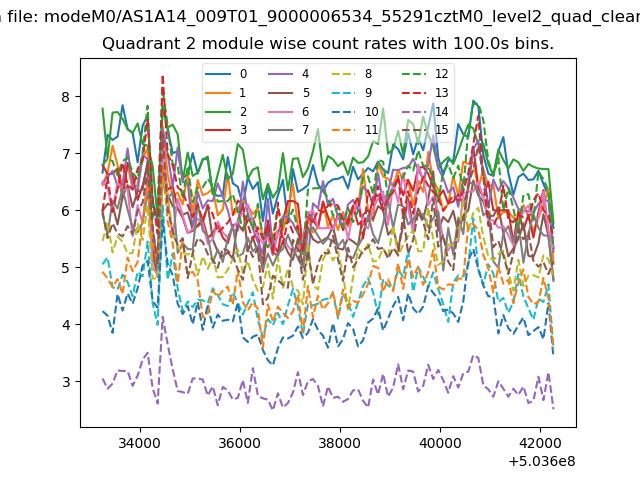
| Module-wise count rates for Quadrant C Data is divided into 100 sec bins |
 |
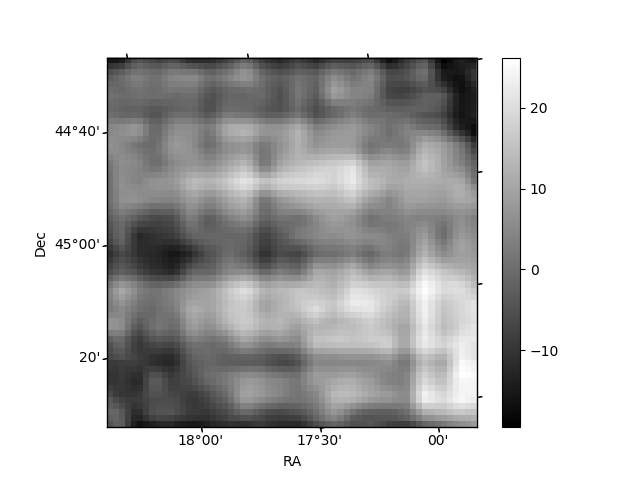 |
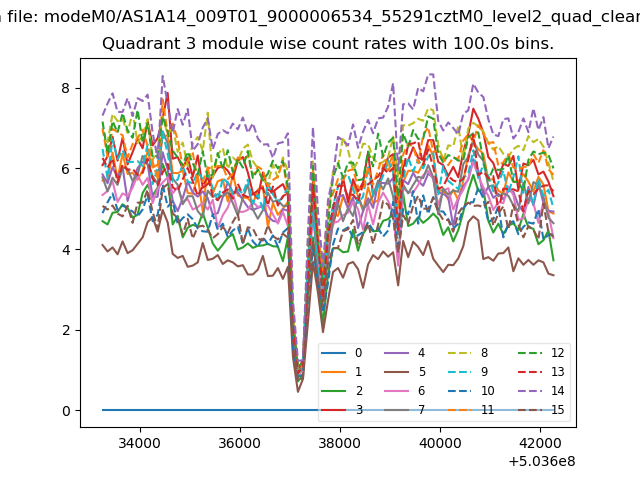
| Module-wise count rates for Quadrant D Data is divided into 100 sec bins |
 |
 |
| Parameter | Plot |
|---|---|
| CZT HV Monitor | 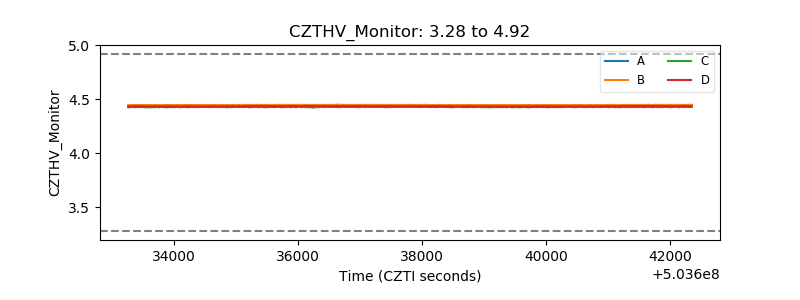 |
| D_VDD | 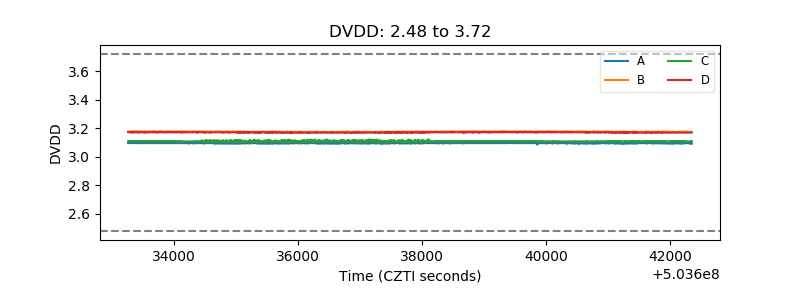 |
| Temperature 1 | 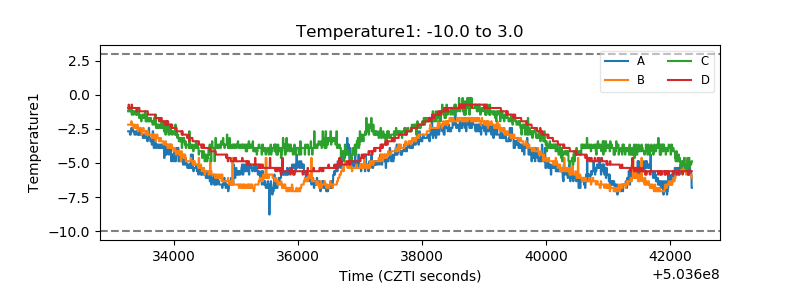 |
| Veto HV Monitor | 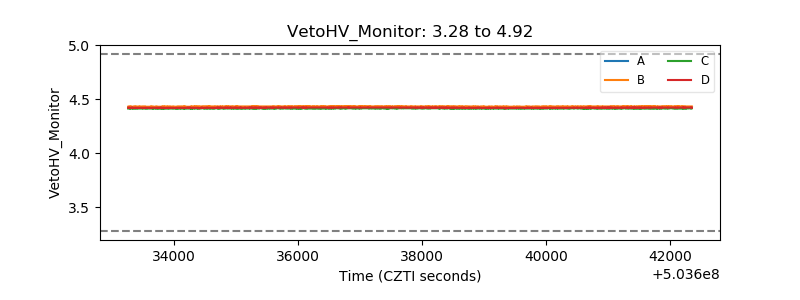 |
| Veto LLD | 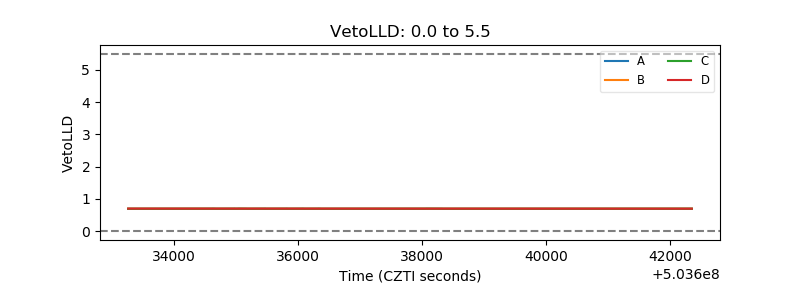 |
| Alpha Counter | 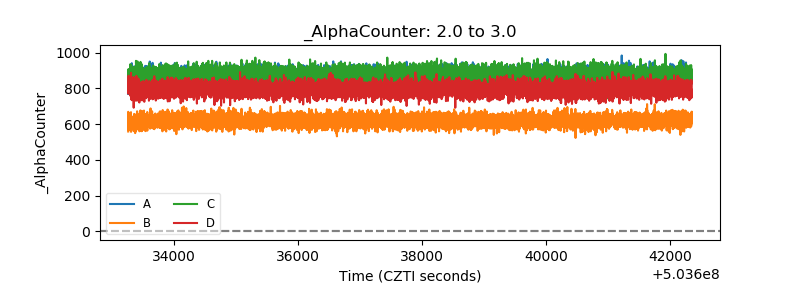 |
| _CPM_Rate | 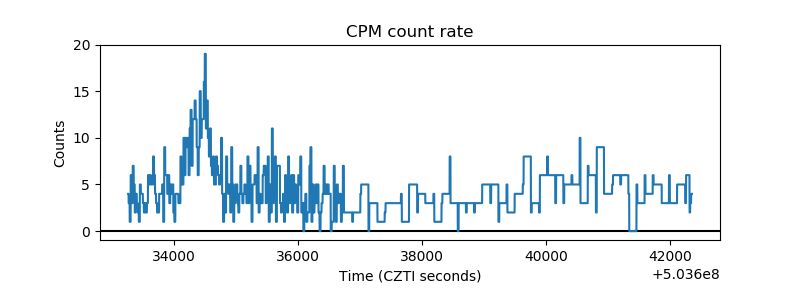 |
| CZT Counter | 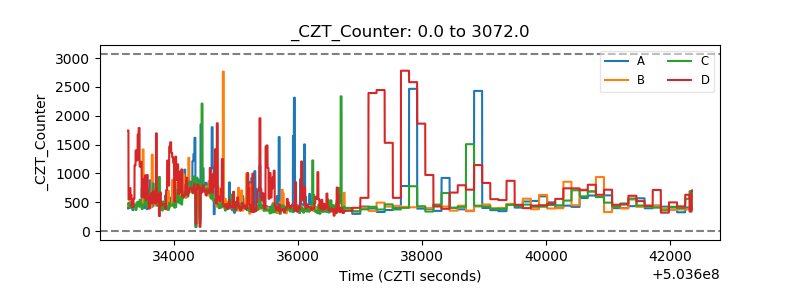 |
| +2.5 Volts monitor |  |
| +5 Volts monitor |  |
| _ROLL_ROT | 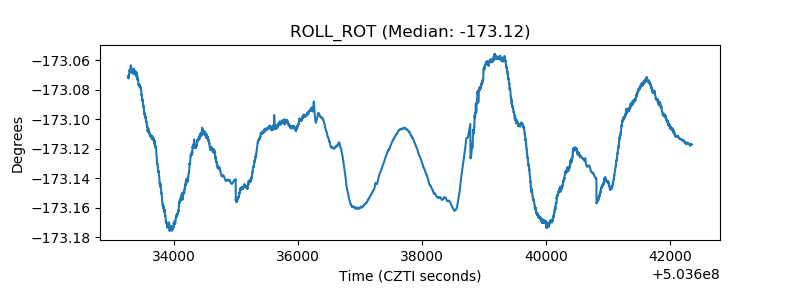 |
| _Roll_DEC | 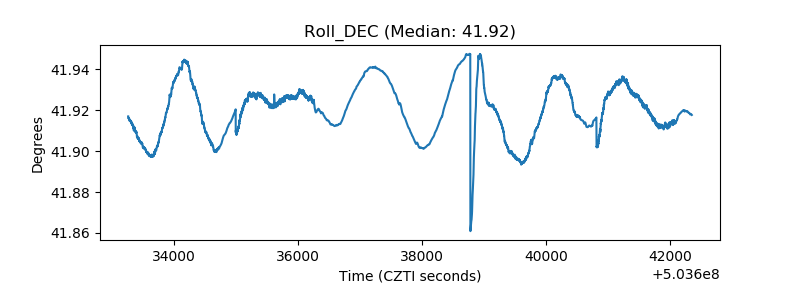 |
| _Roll_RA | 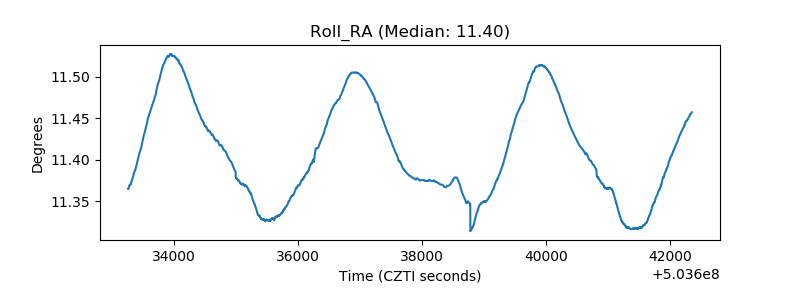 |
| Veto Counter | 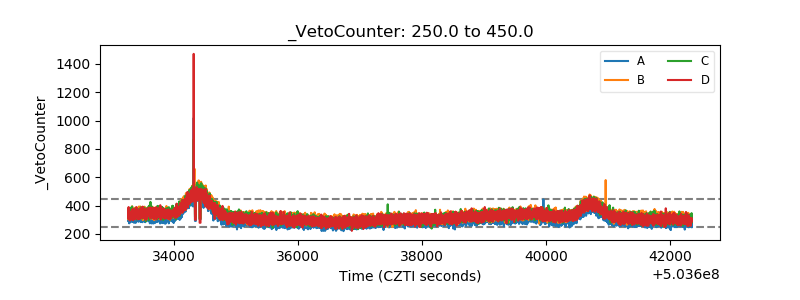 |