| Param | Original file | Final file |
|---|---|---|
| Filename | modeM0/AS1A14_009T01_9000006534_55292cztM0_level2.fits | modeM0/AS1A14_009T01_9000006534_55292cztM0_level2_quad_clean.evt |
| Size (bytes) | 530,844,480 | 124,891,200 |
| Size | 506.3 MB | 119.1 MB |
| Events in quadrant A | 4,666,615 | 798,064 |
| Events in quadrant B | 4,730,343 | 855,418 |
| Events in quadrant C | 4,600,068 | 775,543 |
| Events in quadrant D | 4,965,421 | 738,417 |
| Mode SS | |||
|---|---|---|---|
| Quadrant | BADHDUFLAG | Total packets | Discarded packets |
| A | 0 | 176 | 0 |
| B | 0 | 176 | 0 |
| C | 0 | 176 | 0 |
| D | 0 | 176 | 0 |
| Mode M0 | |||
|---|---|---|---|
| Quadrant | BADHDUFLAG | Total packets | Discarded packets |
| A | 0 | 20544 | 1 |
| B | 0 | 20768 | 0 |
| C | 0 | 20262 | 0 |
| D | 0 | 21065 | 0 |
| Quadrant | Total seconds | Saturated seconds | Saturation percentage |
|---|---|---|---|
| A | 8850 | 205 | 2.316384% |
| B | 8850 | 286 | 3.231638% |
| C | 8850 | 223 | 2.519774% |
| D | 8851 | 99 | 1.118518% |
Noise dominated data is calculated using 1-second bins in cleaned event files. If a bin has >2000 counts, and if more than 50% of those come from <1% of pixels, then it is considered to be noise-dominated and hence unusable.
| Quadrant | # 1 sec bins | Bins with >0 counts | Bins with >2000 counts | High rate bins dominated by noise | Noise dominated (total time) | Noise dominated (detector-on time) | Marked lightcurve |
|---|---|---|---|---|---|---|---|
| A | 8850 | 8850 | 137 | 137 | 1.55% | 1.55% | 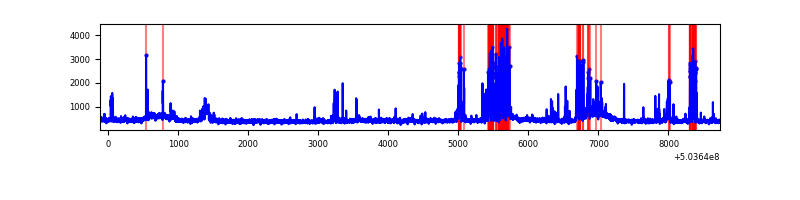 |
| B | 8850 | 8850 | 153 | 153 | 1.73% | 1.73% | 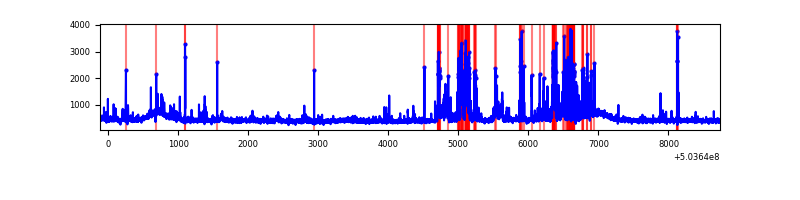 |
| C | 8850 | 8850 | 160 | 160 | 1.81% | 1.81% | 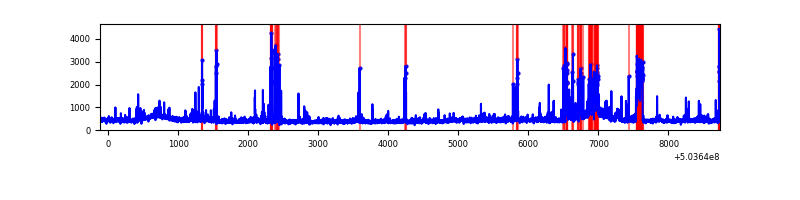 |
| D | 8851 | 8851 | 105 | 105 | 1.19% | 1.19% | 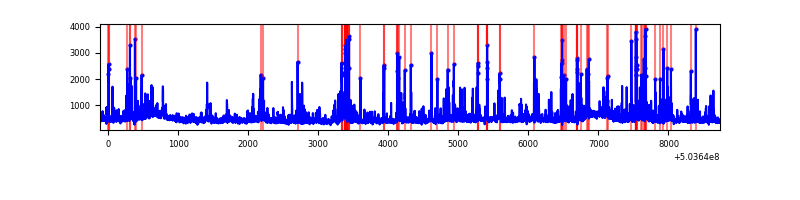 |
Top three noisy pixels from each quadrant. If the there are fewer than three noisy pixels in the level2.evt file, extra rows are filled as -1
| Pixel properties | Quadrant properties | ||||||
|---|---|---|---|---|---|---|---|
| Quadrant | DetID | PixID | Counts | Sigma | Mean | Median | Sigma |
| A | 0 | 8 | 791086 | 3450.07 | 931 | 907 | 229.0 |
| A | 7 | 7 | 120394 | 521.7 | 931 | 907 | 229.0 |
| A | 7 | 243 | 41723 | 178.21 | 931 | 907 | 229.0 |
| B | 0 | 199 | 292380 | 1457.54 | 927 | 890 | 200.0 |
| B | 5 | 185 | 222788 | 1109.55 | 927 | 890 | 200.0 |
| B | 10 | 245 | 192626 | 958.74 | 927 | 890 | 200.0 |
| C | 13 | 3 | 412552 | 1652.84 | 918 | 909 | 249.1 |
| C | 12 | 249 | 401902 | 1610.08 | 918 | 909 | 249.1 |
| C | 12 | 252 | 94221 | 374.67 | 918 | 909 | 249.1 |
| D | 11 | 129 | 317308 | 1254.25 | 910 | 870 | 252.3 |
| D | 6 | 239 | 208902 | 824.56 | 910 | 870 | 252.3 |
| D | 3 | 12 | 192074 | 757.86 | 910 | 870 | 252.3 |
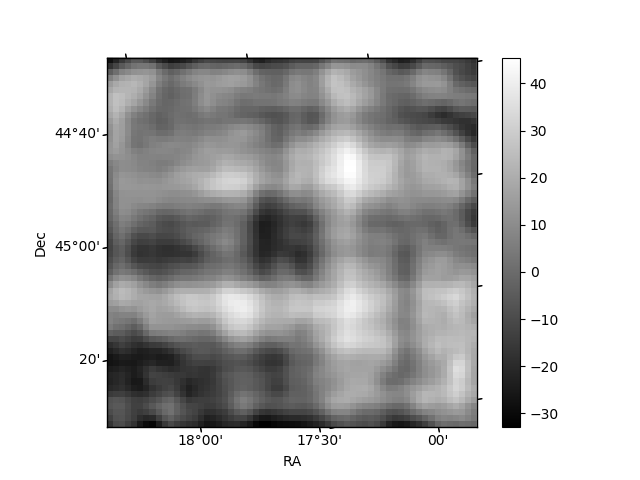
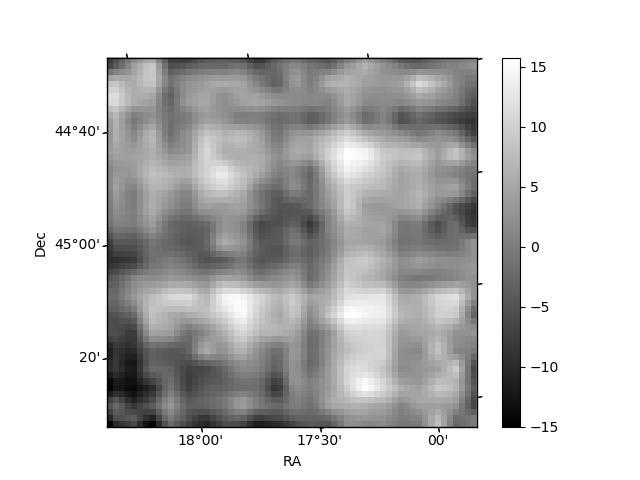
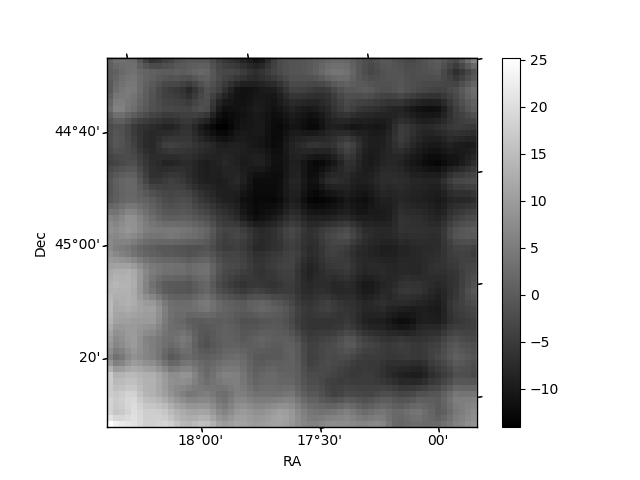
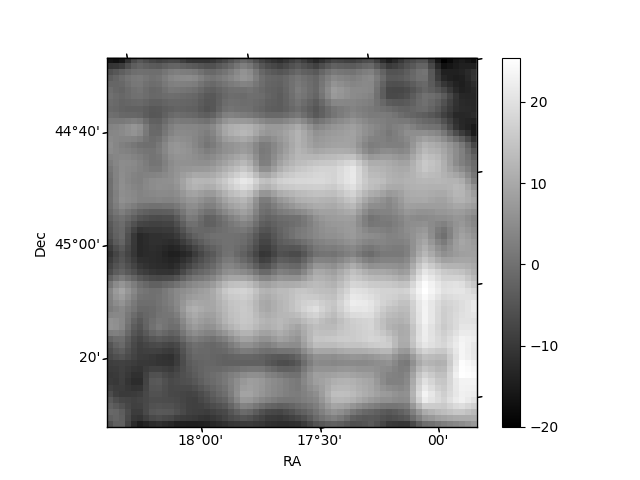
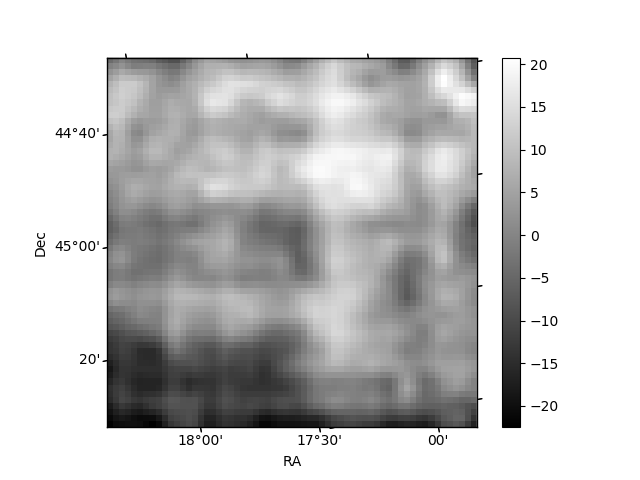
Histogram calculated using DETX and DETY for each event in the final _common_clean file
| Quadrant A | 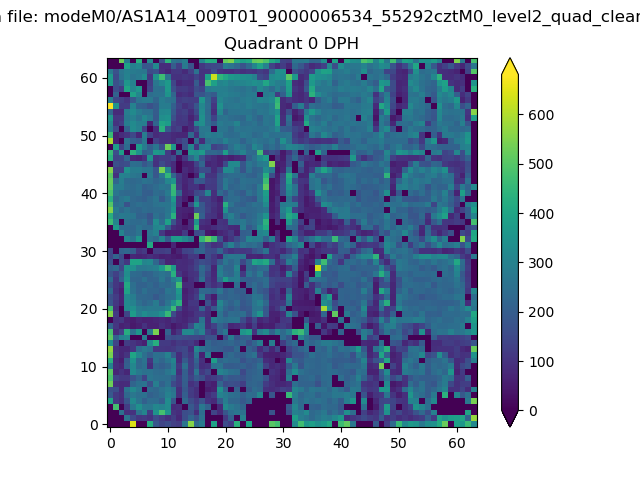 |
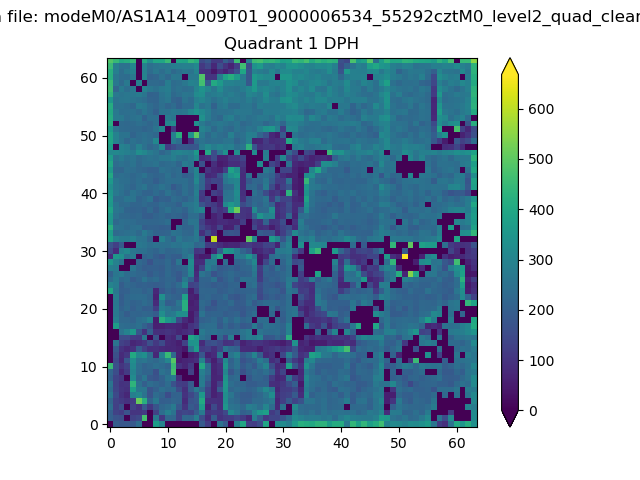 |
Quadrant B |
|---|---|---|---|
| Quadrant D | 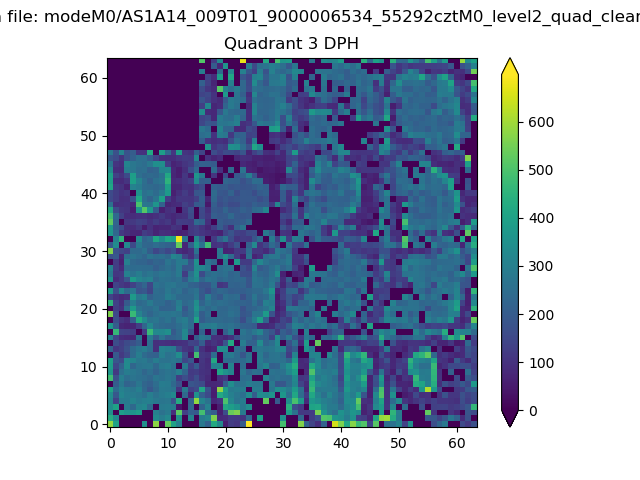 |
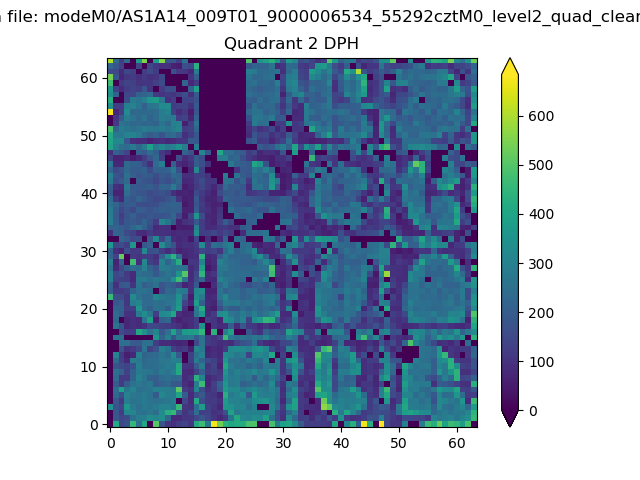 |
Quadrant C |
| Plot type | Count rate plots | Images |
|---|---|---|
| Comparison with Poisson distribution Blue bars denote a histogram of data divided into 1 sec bins. Red curve is a Poisson curve with rate = median count rate of data. |
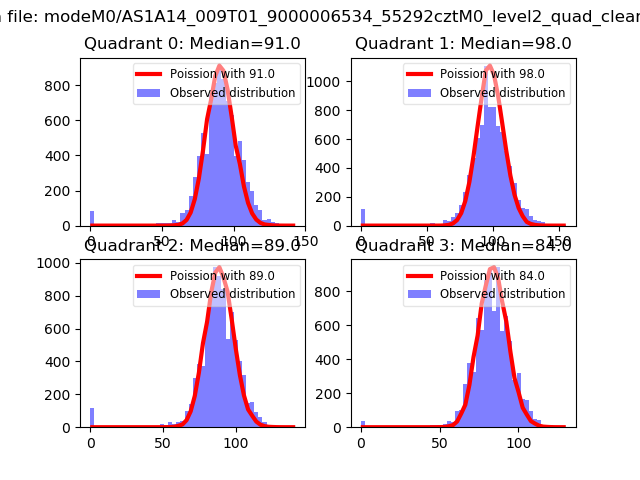 |
 |
| Quadrant-wise count rates Data is divided into 100 sec bins |
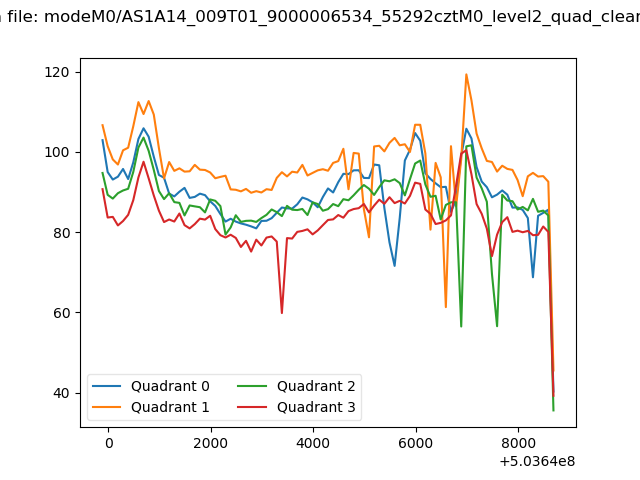 |
|
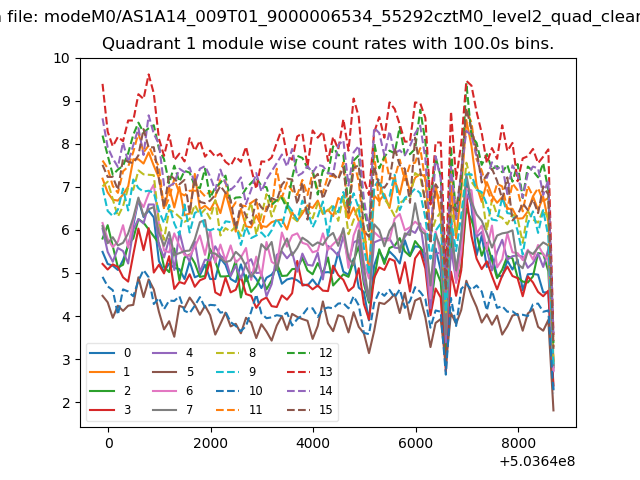
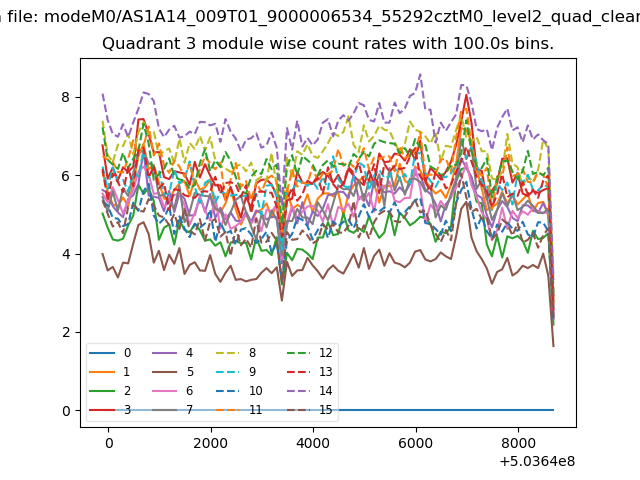
| Module-wise count rates for Quadrant A Data is divided into 100 sec bins |
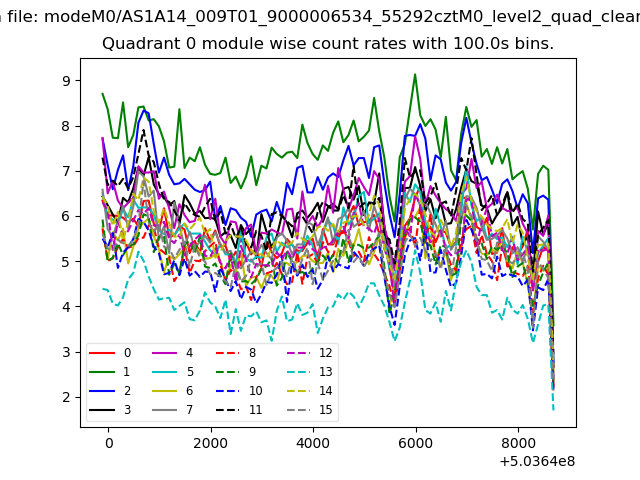 |
 |
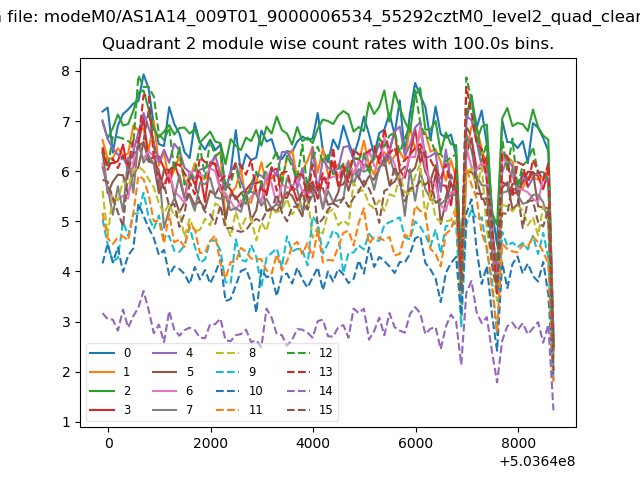
| Module-wise count rates for Quadrant B Data is divided into 100 sec bins |
 |
 |
| Module-wise count rates for Quadrant C Data is divided into 100 sec bins |
 |
 |
| Module-wise count rates for Quadrant D Data is divided into 100 sec bins |
 |
 |
| Parameter | Plot |
|---|---|
| CZT HV Monitor | 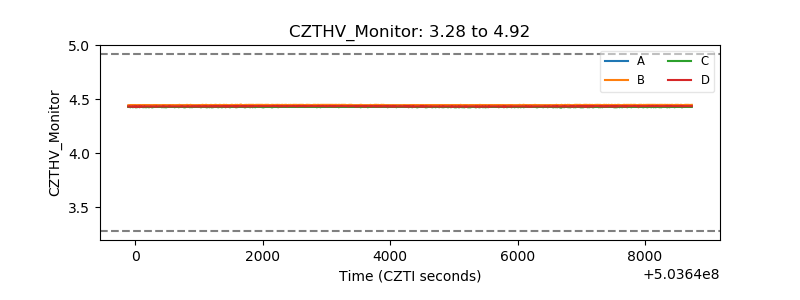 |
| D_VDD | 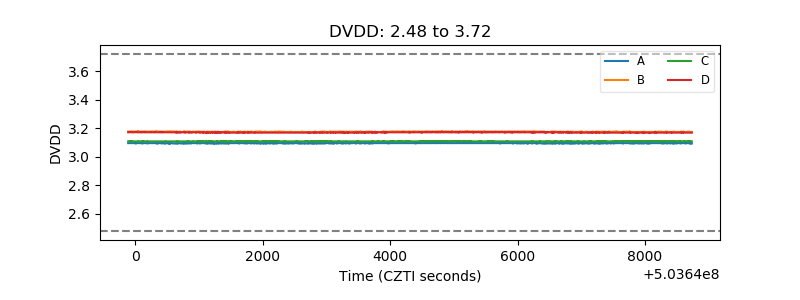 |
| Temperature 1 | 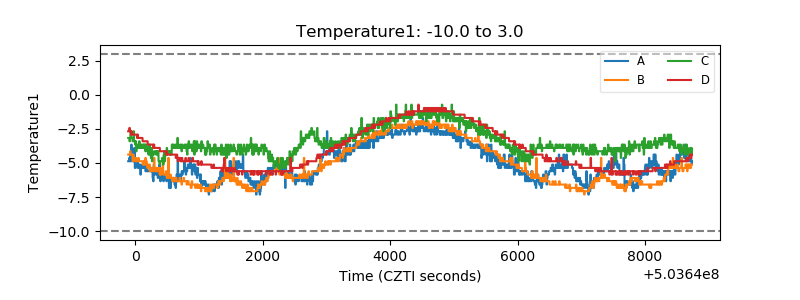 |
| Veto HV Monitor | 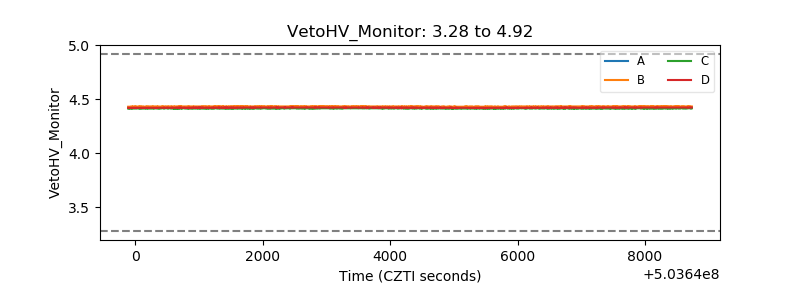 |
| Veto LLD | 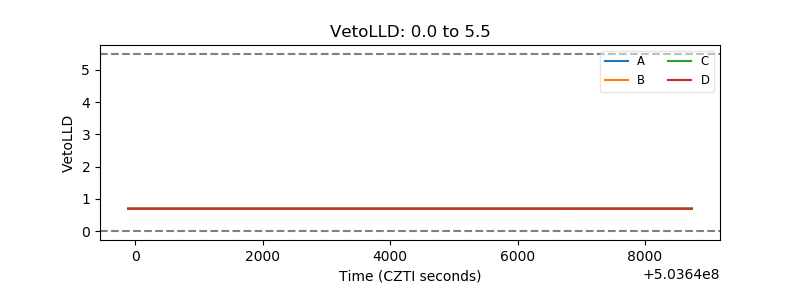 |
| Alpha Counter | 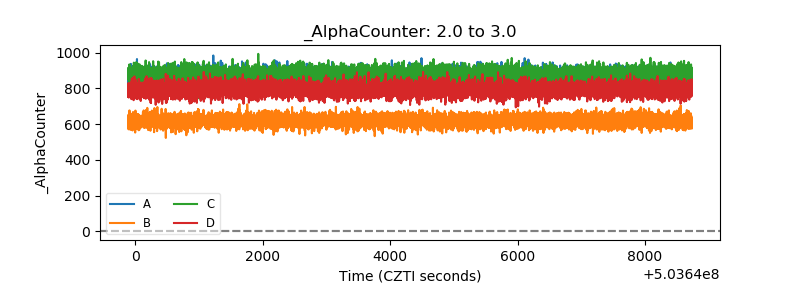 |
| _CPM_Rate | 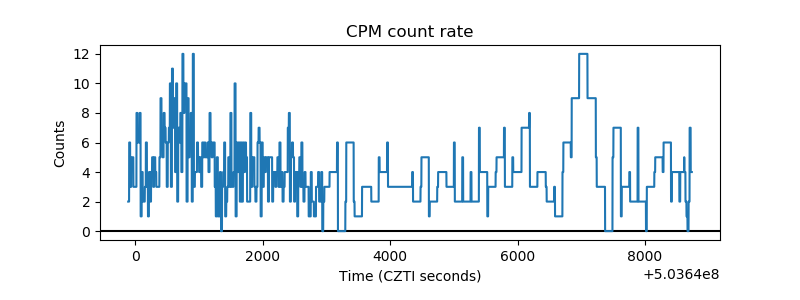 |
| CZT Counter | 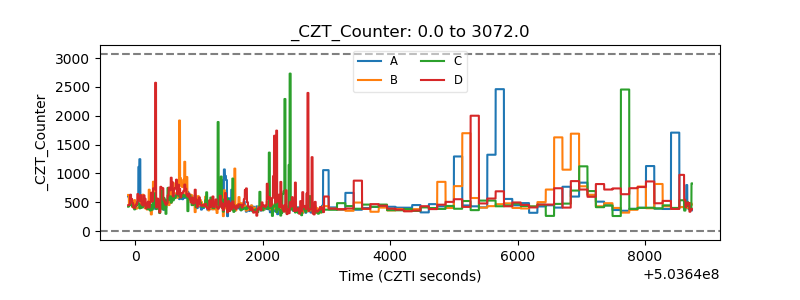 |
| +2.5 Volts monitor |  |
| +5 Volts monitor | 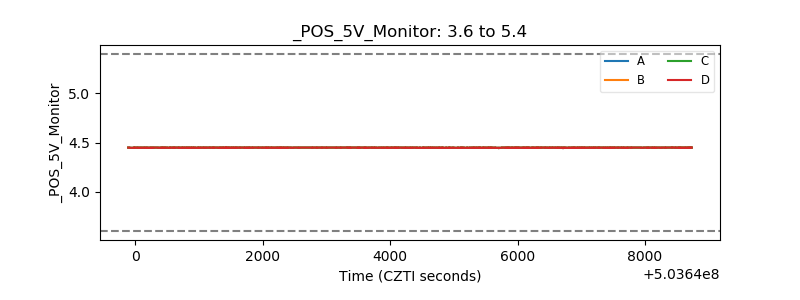 |
| _ROLL_ROT | 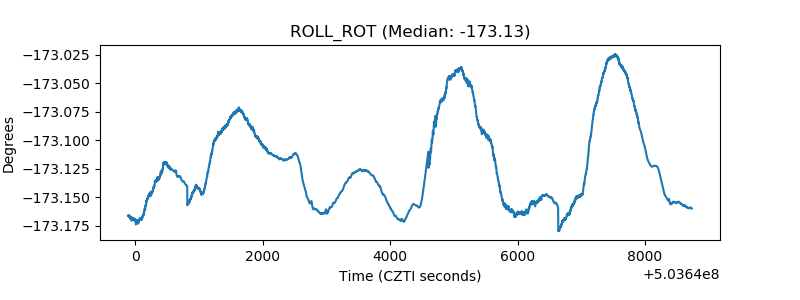 |
| _Roll_DEC | 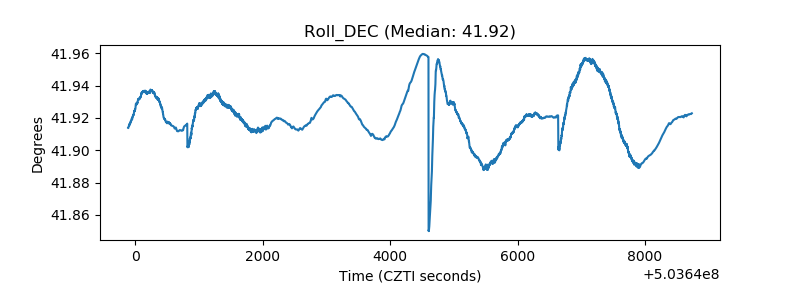 |
| _Roll_RA | 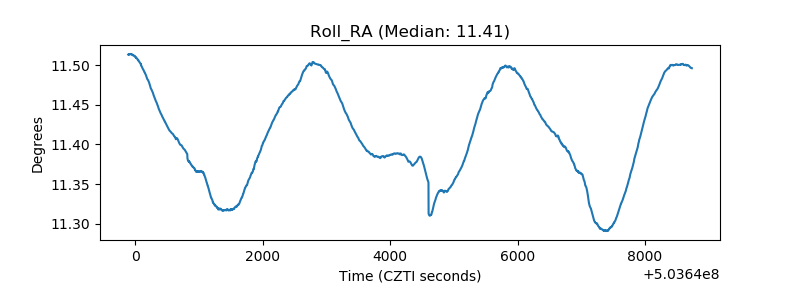 |
| Veto Counter | 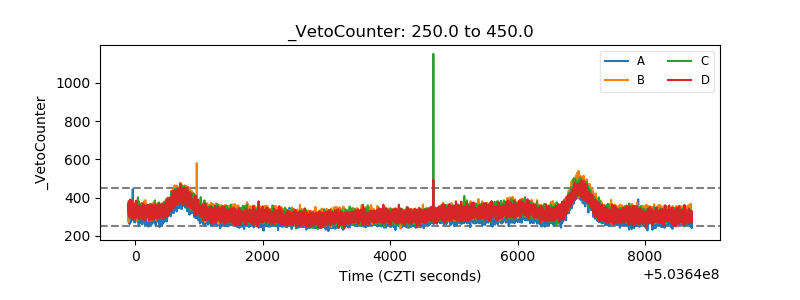 |