| Param | Original file | Final file |
|---|---|---|
| Filename | modeM0/AS1A14_009T01_9000006534_55295cztM0_level2.fits | modeM0/AS1A14_009T01_9000006534_55295cztM0_level2_quad_clean.evt |
| Size (bytes) | 1,204,637,760 | 269,516,160 |
| Size | 1.1 GB | 257.0 MB |
| Events in quadrant A | 9,345,095 | 1,741,623 |
| Events in quadrant B | 9,137,227 | 1,869,253 |
| Events in quadrant C | 11,245,787 | 1,653,076 |
| Events in quadrant D | 13,356,887 | 1,556,273 |
| Mode SS | |||
|---|---|---|---|
| Quadrant | BADHDUFLAG | Total packets | Discarded packets |
| A | 0 | 396 | 0 |
| B | 0 | 396 | 0 |
| C | 0 | 396 | 0 |
| D | 0 | 396 | 0 |
| Mode M0 | |||
|---|---|---|---|
| Quadrant | BADHDUFLAG | Total packets | Discarded packets |
| A | 0 | 42658 | 5 |
| B | 0 | 42015 | 5 |
| C | 0 | 47919 | 5 |
| D | 0 | 53636 | 5 |
| Mode M9 | |||
|---|---|---|---|
| Quadrant | BADHDUFLAG | Total packets | Discarded packets |
| A | 0 | 13 | 0 |
| B | 0 | 13 | 0 |
| C | 0 | 13 | 0 |
| D | 0 | 13 | 0 |
| Quadrant | Total seconds | Saturated seconds | Saturation percentage |
|---|---|---|---|
| A | 19447 | 514 | 2.643081% |
| B | 19446 | 572 | 2.941479% |
| C | 19446 | 867 | 4.458500% |
| D | 19446 | 948 | 4.875039% |
Noise dominated data is calculated using 1-second bins in cleaned event files. If a bin has >2000 counts, and if more than 50% of those come from <1% of pixels, then it is considered to be noise-dominated and hence unusable.
| Quadrant | # 1 sec bins | Bins with >0 counts | Bins with >2000 counts | High rate bins dominated by noise | Noise dominated (total time) | Noise dominated (detector-on time) | Marked lightcurve |
|---|---|---|---|---|---|---|---|
| A | 20757 | 19451 | 116 | 116 | 0.56% | 0.60% | 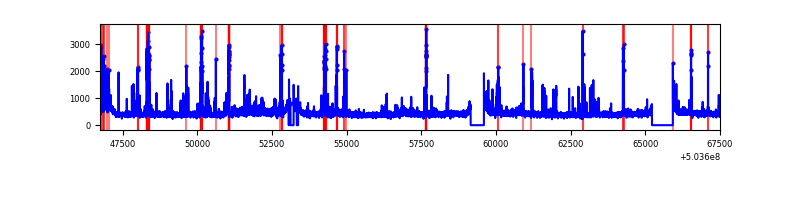 |
| B | 20756 | 19448 | 76 | 76 | 0.37% | 0.39% | 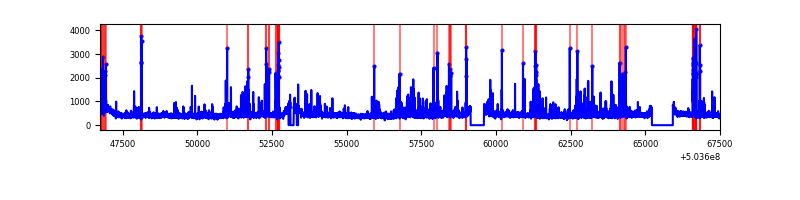 |
| C | 20756 | 19451 | 552 | 552 | 2.66% | 2.84% | 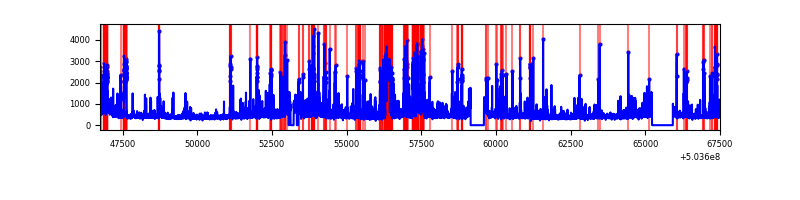 |
| D | 20756 | 19450 | 704 | 704 | 3.39% | 3.62% | 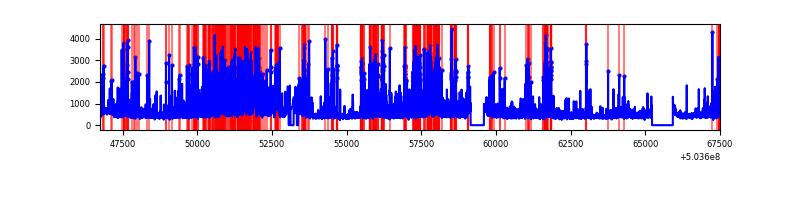 |
Top three noisy pixels from each quadrant. If the there are fewer than three noisy pixels in the level2.evt file, extra rows are filled as -1
| Pixel properties | Quadrant properties | ||||||
|---|---|---|---|---|---|---|---|
| Quadrant | DetID | PixID | Counts | Sigma | Mean | Median | Sigma |
| A | 0 | 8 | 859533 | 1693.43 | 2057 | 2002 | 506.4 |
| A | 7 | 243 | 260410 | 510.3 | 2057 | 2002 | 506.4 |
| A | 4 | 3 | 68509 | 131.34 | 2057 | 2002 | 506.4 |
| B | 5 | 185 | 264437 | 600.25 | 2026 | 1944 | 437.3 |
| B | 0 | 199 | 235047 | 533.05 | 2026 | 1944 | 437.3 |
| B | 2 | 249 | 217493 | 492.9 | 2026 | 1944 | 437.3 |
| C | 13 | 3 | 1673661 | 3091.57 | 1990 | 1976 | 540.7 |
| C | 14 | 254 | 621755 | 1146.2 | 1990 | 1976 | 540.7 |
| C | 12 | 252 | 378740 | 696.78 | 1990 | 1976 | 540.7 |
| D | 11 | 129 | 3525529 | 6293.21 | 1986 | 1897 | 559.9 |
| D | 6 | 239 | 1002953 | 1787.89 | 1986 | 1897 | 559.9 |
| D | 7 | 96 | 266974 | 473.43 | 1986 | 1897 | 559.9 |
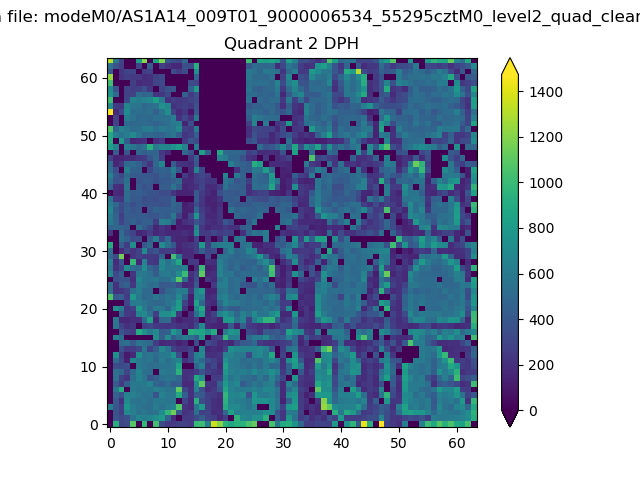
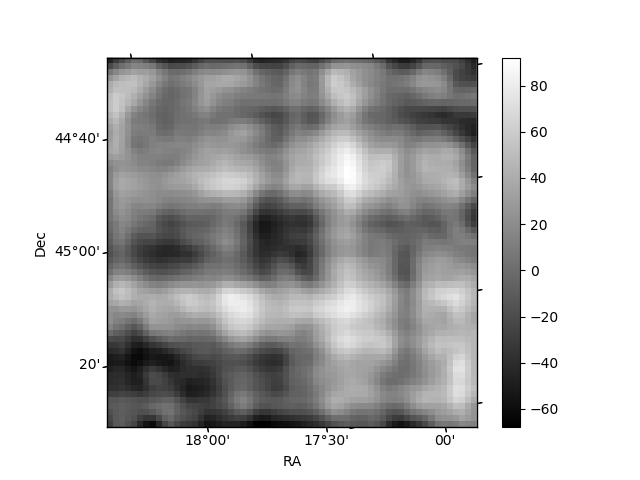
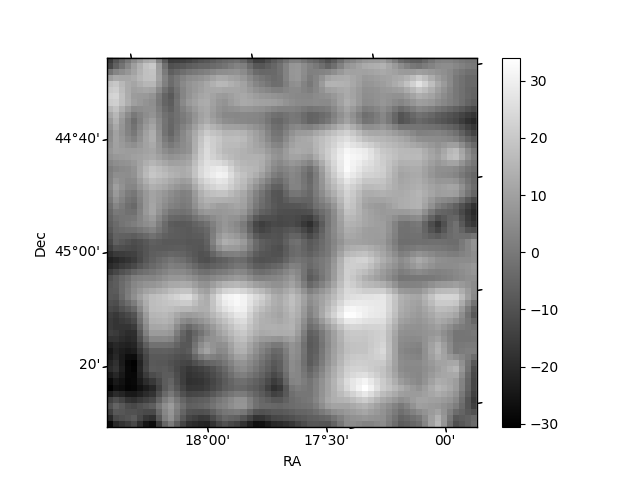
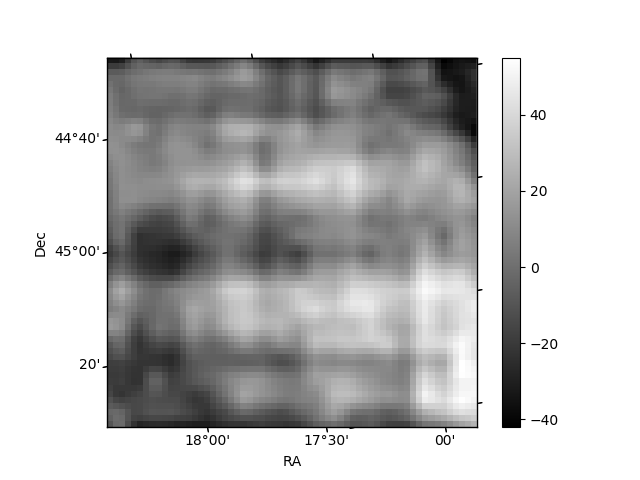
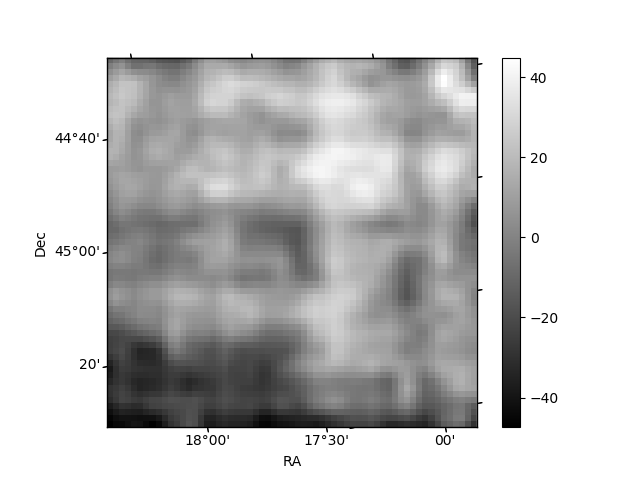
Histogram calculated using DETX and DETY for each event in the final _common_clean file
| Quadrant A | 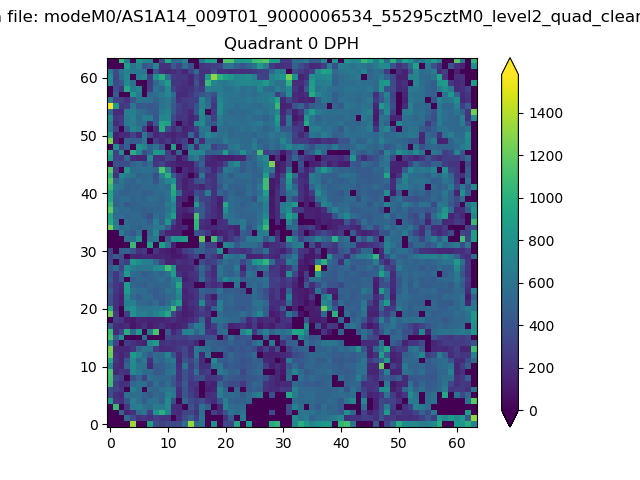 |
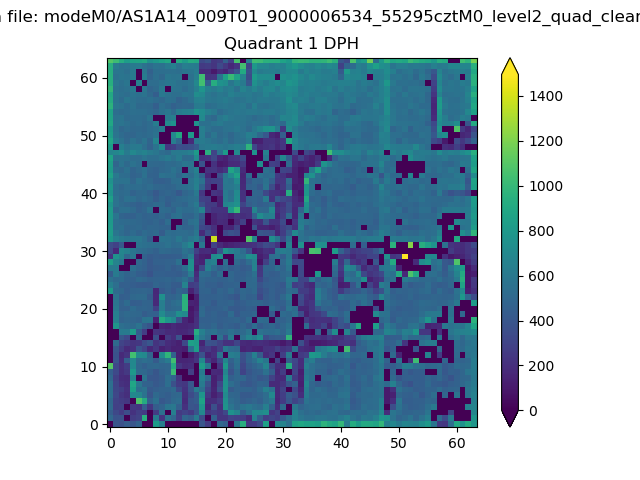 |
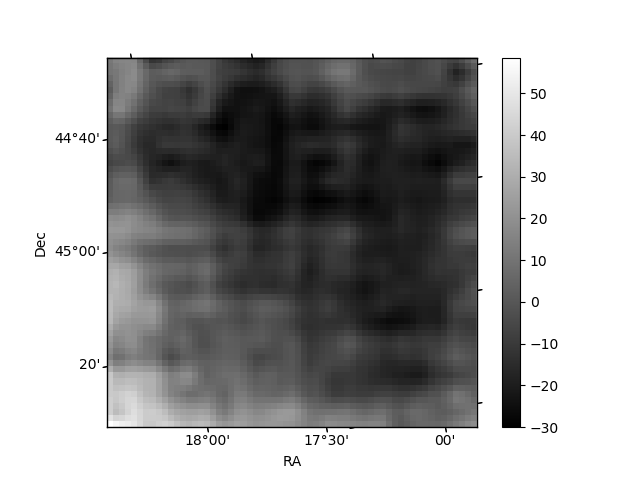
Quadrant B |
|---|---|---|---|
| Quadrant D | 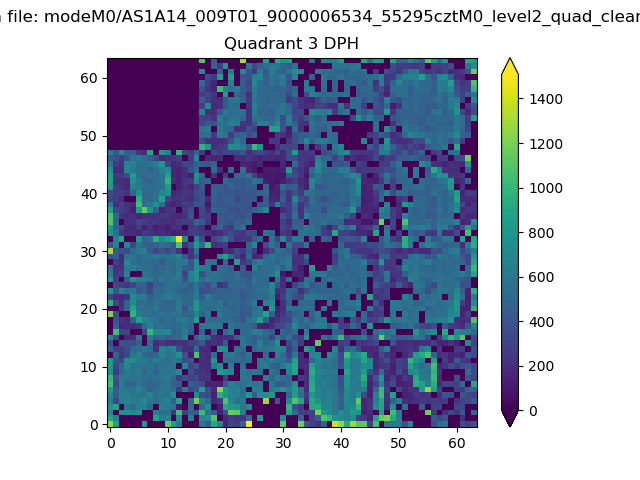 |
 |
Quadrant C |
| Plot type | Count rate plots | Images |
|---|---|---|
| Comparison with Poisson distribution Blue bars denote a histogram of data divided into 1 sec bins. Red curve is a Poisson curve with rate = median count rate of data. |
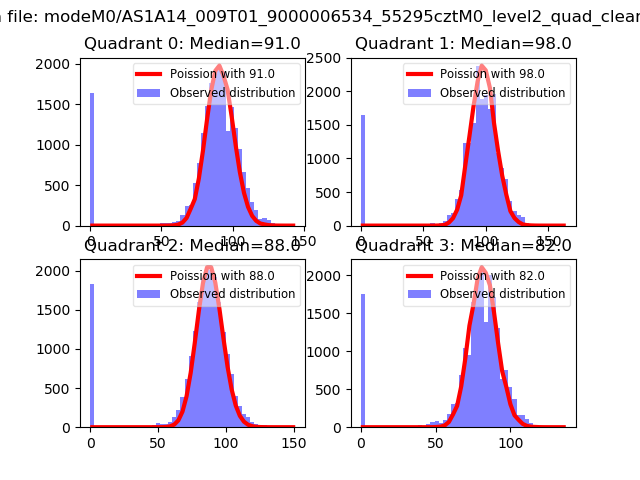 |
 |
| Quadrant-wise count rates Data is divided into 100 sec bins |
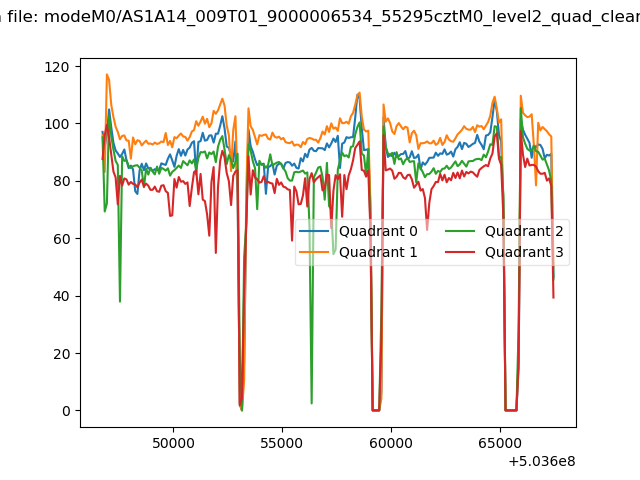 |
|
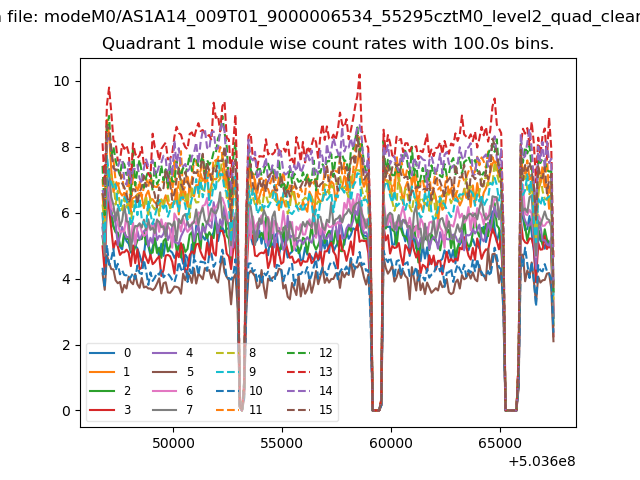
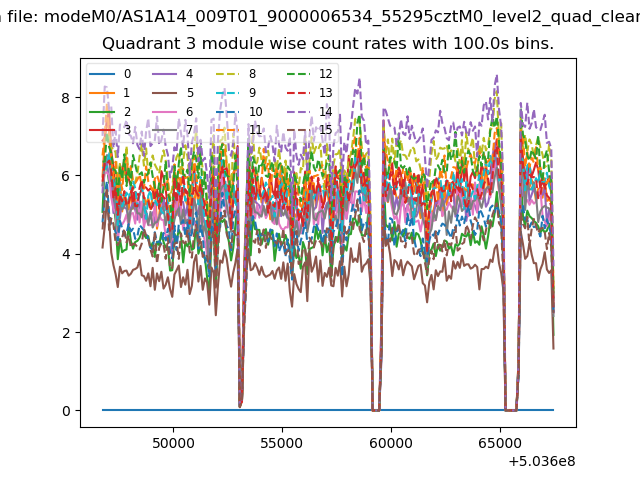
| Module-wise count rates for Quadrant A Data is divided into 100 sec bins |
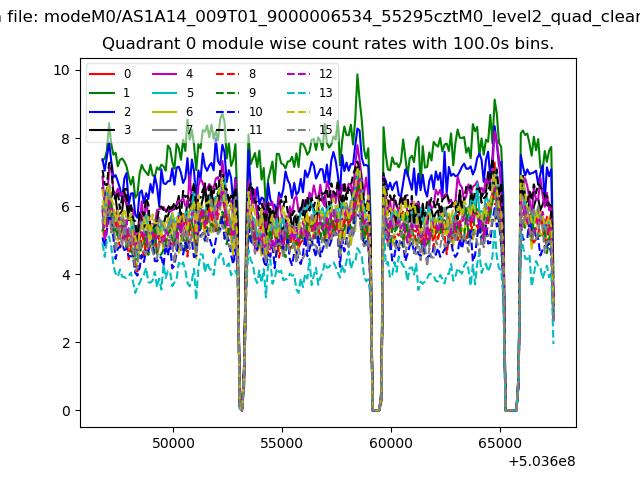 |
 |
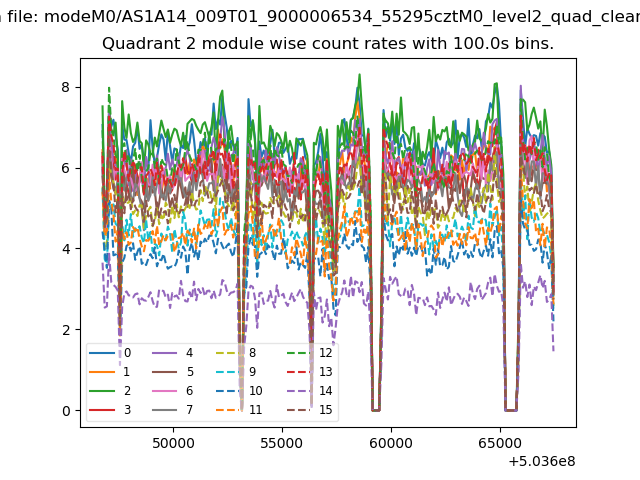
| Module-wise count rates for Quadrant B Data is divided into 100 sec bins |
 |
 |
| Module-wise count rates for Quadrant C Data is divided into 100 sec bins |
 |
 |
| Module-wise count rates for Quadrant D Data is divided into 100 sec bins |
 |
 |
| Parameter | Plot |
|---|---|
| CZT HV Monitor | 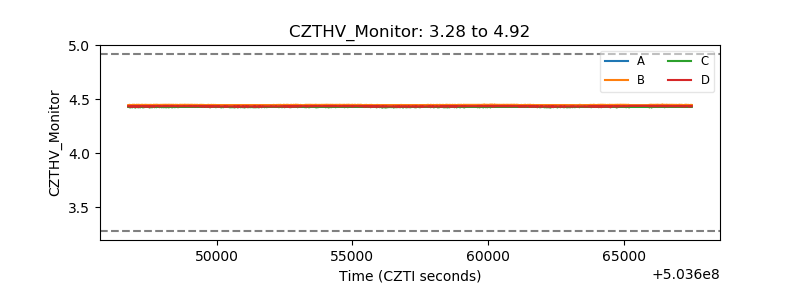 |
| D_VDD | 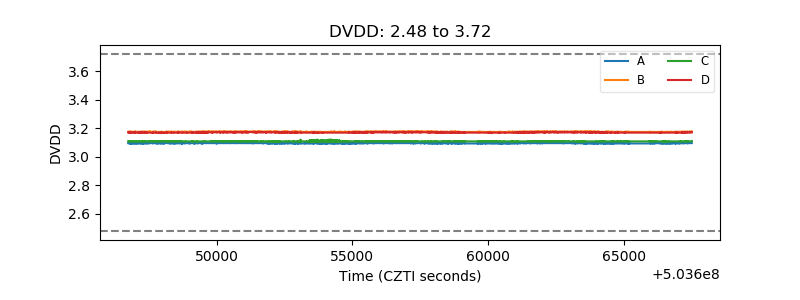 |
| Temperature 1 | 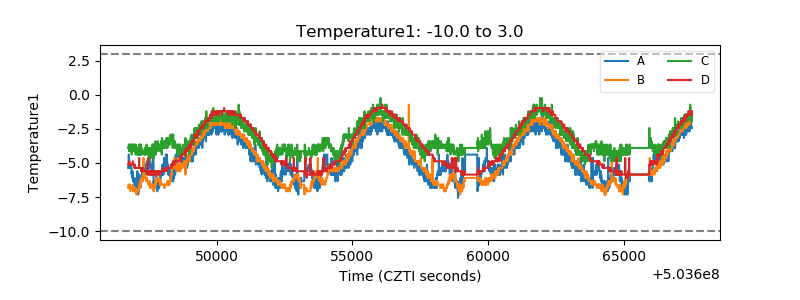 |
| Veto HV Monitor | 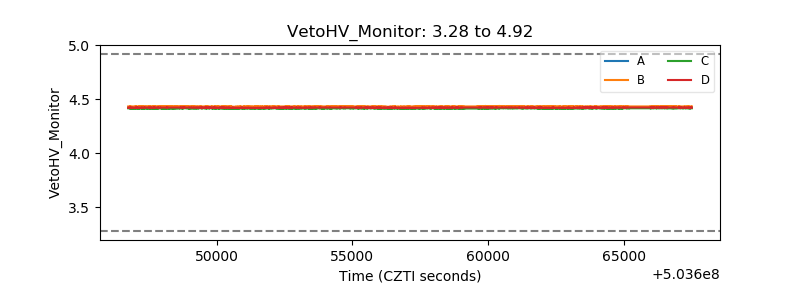 |
| Veto LLD | 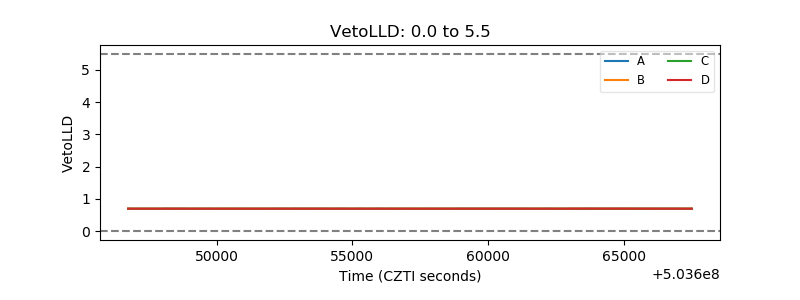 |
| Alpha Counter | 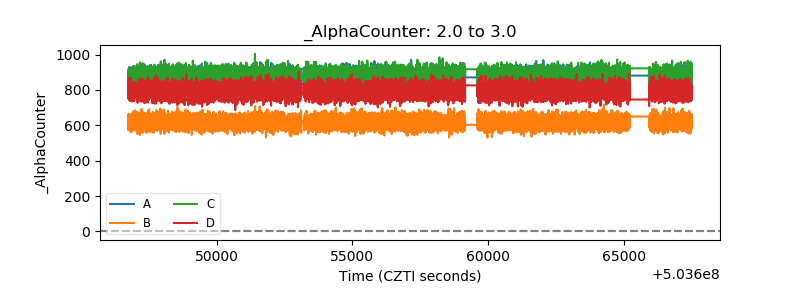 |
| _CPM_Rate | 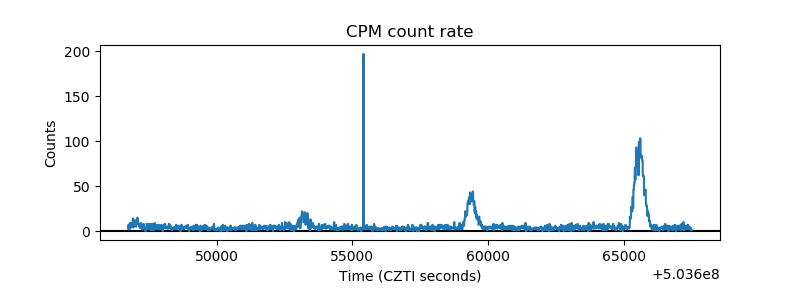 |
| CZT Counter | 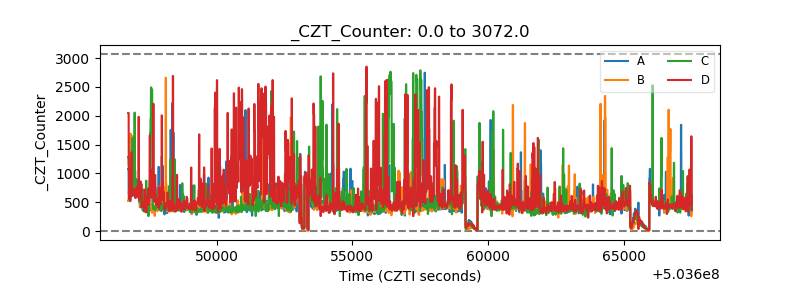 |
| +2.5 Volts monitor |  |
| +5 Volts monitor | 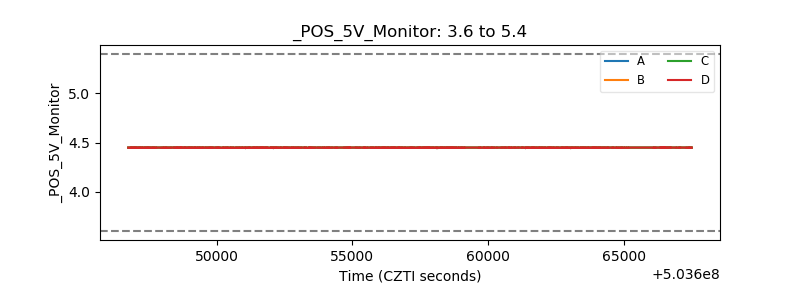 |
| _ROLL_ROT | 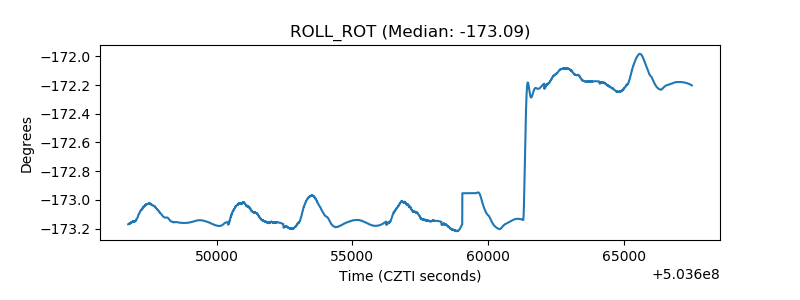 |
| _Roll_DEC | 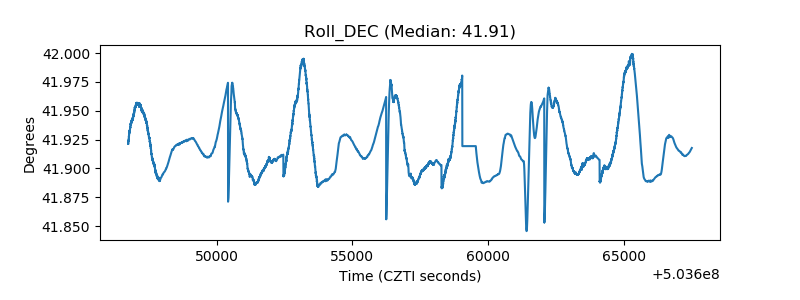 |
| _Roll_RA | 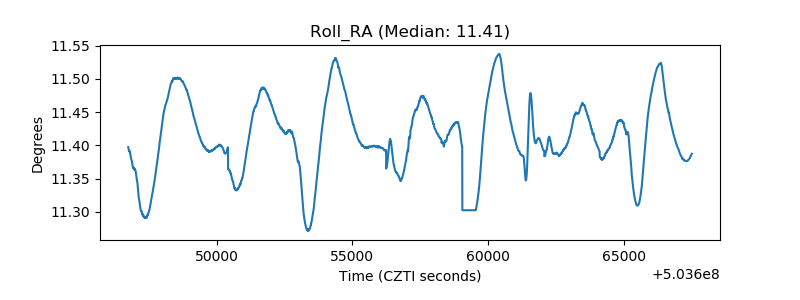 |
| Veto Counter | 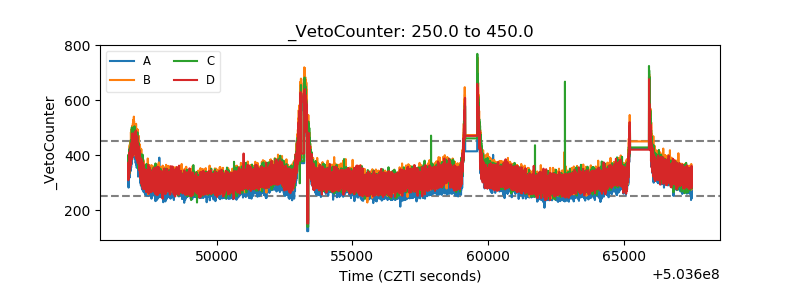 |