| Param | Original file | Final file |
|---|---|---|
| Filename | modeM0/AS1A14_009T01_9000006534_55296cztM0_level2.fits | modeM0/AS1A14_009T01_9000006534_55296cztM0_level2_quad_clean.evt |
| Size (bytes) | 398,508,480 | 89,611,200 |
| Size | 380.0 MB | 85.5 MB |
| Events in quadrant A | 2,884,447 | 589,078 |
| Events in quadrant B | 2,919,624 | 623,738 |
| Events in quadrant C | 3,504,074 | 555,374 |
| Events in quadrant D | 4,952,283 | 505,566 |
| Mode SS | |||
|---|---|---|---|
| Quadrant | BADHDUFLAG | Total packets | Discarded packets |
| A | 0 | 126 | 0 |
| B | 0 | 126 | 0 |
| C | 0 | 126 | 0 |
| D | 0 | 126 | 0 |
| Mode M0 | |||
|---|---|---|---|
| Quadrant | BADHDUFLAG | Total packets | Discarded packets |
| A | 0 | 13414 | 1 |
| B | 0 | 13462 | 1 |
| C | 0 | 15073 | 1 |
| D | 0 | 19092 | 1 |
| Mode M9 | |||
|---|---|---|---|
| Quadrant | BADHDUFLAG | Total packets | Discarded packets |
| A | 0 | 9 | 0 |
| B | 0 | 9 | 0 |
| C | 0 | 9 | 0 |
| D | 0 | 9 | 0 |
| Quadrant | Total seconds | Saturated seconds | Saturation percentage |
|---|---|---|---|
| A | 6308 | 96 | 1.521877% |
| B | 6308 | 106 | 1.680406% |
| C | 6309 | 161 | 2.551910% |
| D | 6309 | 487 | 7.719131% |
Noise dominated data is calculated using 1-second bins in cleaned event files. If a bin has >2000 counts, and if more than 50% of those come from <1% of pixels, then it is considered to be noise-dominated and hence unusable.
| Quadrant | # 1 sec bins | Bins with >0 counts | Bins with >2000 counts | High rate bins dominated by noise | Noise dominated (total time) | Noise dominated (detector-on time) | Marked lightcurve |
|---|---|---|---|---|---|---|---|
| A | 7148 | 6308 | 44 | 44 | 0.62% | 0.70% | 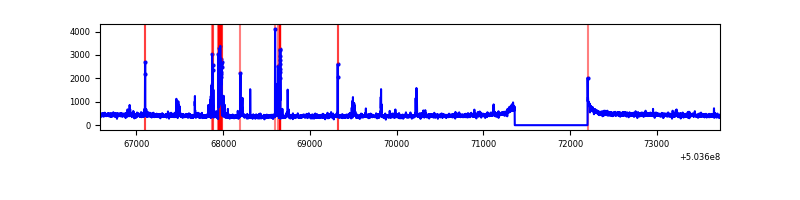 |
| B | 7148 | 6308 | 24 | 24 | 0.34% | 0.38% | 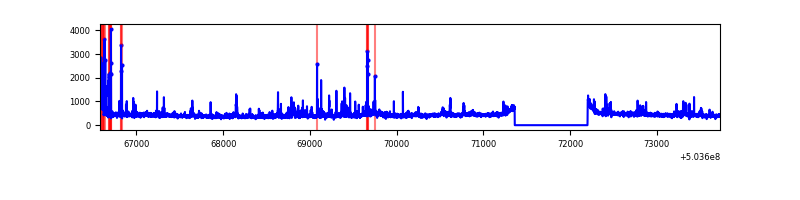 |
| C | 7149 | 6310 | 123 | 123 | 1.72% | 1.95% | 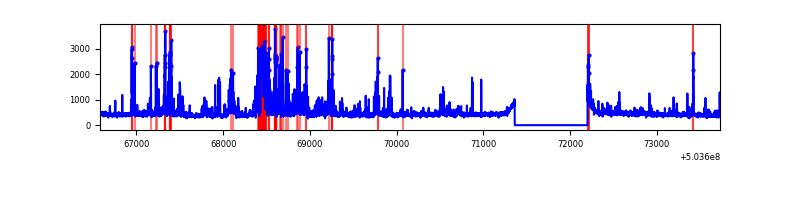 |
| D | 7149 | 6309 | 423 | 423 | 5.92% | 6.70% | 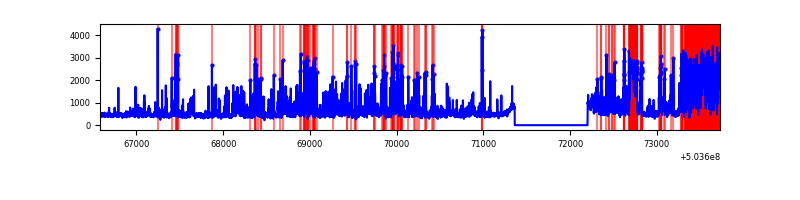 |
Top three noisy pixels from each quadrant. If the there are fewer than three noisy pixels in the level2.evt file, extra rows are filled as -1
| Pixel properties | Quadrant properties | ||||||
|---|---|---|---|---|---|---|---|
| Quadrant | DetID | PixID | Counts | Sigma | Mean | Median | Sigma |
| A | 0 | 8 | 210260 | 1283.54 | 660 | 644 | 163.3 |
| A | 4 | 205 | 47442 | 286.56 | 660 | 644 | 163.3 |
| A | 4 | 3 | 22750 | 135.36 | 660 | 644 | 163.3 |
| B | 2 | 249 | 163332 | 1165.04 | 646 | 623 | 139.7 |
| B | 0 | 199 | 75429 | 535.63 | 646 | 623 | 139.7 |
| B | 7 | 252 | 35747 | 251.5 | 646 | 623 | 139.7 |
| C | 9 | 38 | 422210 | 2408.29 | 635 | 628 | 175.1 |
| C | 13 | 3 | 253271 | 1443.22 | 635 | 628 | 175.1 |
| C | 12 | 252 | 124447 | 707.32 | 635 | 628 | 175.1 |
| D | 11 | 129 | 1996889 | 11274.95 | 625 | 599 | 177.1 |
| D | 6 | 239 | 140016 | 787.42 | 625 | 599 | 177.1 |
| D | 7 | 96 | 132007 | 742.19 | 625 | 599 | 177.1 |
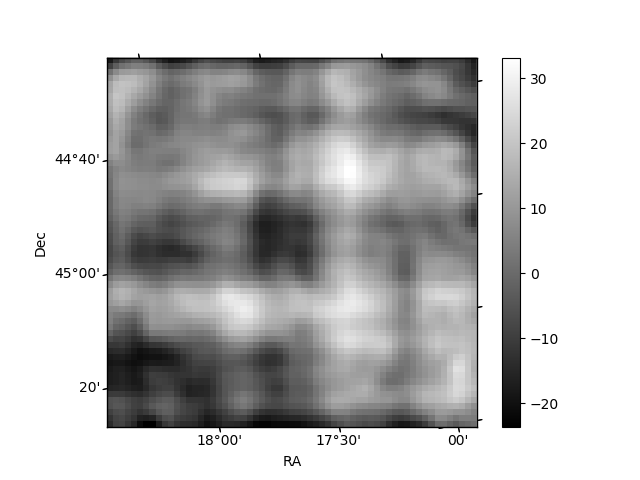
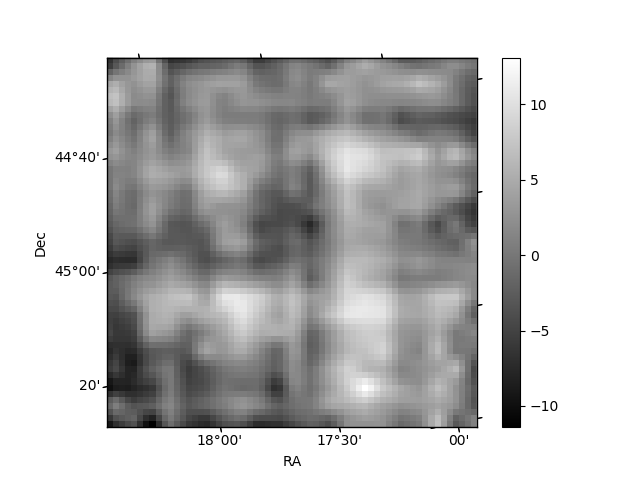
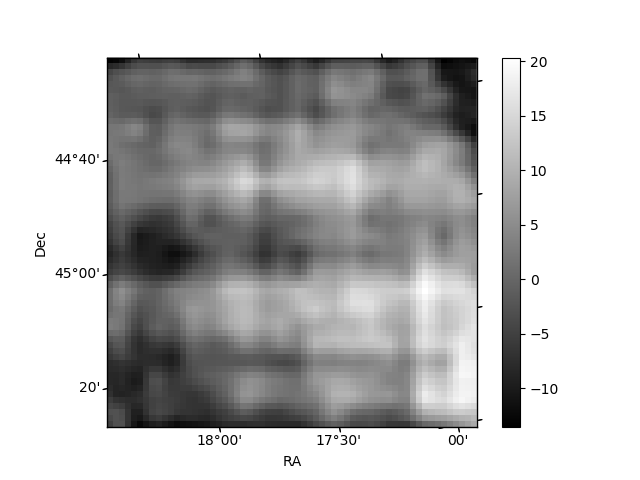
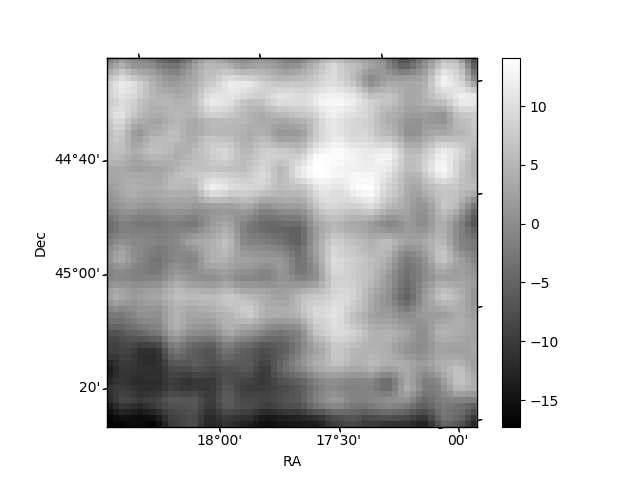
Histogram calculated using DETX and DETY for each event in the final _common_clean file
| Quadrant A | 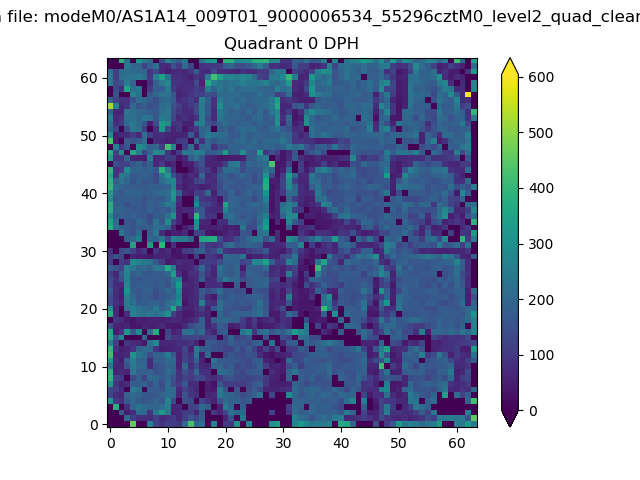 |
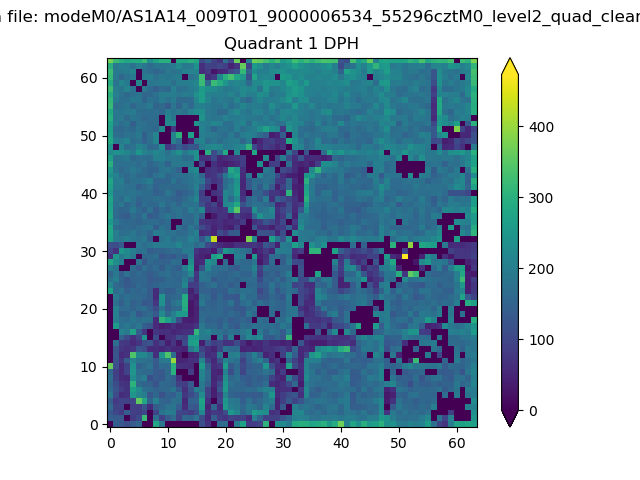 |
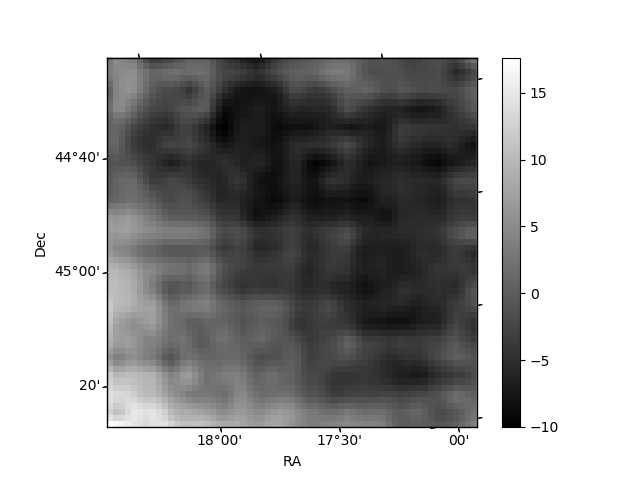
Quadrant B |
|---|---|---|---|
| Quadrant D | 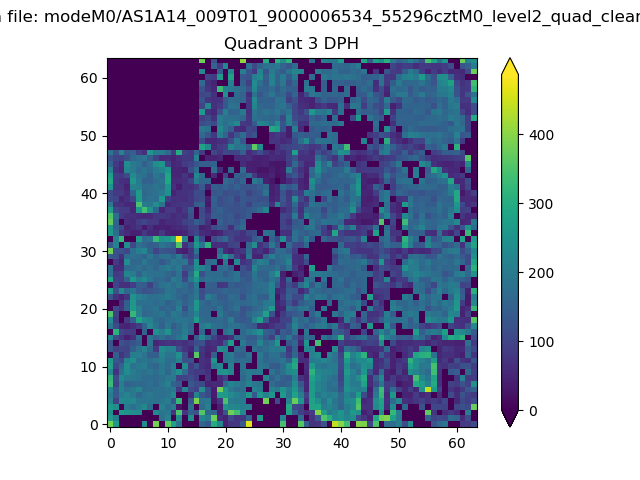 |
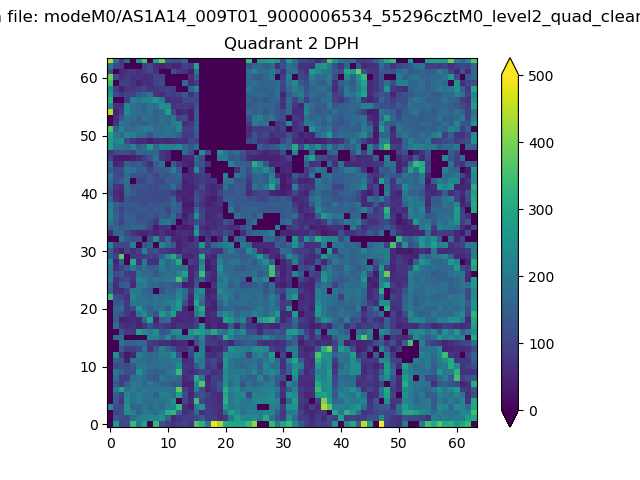 |
Quadrant C |
| Plot type | Count rate plots | Images |
|---|---|---|
| Comparison with Poisson distribution Blue bars denote a histogram of data divided into 1 sec bins. Red curve is a Poisson curve with rate = median count rate of data. |
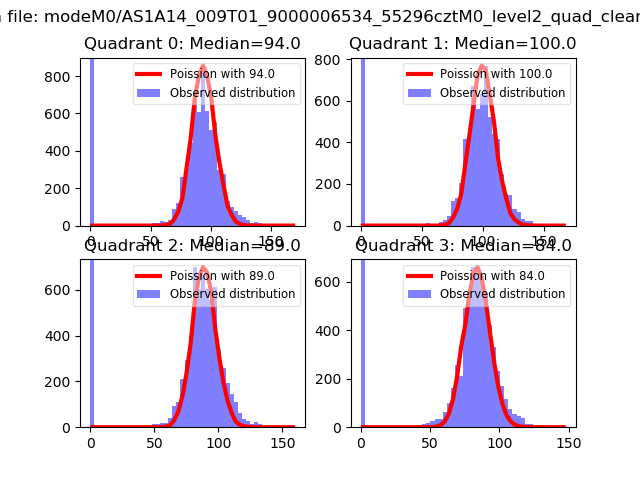 |
 |
| Quadrant-wise count rates Data is divided into 100 sec bins |
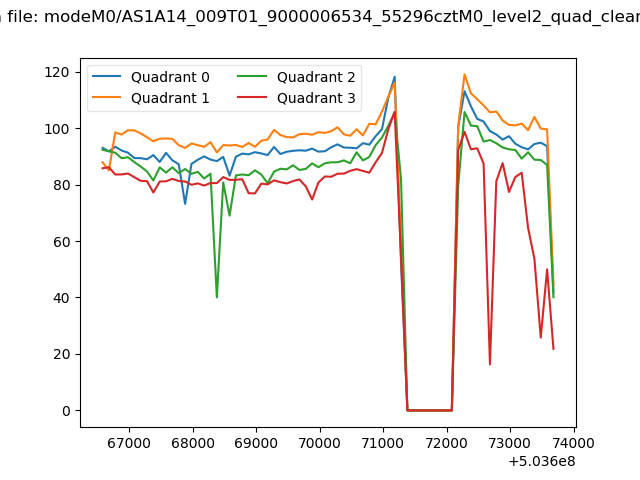 |
|
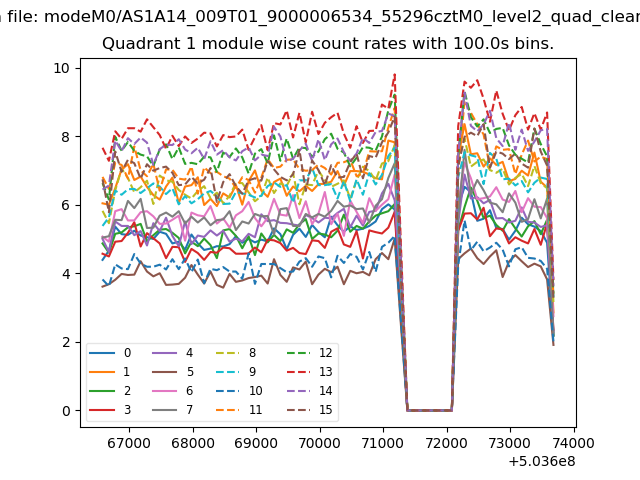
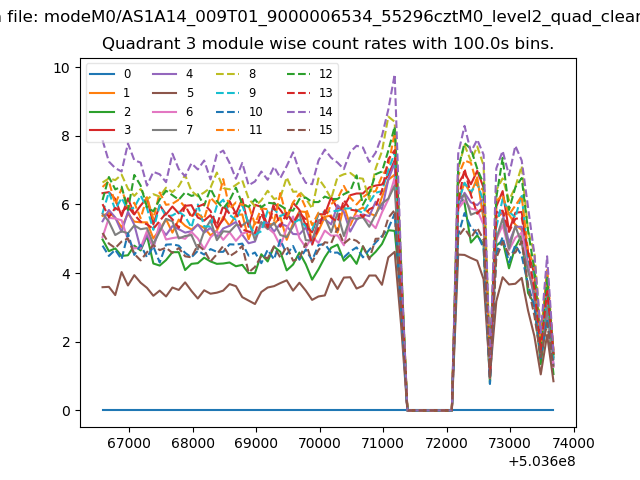
| Module-wise count rates for Quadrant A Data is divided into 100 sec bins |
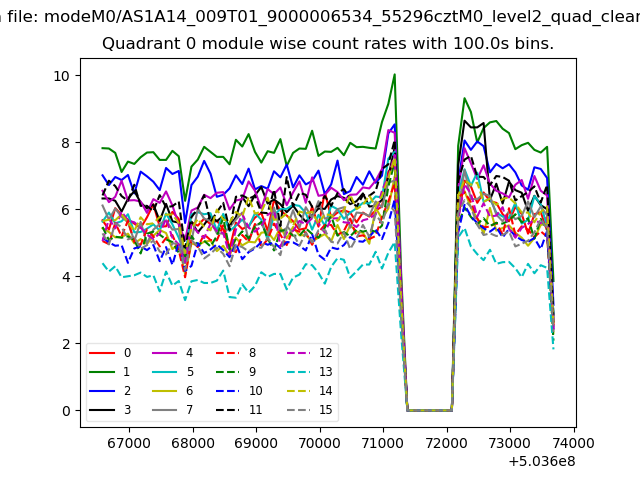 |
 |
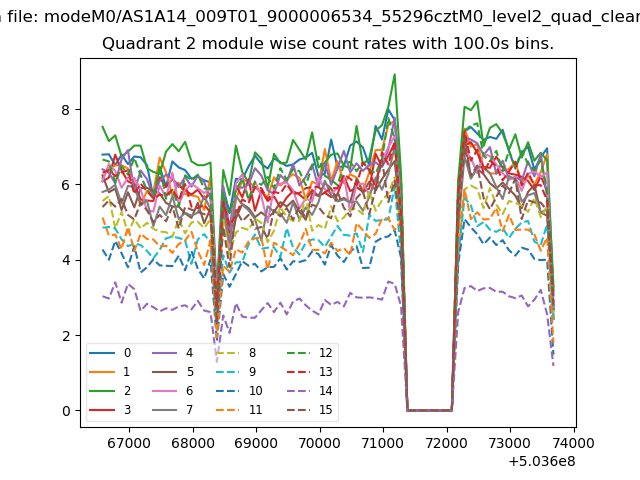
| Module-wise count rates for Quadrant B Data is divided into 100 sec bins |
 |
 |
| Module-wise count rates for Quadrant C Data is divided into 100 sec bins |
 |
 |
| Module-wise count rates for Quadrant D Data is divided into 100 sec bins |
 |
 |
| Parameter | Plot |
|---|---|
| CZT HV Monitor | 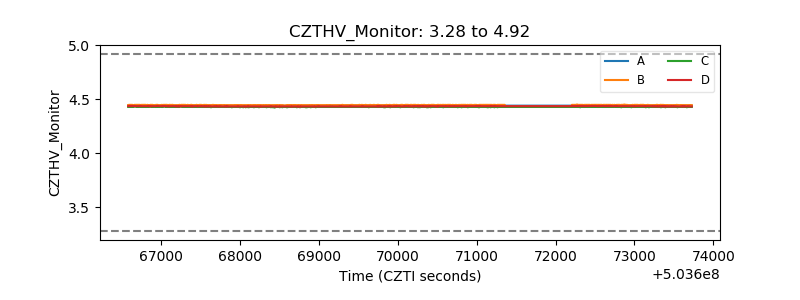 |
| D_VDD | 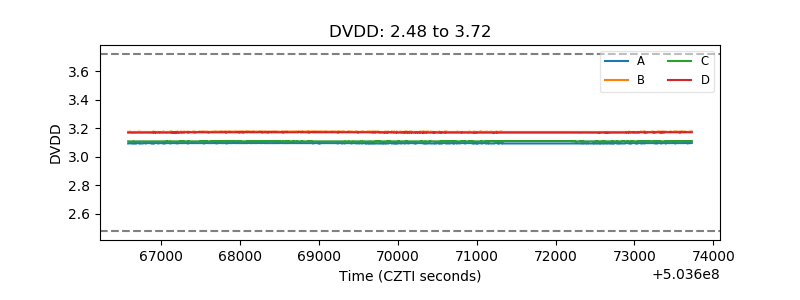 |
| Temperature 1 | 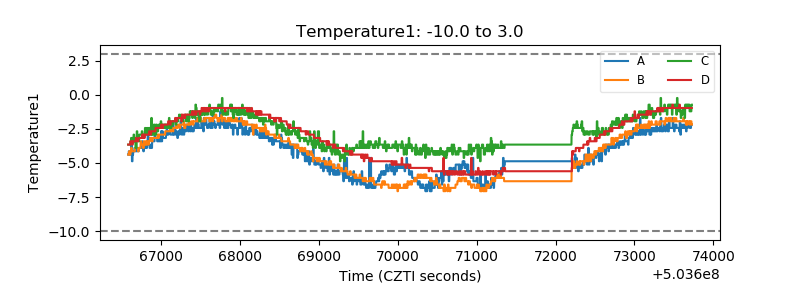 |
| Veto HV Monitor | 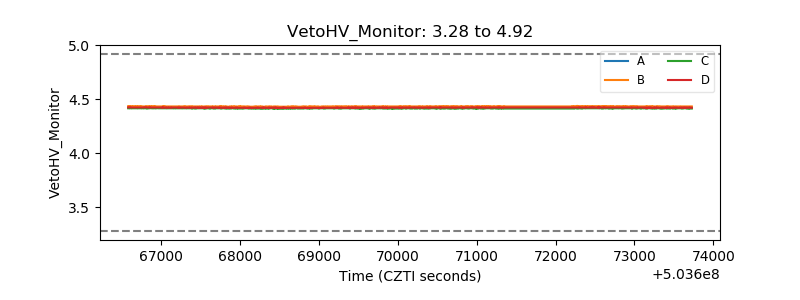 |
| Veto LLD | 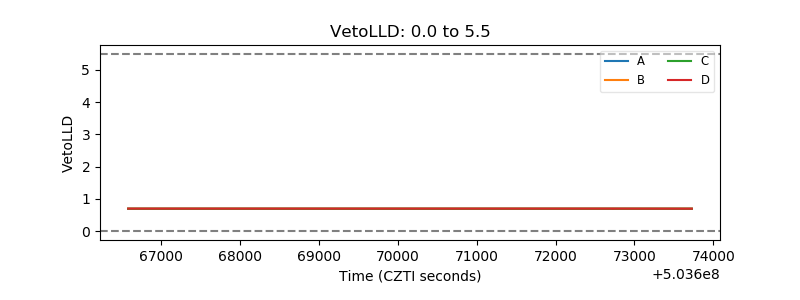 |
| Alpha Counter | 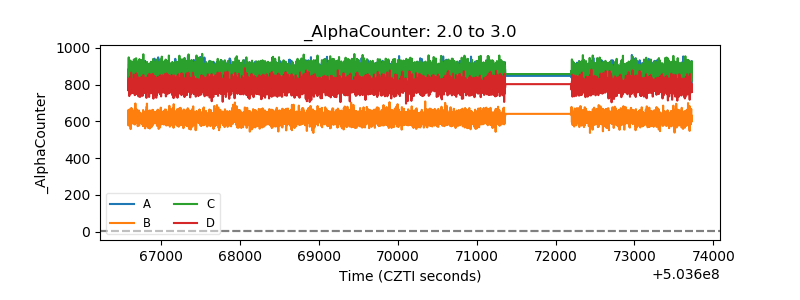 |
| _CPM_Rate | 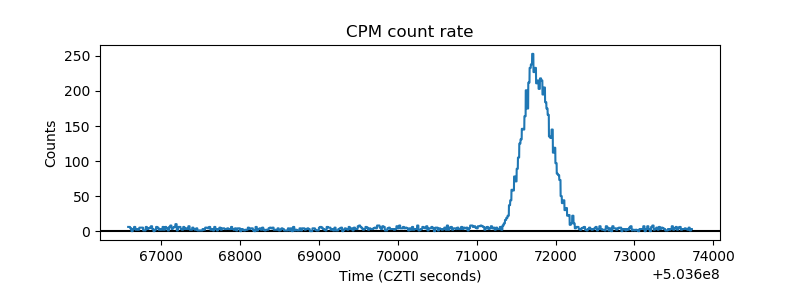 |
| CZT Counter | 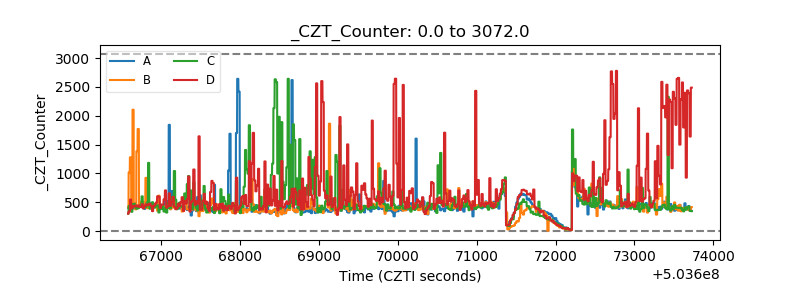 |
| +2.5 Volts monitor | 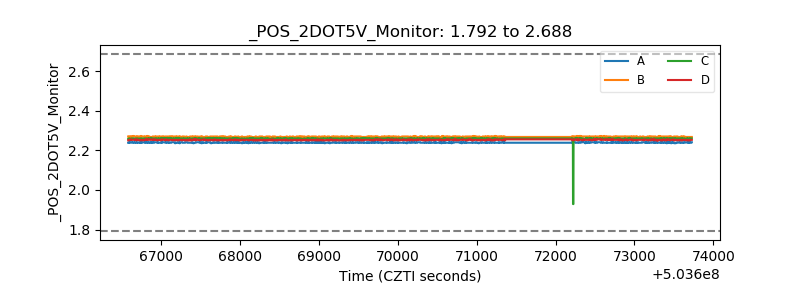 |
| +5 Volts monitor | 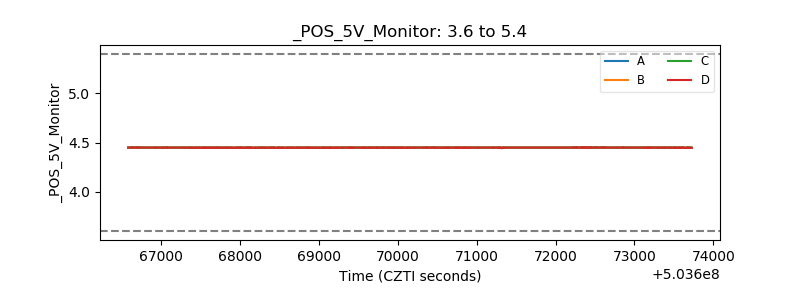 |
| _ROLL_ROT | 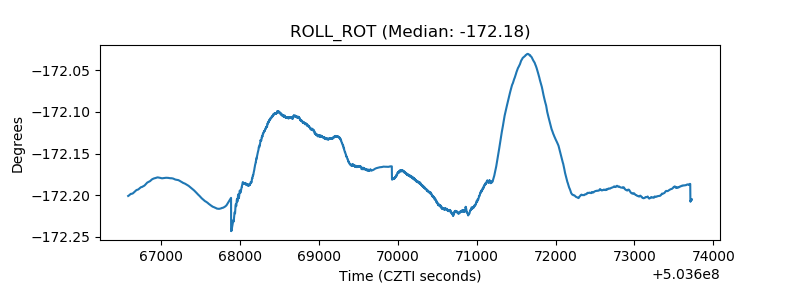 |
| _Roll_DEC | 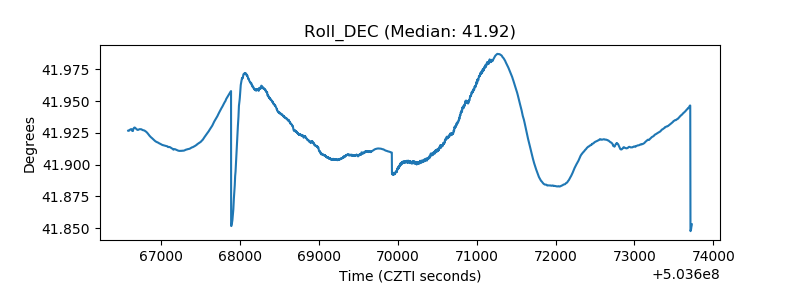 |
| _Roll_RA | 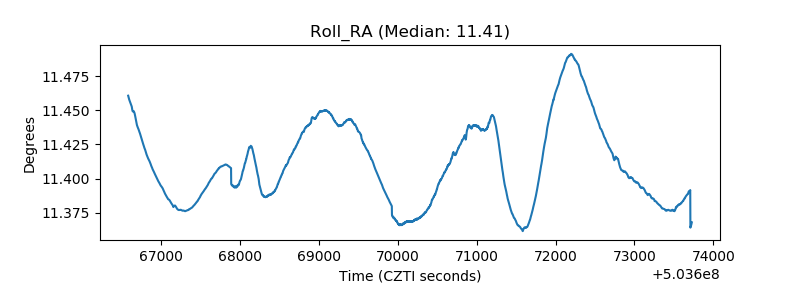 |
| Veto Counter | 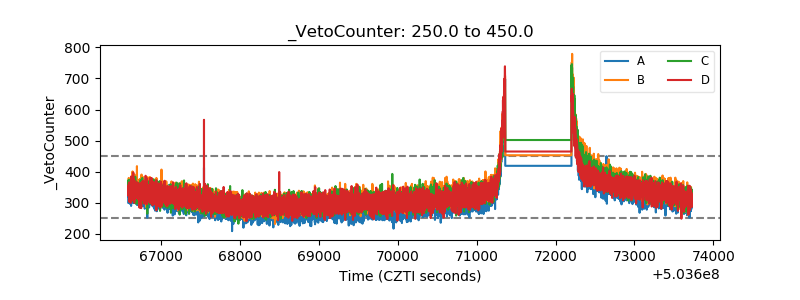 |