| Param | Original file | Final file |
|---|---|---|
| Filename | modeM0/AS1A14_009T01_9000006534_55298cztM0_level2.fits | modeM0/AS1A14_009T01_9000006534_55298cztM0_level2_quad_clean.evt |
| Size (bytes) | 456,566,400 | 97,925,760 |
| Size | 435.4 MB | 93.4 MB |
| Events in quadrant A | 3,005,408 | 650,792 |
| Events in quadrant B | 3,140,286 | 690,969 |
| Events in quadrant C | 3,423,367 | 618,303 |
| Events in quadrant D | 6,803,455 | 531,970 |
| Mode SS | |||
|---|---|---|---|
| Quadrant | BADHDUFLAG | Total packets | Discarded packets |
| A | 0 | 138 | 0 |
| B | 0 | 138 | 0 |
| C | 0 | 138 | 0 |
| D | 0 | 138 | 0 |
| Mode M0 | |||
|---|---|---|---|
| Quadrant | BADHDUFLAG | Total packets | Discarded packets |
| A | 0 | 14052 | 1 |
| B | 0 | 14474 | 1 |
| C | 0 | 15342 | 1 |
| D | 0 | 24929 | 3 |
| Mode M9 | |||
|---|---|---|---|
| Quadrant | BADHDUFLAG | Total packets | Discarded packets |
| A | 0 | 10 | 0 |
| B | 0 | 10 | 0 |
| C | 0 | 10 | 0 |
| D | 0 | 10 | 0 |
| Quadrant | Total seconds | Saturated seconds | Saturation percentage |
|---|---|---|---|
| A | 6788 | 58 | 0.854449% |
| B | 6788 | 84 | 1.237478% |
| C | 6789 | 115 | 1.693917% |
| D | 6788 | 928 | 13.671184% |
Noise dominated data is calculated using 1-second bins in cleaned event files. If a bin has >2000 counts, and if more than 50% of those come from <1% of pixels, then it is considered to be noise-dominated and hence unusable.
| Quadrant | # 1 sec bins | Bins with >0 counts | Bins with >2000 counts | High rate bins dominated by noise | Noise dominated (total time) | Noise dominated (detector-on time) | Marked lightcurve |
|---|---|---|---|---|---|---|---|
| A | 7783 | 6788 | 8 | 8 | 0.10% | 0.12% | 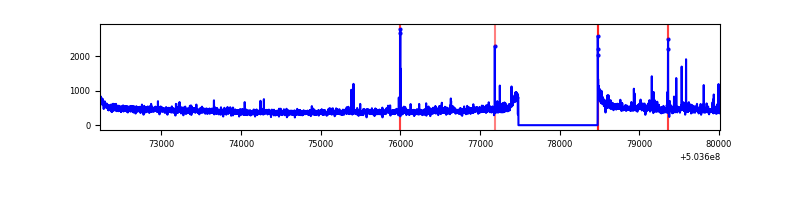 |
| B | 7783 | 6789 | 32 | 32 | 0.41% | 0.47% | 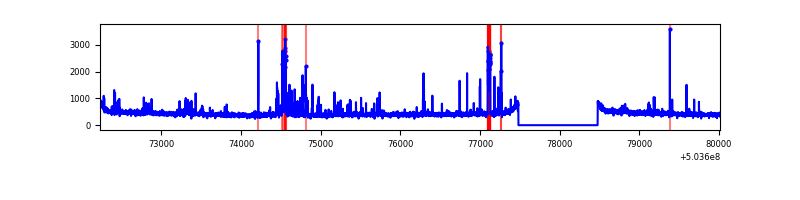 |
| C | 7784 | 6790 | 100 | 100 | 1.28% | 1.47% | 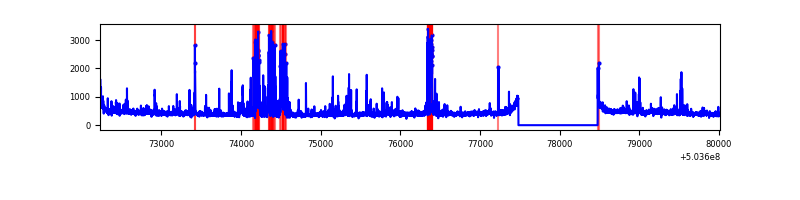 |
| D | 7783 | 6788 | 860 | 860 | 11.05% | 12.67% | 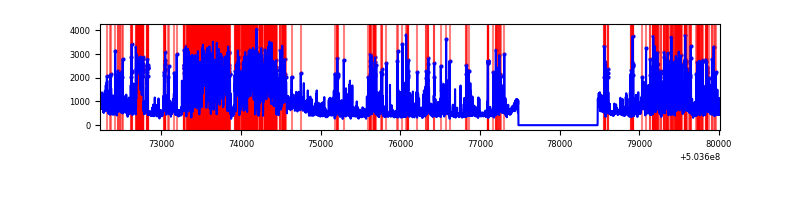 |
Top three noisy pixels from each quadrant. If the there are fewer than three noisy pixels in the level2.evt file, extra rows are filled as -1
| Pixel properties | Quadrant properties | ||||||
|---|---|---|---|---|---|---|---|
| Quadrant | DetID | PixID | Counts | Sigma | Mean | Median | Sigma |
| A | 7 | 7 | 37468 | 207.13 | 723 | 704 | 177.5 |
| A | 4 | 3 | 35610 | 196.67 | 723 | 704 | 177.5 |
| A | 3 | 78 | 35112 | 193.86 | 723 | 704 | 177.5 |
| B | 2 | 249 | 81362 | 530.27 | 709 | 685 | 152.1 |
| B | 0 | 199 | 75919 | 494.5 | 709 | 685 | 152.1 |
| B | 10 | 245 | 73496 | 478.57 | 709 | 685 | 152.1 |
| C | 9 | 38 | 281381 | 1461.61 | 699 | 692 | 192.0 |
| C | 13 | 3 | 241474 | 1253.81 | 699 | 692 | 192.0 |
| C | 14 | 254 | 65390 | 336.9 | 699 | 692 | 192.0 |
| D | 11 | 129 | 2825717 | 14798.51 | 673 | 646 | 190.9 |
| D | 3 | 12 | 336815 | 1760.95 | 673 | 646 | 190.9 |
| D | 6 | 239 | 325106 | 1699.61 | 673 | 646 | 190.9 |
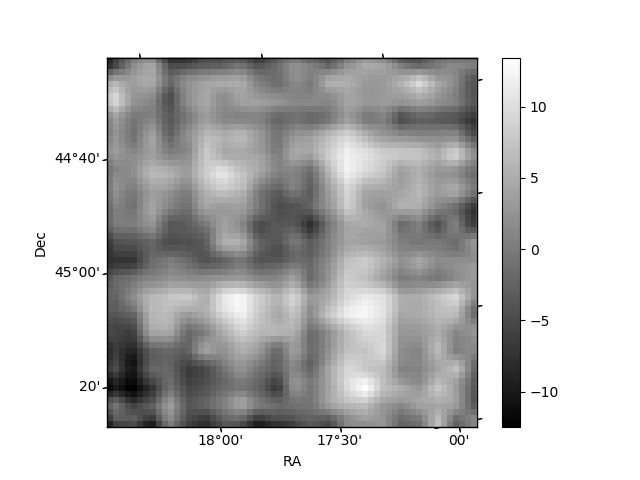
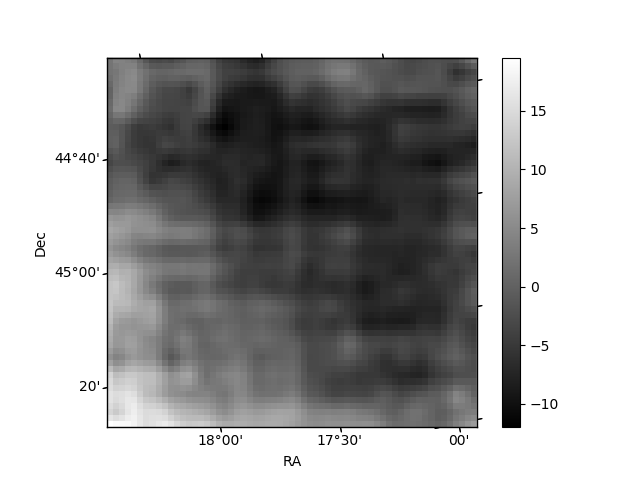
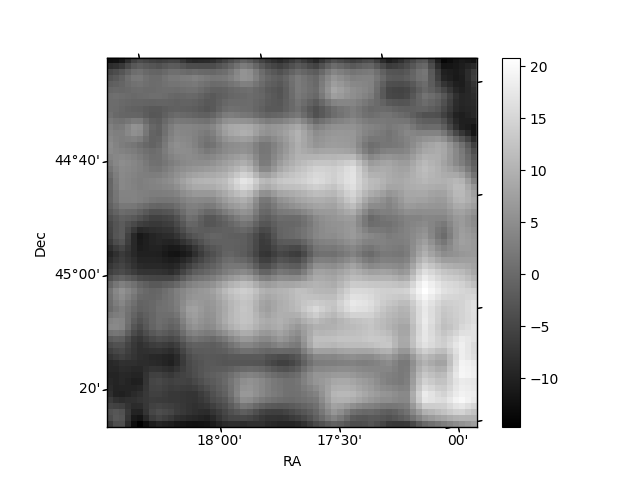
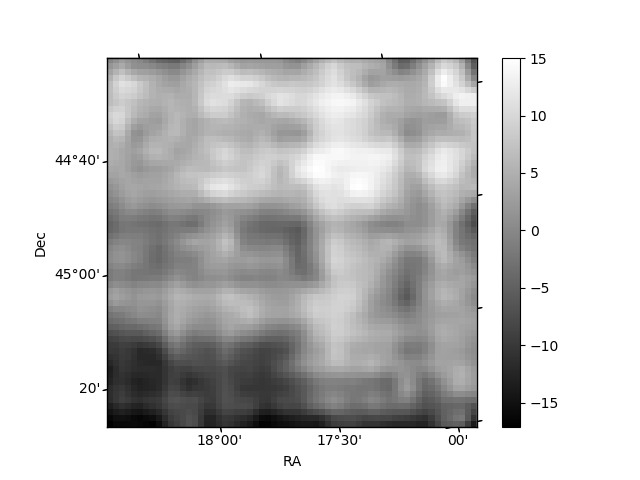
Histogram calculated using DETX and DETY for each event in the final _common_clean file
| Quadrant A | 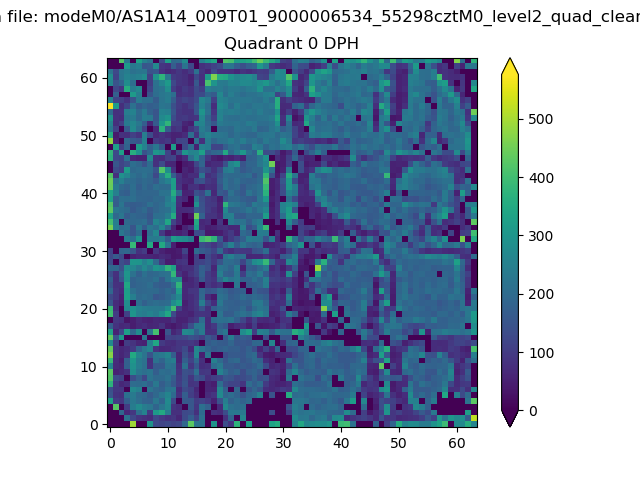 |
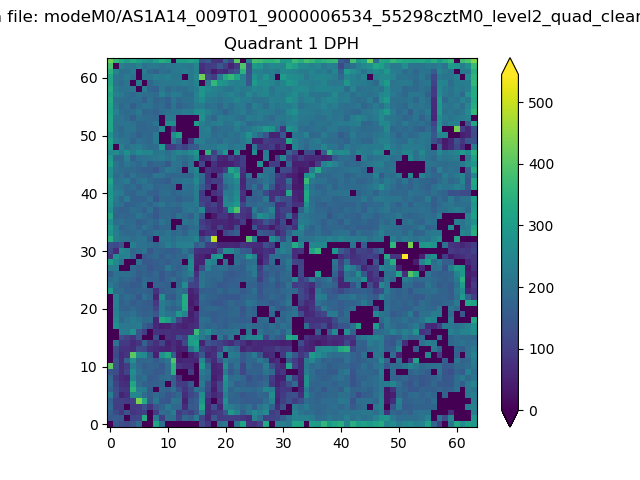 |
Quadrant B |
|---|---|---|---|
| Quadrant D | 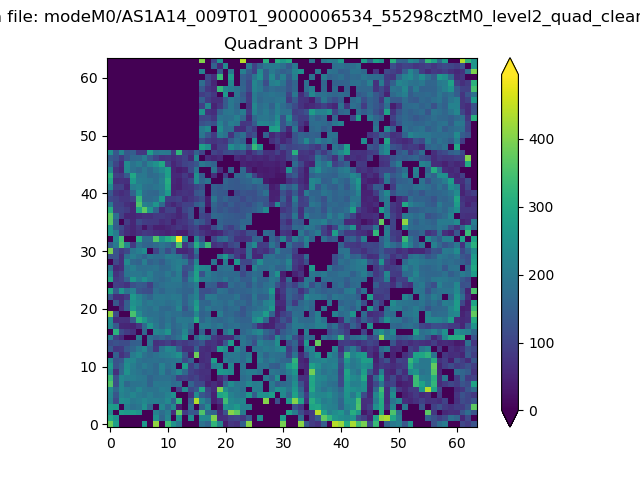 |
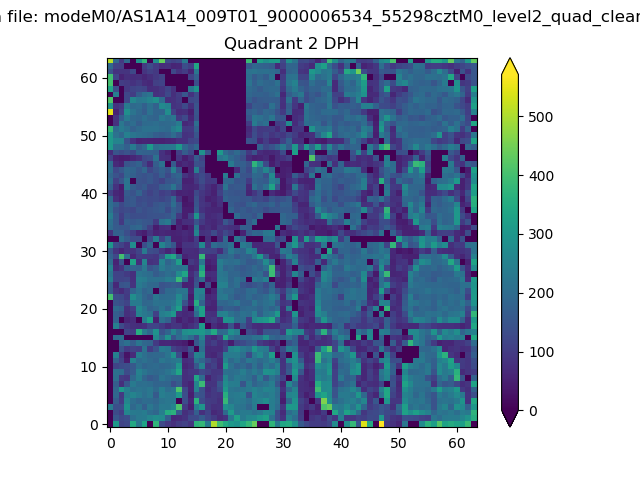 |
Quadrant C |
| Plot type | Count rate plots | Images |
|---|---|---|
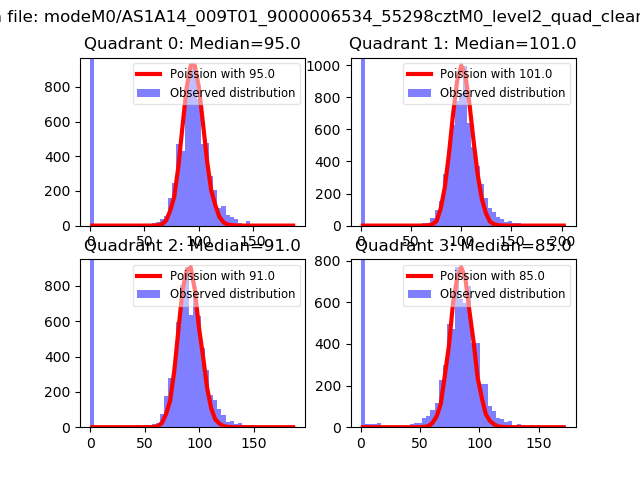
| Comparison with Poisson distribution Blue bars denote a histogram of data divided into 1 sec bins. Red curve is a Poisson curve with rate = median count rate of data. |
 |
 |
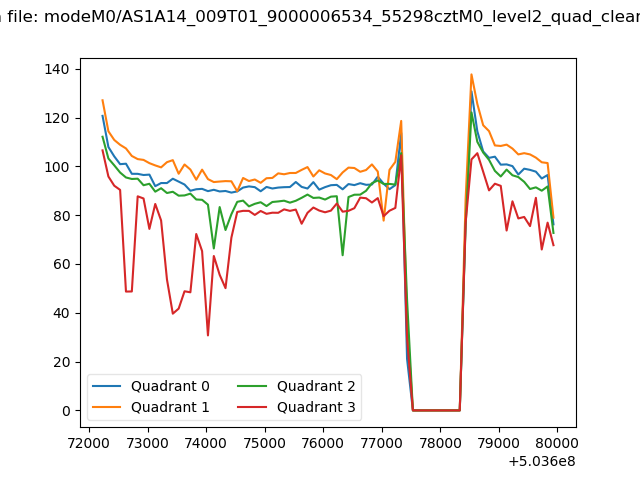
| Quadrant-wise count rates Data is divided into 100 sec bins |
 |
|
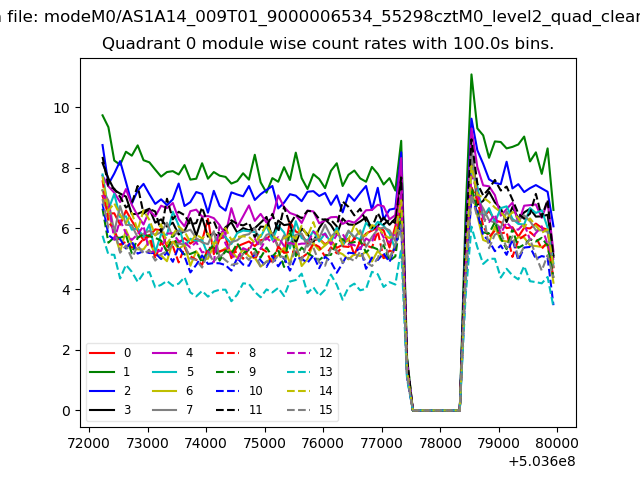
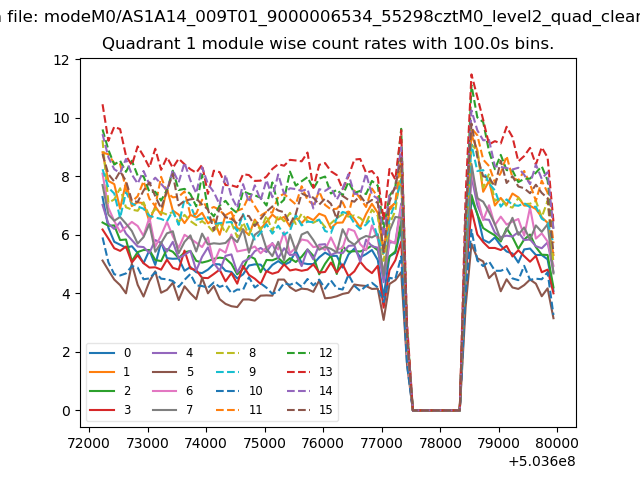
| Module-wise count rates for Quadrant A Data is divided into 100 sec bins |
 |
 |
| Module-wise count rates for Quadrant B Data is divided into 100 sec bins |
 |
 |
| Module-wise count rates for Quadrant C Data is divided into 100 sec bins |
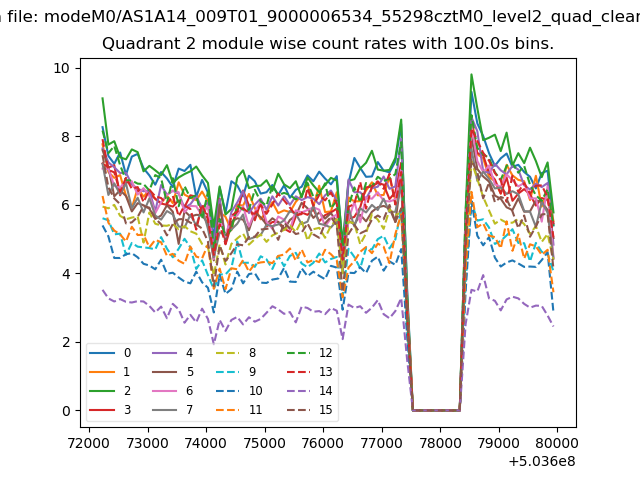 |
 |
| Module-wise count rates for Quadrant D Data is divided into 100 sec bins |
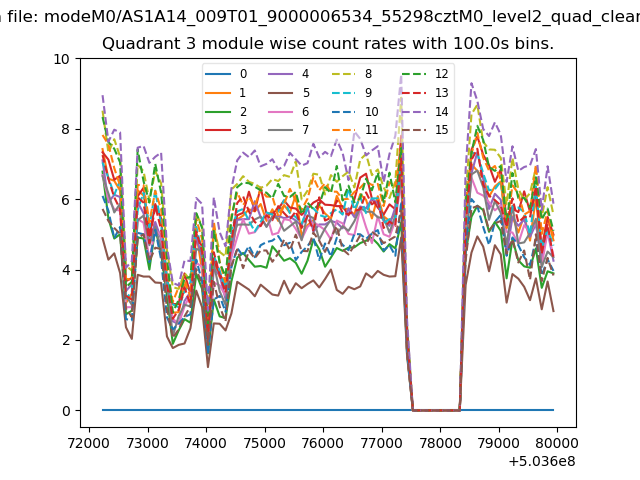 |
 |
| Parameter | Plot |
|---|---|
| CZT HV Monitor | 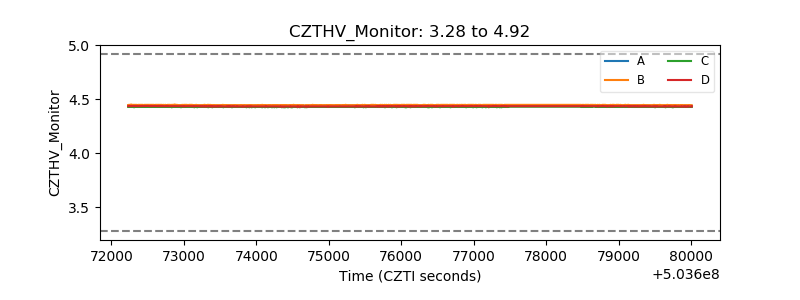 |
| D_VDD | 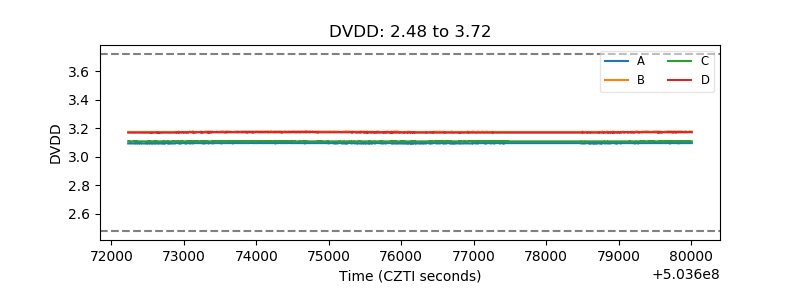 |
| Temperature 1 | 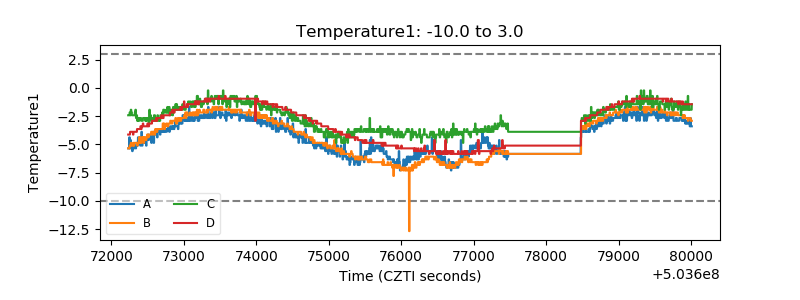 |
| Veto HV Monitor | 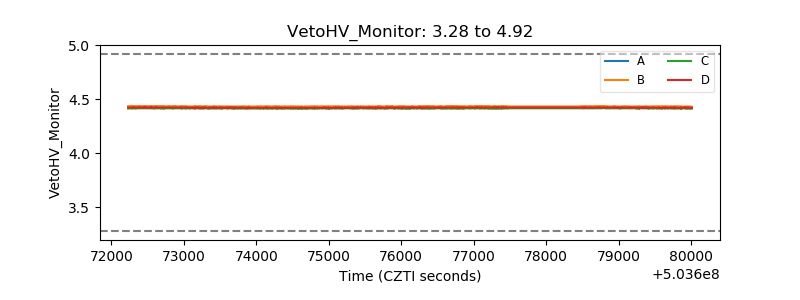 |
| Veto LLD | 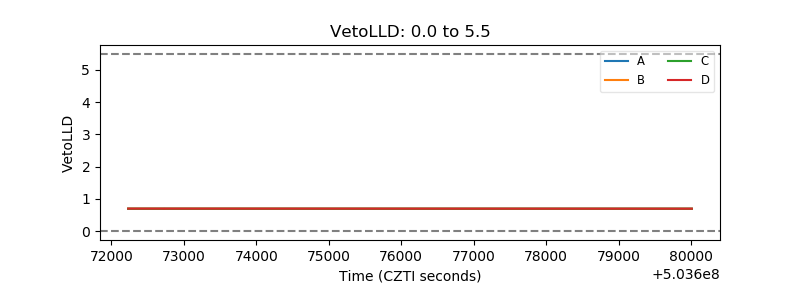 |
| Alpha Counter | 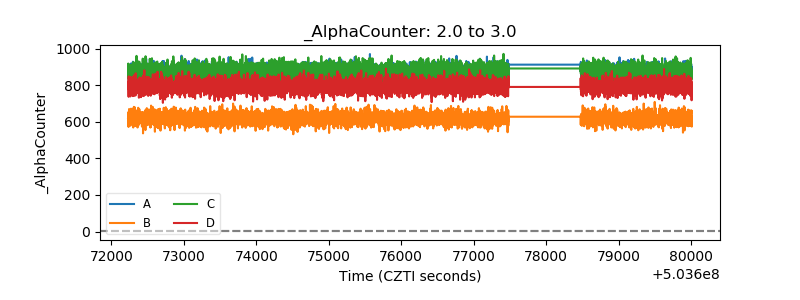 |
| _CPM_Rate | 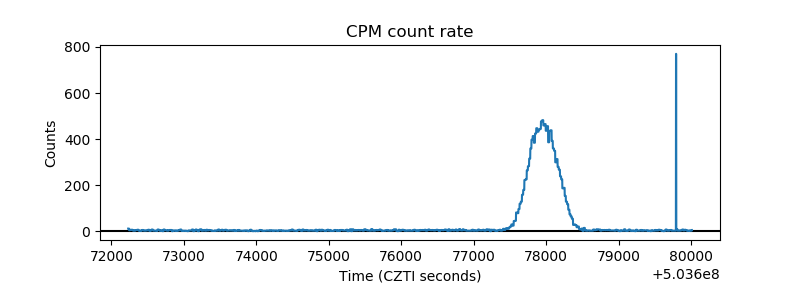 |
| CZT Counter | 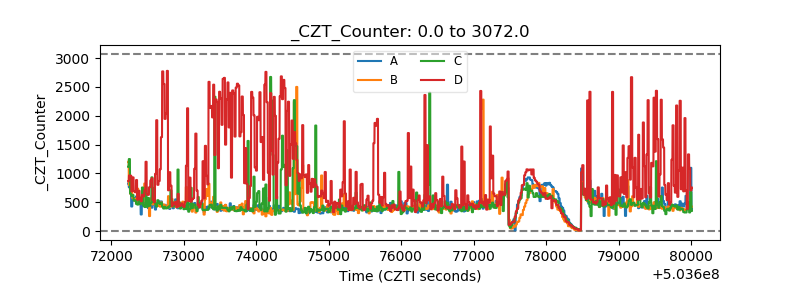 |
| +2.5 Volts monitor |  |
| +5 Volts monitor |  |
| _ROLL_ROT | 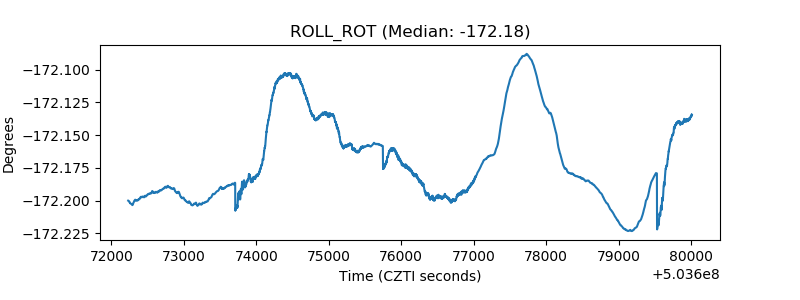 |
| _Roll_DEC | 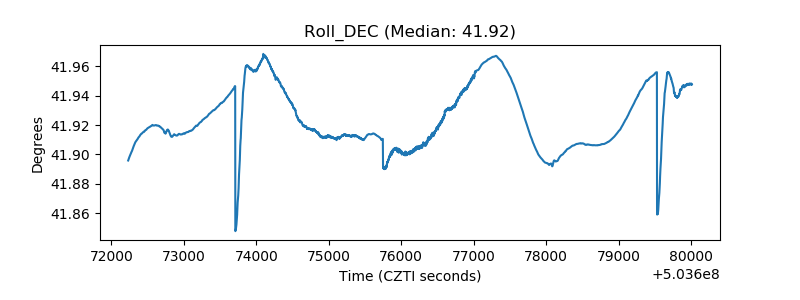 |
| _Roll_RA | 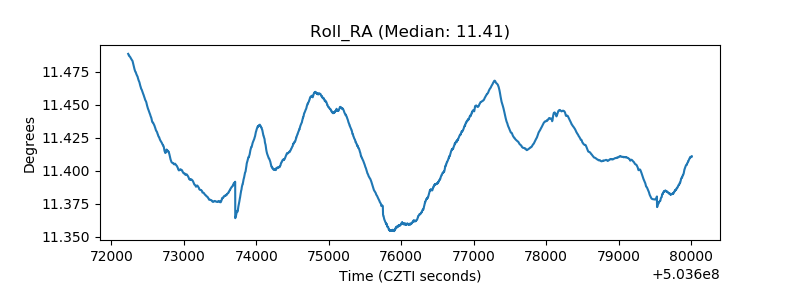 |
| Veto Counter | 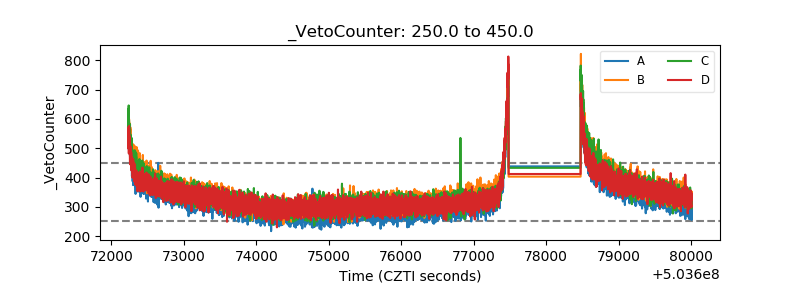 |