| Param | Original file | Final file |
|---|---|---|
| Filename | modeM0/AS1A14_009T01_9000006534_55299cztM0_level2.fits | modeM0/AS1A14_009T01_9000006534_55299cztM0_level2_quad_clean.evt |
| Size (bytes) | 422,233,920 | 92,304,000 |
| Size | 402.7 MB | 88.0 MB |
| Events in quadrant A | 3,602,261 | 591,728 |
| Events in quadrant B | 2,843,483 | 656,152 |
| Events in quadrant C | 3,005,240 | 589,812 |
| Events in quadrant D | 5,683,086 | 512,646 |
| Mode SS | |||
|---|---|---|---|
| Quadrant | BADHDUFLAG | Total packets | Discarded packets |
| A | 0 | 130 | 0 |
| B | 0 | 130 | 0 |
| C | 0 | 130 | 0 |
| D | 0 | 130 | 0 |
| Mode M0 | |||
|---|---|---|---|
| Quadrant | BADHDUFLAG | Total packets | Discarded packets |
| A | 0 | 15239 | 1 |
| B | 0 | 13264 | 1 |
| C | 0 | 13766 | 1 |
| D | 0 | 21235 | 1 |
| Mode M9 | |||
|---|---|---|---|
| Quadrant | BADHDUFLAG | Total packets | Discarded packets |
| A | 0 | 11 | 0 |
| B | 0 | 11 | 0 |
| C | 0 | 11 | 0 |
| D | 0 | 11 | 0 |
| Quadrant | Total seconds | Saturated seconds | Saturation percentage |
|---|---|---|---|
| A | 6368 | 312 | 4.899497% |
| B | 6368 | 67 | 1.052136% |
| C | 6369 | 65 | 1.020568% |
| D | 6369 | 649 | 10.189983% |
Noise dominated data is calculated using 1-second bins in cleaned event files. If a bin has >2000 counts, and if more than 50% of those come from <1% of pixels, then it is considered to be noise-dominated and hence unusable.
| Quadrant | # 1 sec bins | Bins with >0 counts | Bins with >2000 counts | High rate bins dominated by noise | Noise dominated (total time) | Noise dominated (detector-on time) | Marked lightcurve |
|---|---|---|---|---|---|---|---|
| A | 7468 | 6368 | 242 | 242 | 3.24% | 3.80% | 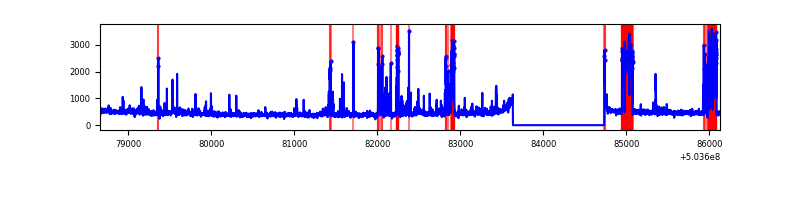 |
| B | 7468 | 6368 | 5 | 5 | 0.07% | 0.08% | 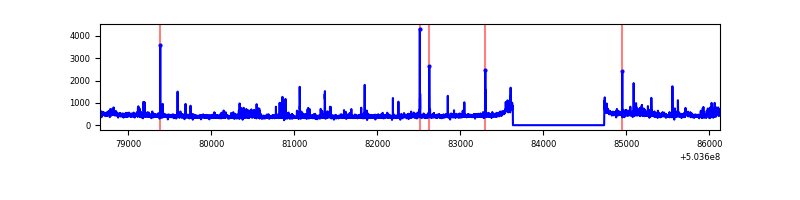 |
| C | 7469 | 6370 | 38 | 38 | 0.51% | 0.60% | 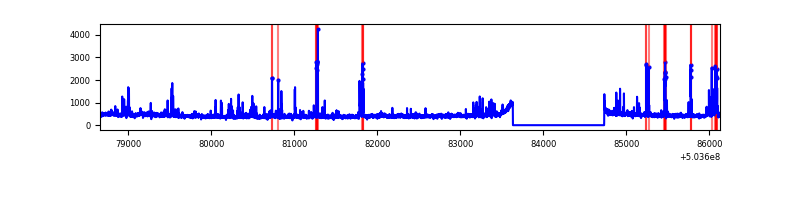 |
| D | 7469 | 6369 | 536 | 536 | 7.18% | 8.42% | 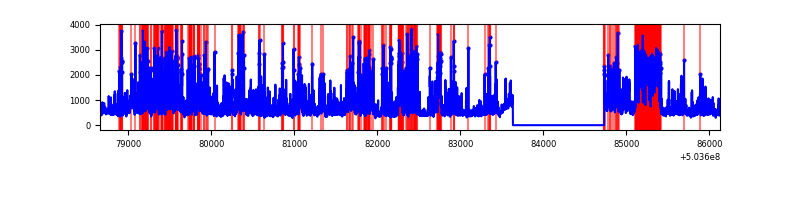 |
Top three noisy pixels from each quadrant. If the there are fewer than three noisy pixels in the level2.evt file, extra rows are filled as -1
| Pixel properties | Quadrant properties | ||||||
|---|---|---|---|---|---|---|---|
| Quadrant | DetID | PixID | Counts | Sigma | Mean | Median | Sigma |
| A | 7 | 7 | 504391 | 3063.13 | 663 | 646 | 164.5 |
| A | 0 | 8 | 235398 | 1427.46 | 663 | 646 | 164.5 |
| A | 4 | 205 | 71304 | 429.65 | 663 | 646 | 164.5 |
| B | 0 | 199 | 68379 | 476.01 | 665 | 641 | 142.3 |
| B | 10 | 247 | 33897 | 233.7 | 665 | 641 | 142.3 |
| B | 7 | 252 | 32774 | 225.8 | 665 | 641 | 142.3 |
| C | 13 | 3 | 114945 | 630.51 | 658 | 651 | 181.3 |
| C | 9 | 38 | 80214 | 438.91 | 658 | 651 | 181.3 |
| C | 14 | 254 | 67900 | 370.98 | 658 | 651 | 181.3 |
| D | 11 | 129 | 1907939 | 10700.76 | 631 | 605 | 178.2 |
| D | 6 | 239 | 461998 | 2588.56 | 631 | 605 | 178.2 |
| D | 7 | 96 | 377410 | 2114.0 | 631 | 605 | 178.2 |
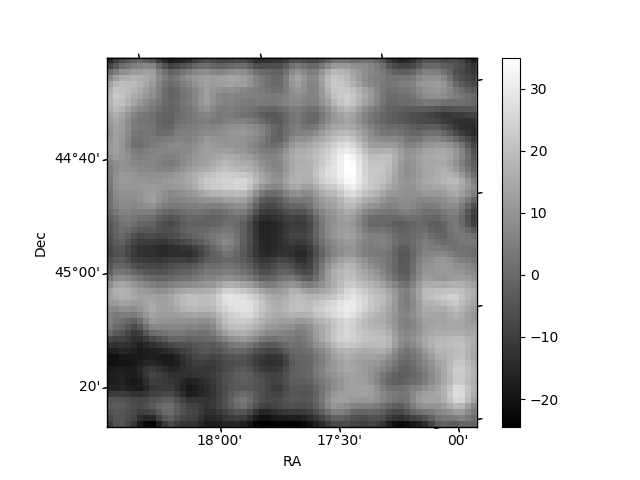
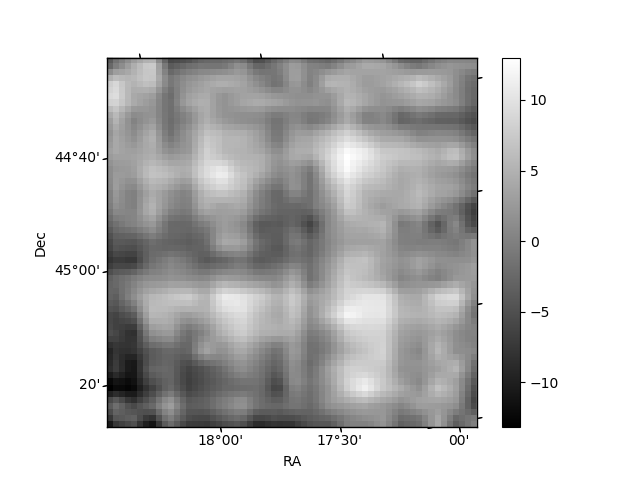
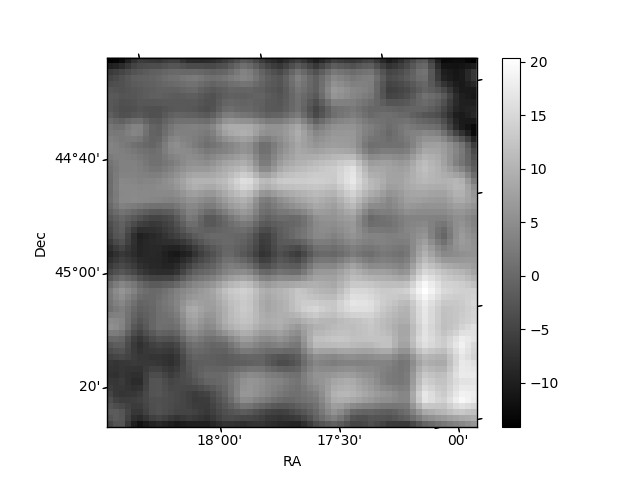
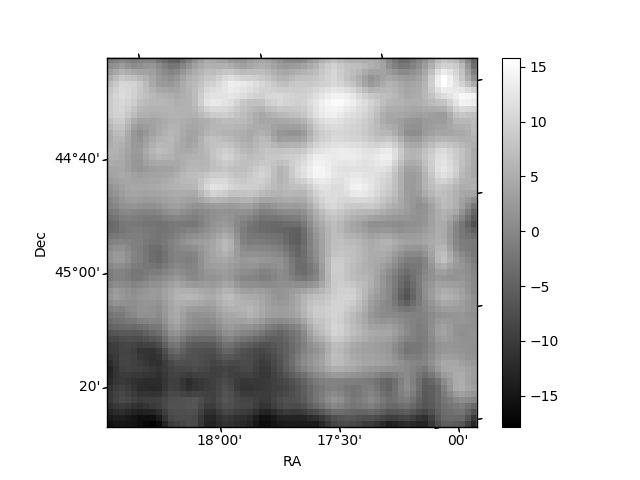
Histogram calculated using DETX and DETY for each event in the final _common_clean file
| Quadrant A | 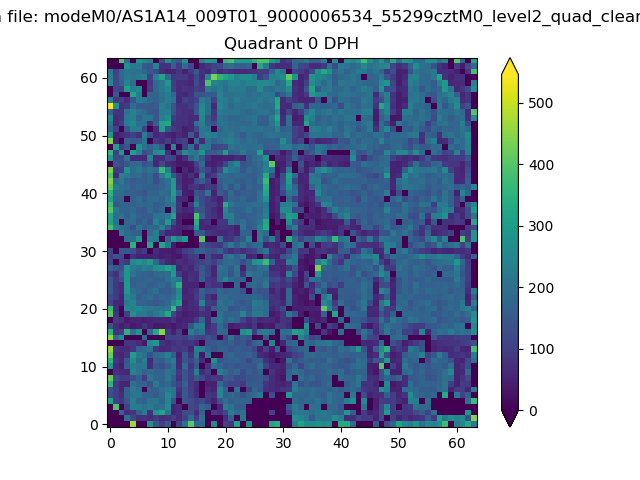 |
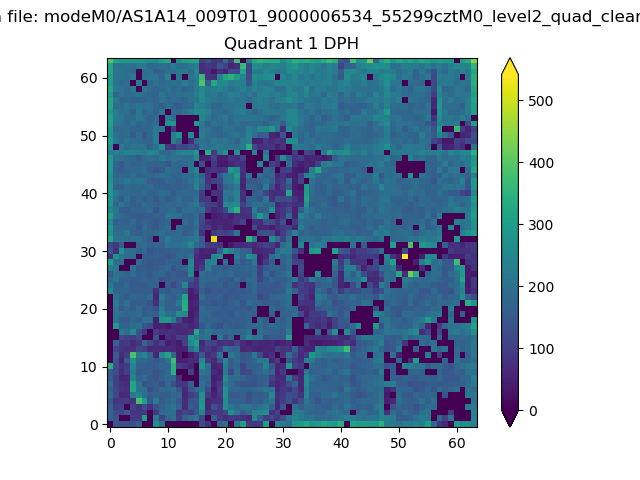 |
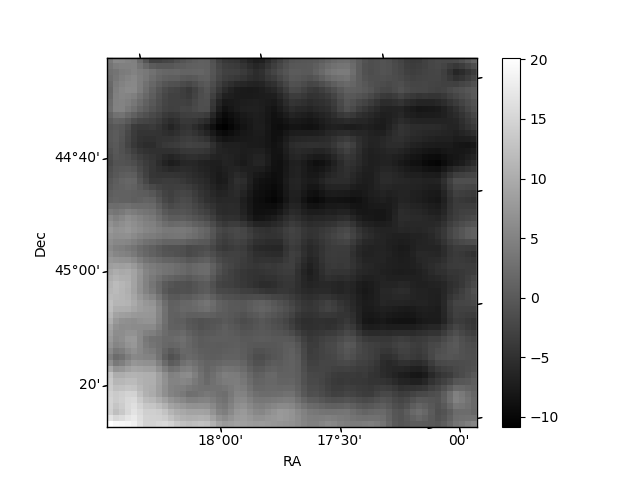
Quadrant B |
|---|---|---|---|
| Quadrant D | 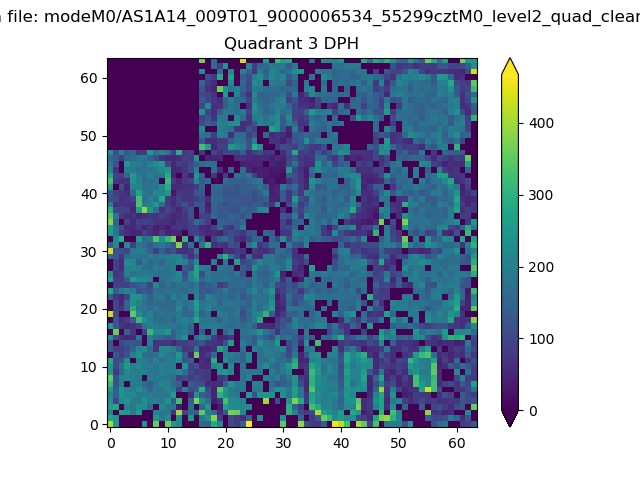 |
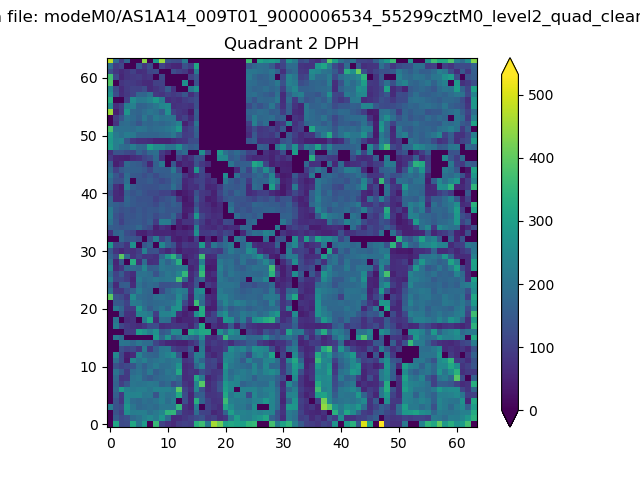 |
Quadrant C |
| Plot type | Count rate plots | Images |
|---|---|---|
| Comparison with Poisson distribution Blue bars denote a histogram of data divided into 1 sec bins. Red curve is a Poisson curve with rate = median count rate of data. |
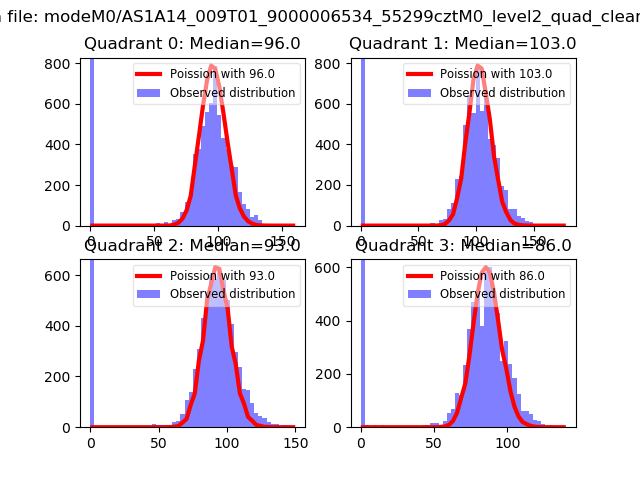 |
 |
| Quadrant-wise count rates Data is divided into 100 sec bins |
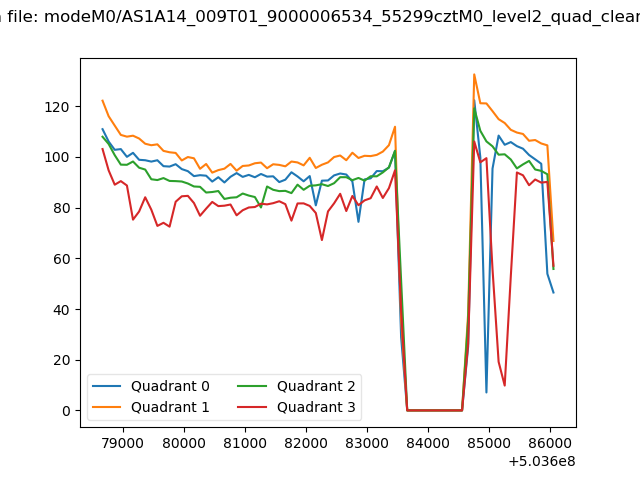 |
|
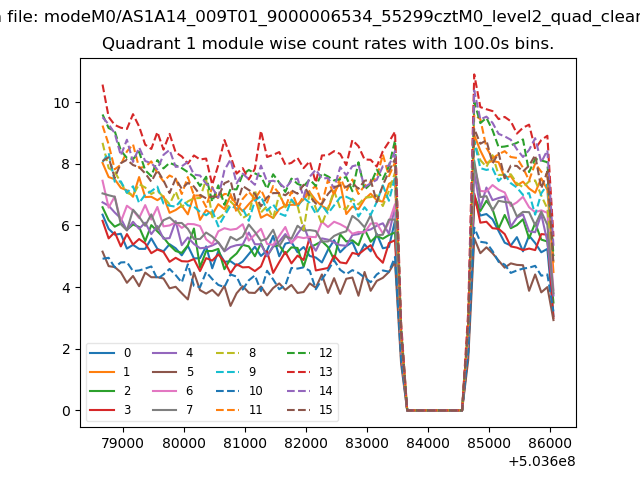
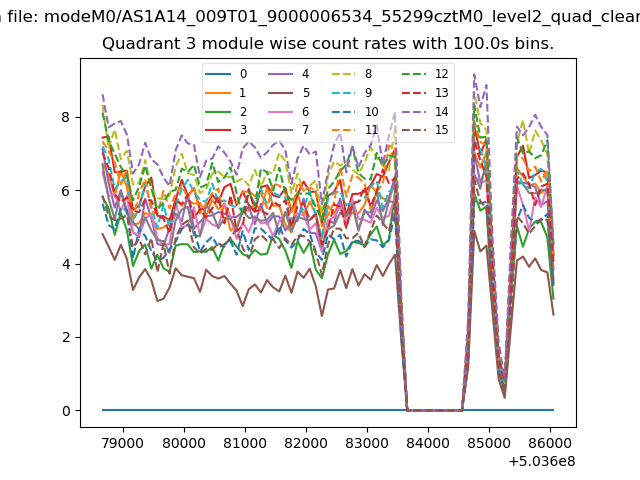
| Module-wise count rates for Quadrant A Data is divided into 100 sec bins |
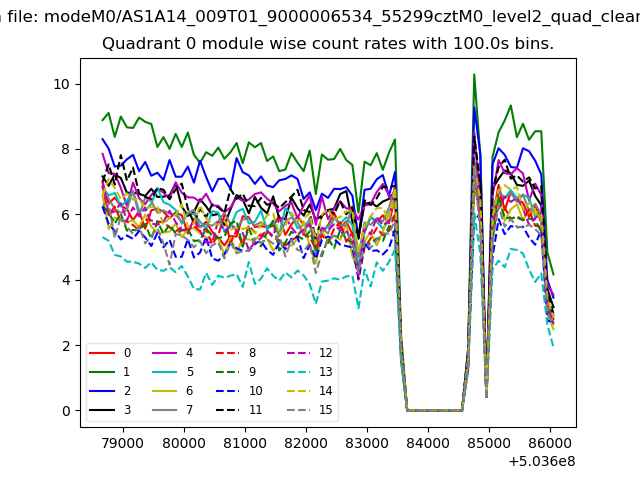 |
 |
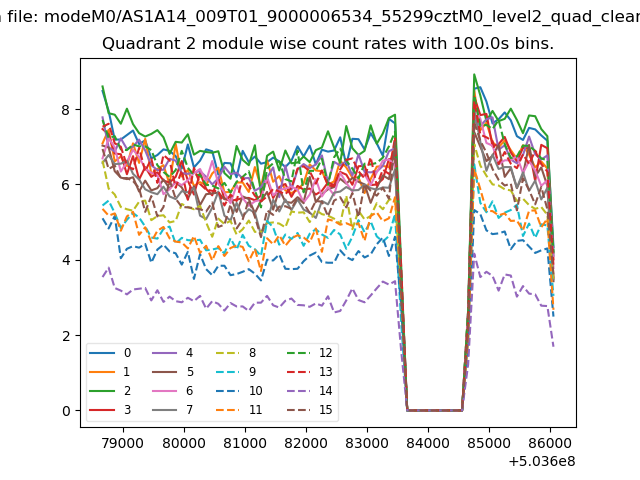
| Module-wise count rates for Quadrant B Data is divided into 100 sec bins |
 |
 |
| Module-wise count rates for Quadrant C Data is divided into 100 sec bins |
 |
 |
| Module-wise count rates for Quadrant D Data is divided into 100 sec bins |
 |
 |
| Parameter | Plot |
|---|---|
| CZT HV Monitor | 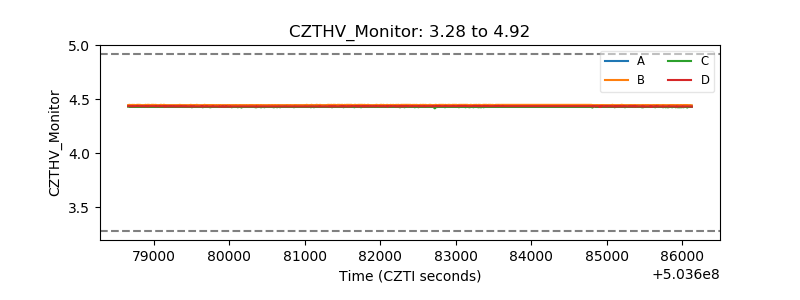 |
| D_VDD | 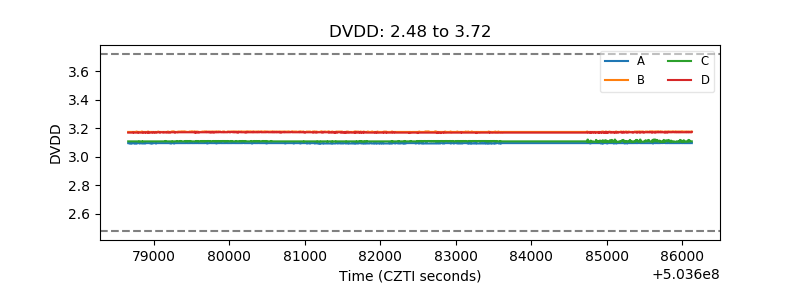 |
| Temperature 1 | 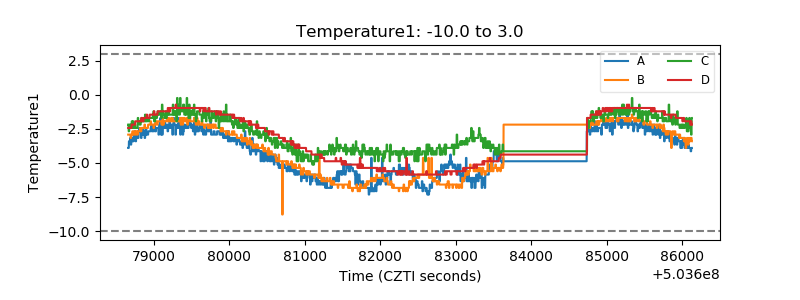 |
| Veto HV Monitor |  |
| Veto LLD | 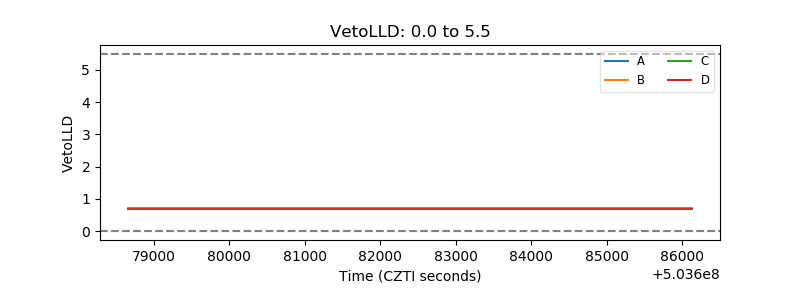 |
| Alpha Counter | 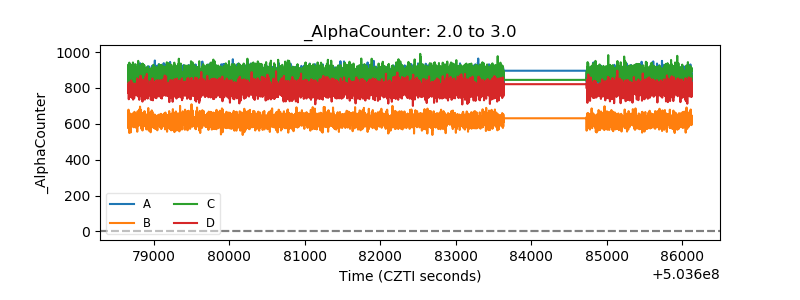 |
| _CPM_Rate | 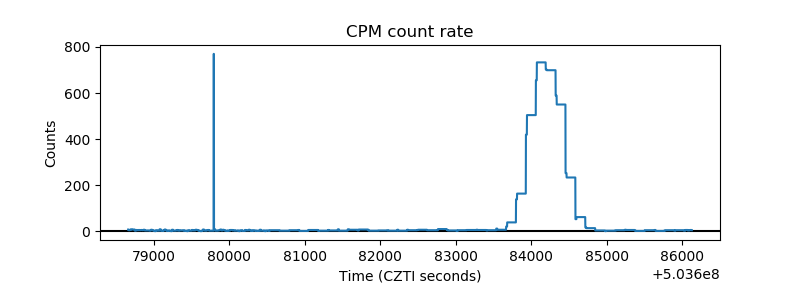 |
| CZT Counter | 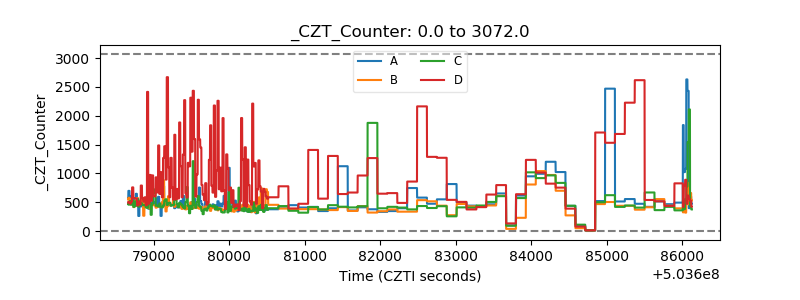 |
| +2.5 Volts monitor | 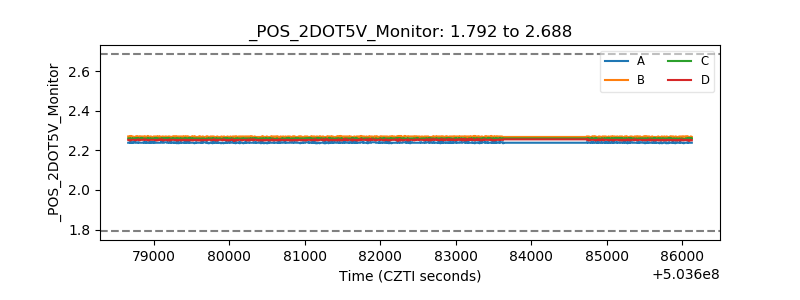 |
| +5 Volts monitor | 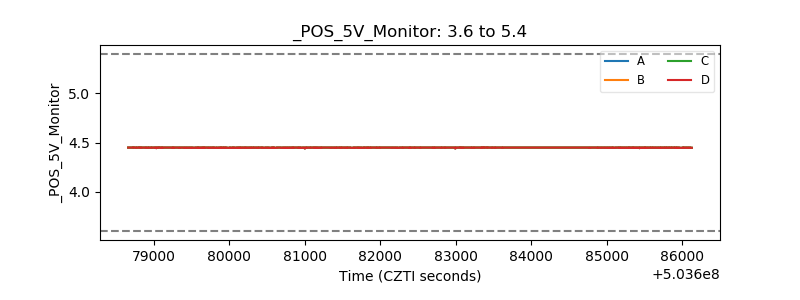 |
| _ROLL_ROT | 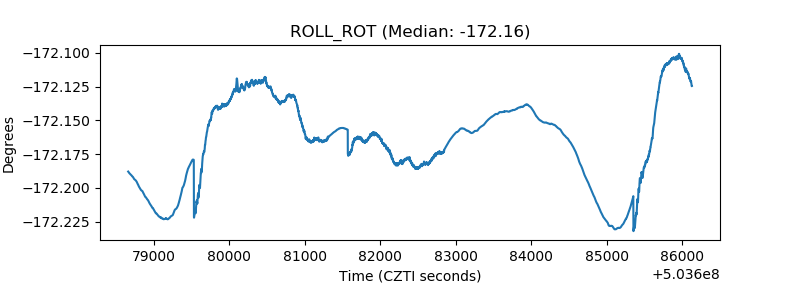 |
| _Roll_DEC | 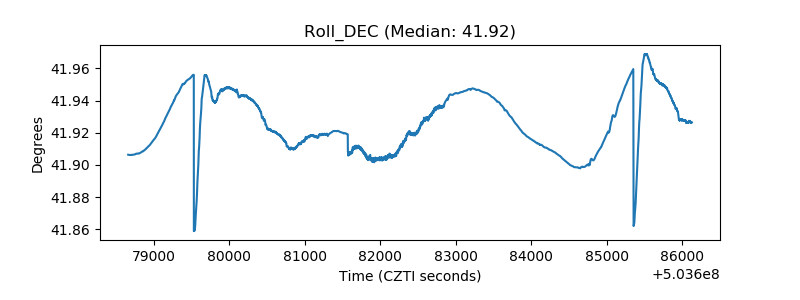 |
| _Roll_RA | 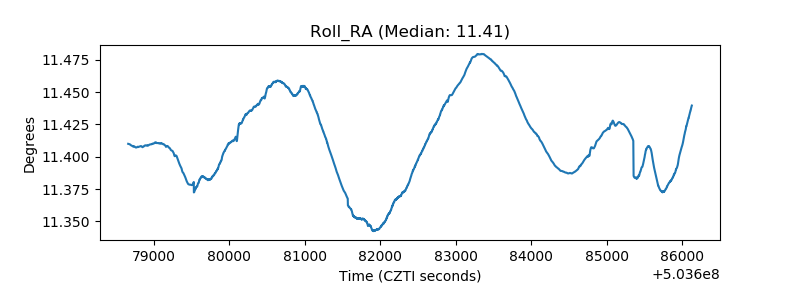 |
| Veto Counter | 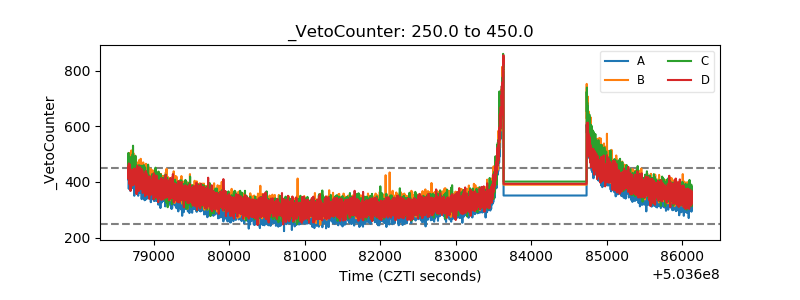 |