| Param | Original file | Final file |
|---|---|---|
| Filename | modeM0/AS1A14_009T01_9000006534_55300cztM0_level2.fits | modeM0/AS1A14_009T01_9000006534_55300cztM0_level2_quad_clean.evt |
| Size (bytes) | 404,968,320 | 94,515,840 |
| Size | 386.2 MB | 90.1 MB |
| Events in quadrant A | 4,329,127 | 594,593 |
| Events in quadrant B | 2,993,356 | 673,293 |
| Events in quadrant C | 3,001,471 | 606,391 |
| Events in quadrant D | 4,169,606 | 542,001 |
| Mode SS | |||
|---|---|---|---|
| Quadrant | BADHDUFLAG | Total packets | Discarded packets |
| A | 0 | 132 | 0 |
| B | 0 | 130 | 0 |
| C | 0 | 130 | 0 |
| D | 0 | 130 | 0 |
| Mode M0 | |||
|---|---|---|---|
| Quadrant | BADHDUFLAG | Total packets | Discarded packets |
| A | 0 | 17148 | 2 |
| B | 0 | 13611 | 2 |
| C | 0 | 13786 | 2 |
| D | 0 | 16998 | 2 |
| Mode M9 | |||
|---|---|---|---|
| Quadrant | BADHDUFLAG | Total packets | Discarded packets |
| A | 0 | 15 | 0 |
| B | 0 | 15 | 0 |
| C | 0 | 16 | 0 |
| D | 0 | 16 | 0 |
| Quadrant | Total seconds | Saturated seconds | Saturation percentage |
|---|---|---|---|
| A | 6385 | 476 | 7.454973% |
| B | 6384 | 68 | 1.065163% |
| C | 6384 | 63 | 0.986842% |
| D | 6384 | 393 | 6.156015% |
Noise dominated data is calculated using 1-second bins in cleaned event files. If a bin has >2000 counts, and if more than 50% of those come from <1% of pixels, then it is considered to be noise-dominated and hence unusable.
| Quadrant | # 1 sec bins | Bins with >0 counts | Bins with >2000 counts | High rate bins dominated by noise | Noise dominated (total time) | Noise dominated (detector-on time) | Marked lightcurve |
|---|---|---|---|---|---|---|---|
| A | 7545 | 6385 | 403 | 403 | 5.34% | 6.31% | 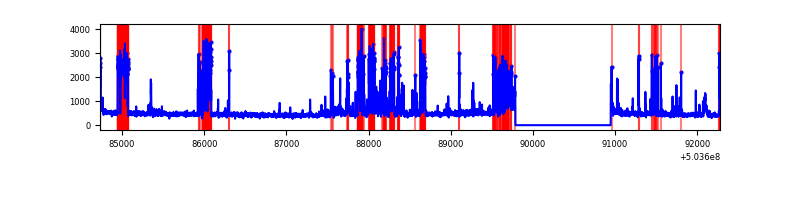 |
| B | 7544 | 6384 | 17 | 17 | 0.23% | 0.27% | 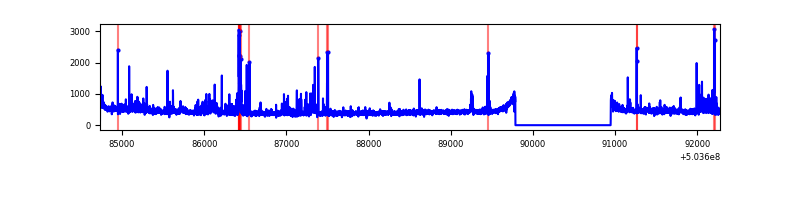 |
| C | 7544 | 6385 | 36 | 36 | 0.48% | 0.56% | 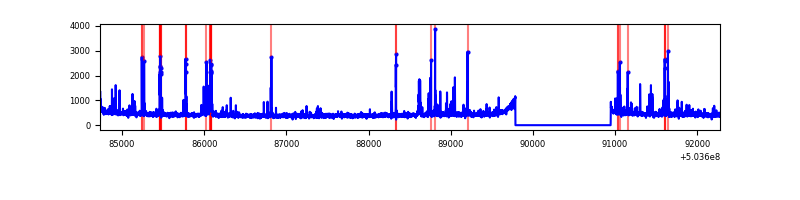 |
| D | 7544 | 6385 | 325 | 325 | 4.31% | 5.09% | 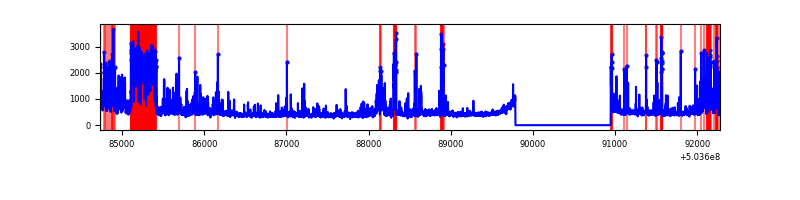 |
Top three noisy pixels from each quadrant. If the there are fewer than three noisy pixels in the level2.evt file, extra rows are filled as -1
| Pixel properties | Quadrant properties | ||||||
|---|---|---|---|---|---|---|---|
| Quadrant | DetID | PixID | Counts | Sigma | Mean | Median | Sigma |
| A | 0 | 8 | 1102218 | 6811.93 | 660 | 645 | 161.7 |
| A | 7 | 7 | 483663 | 2986.9 | 660 | 645 | 161.7 |
| A | 3 | 78 | 84310 | 517.37 | 660 | 645 | 161.7 |
| B | 0 | 199 | 172197 | 1187.59 | 676 | 653 | 144.4 |
| B | 7 | 252 | 45818 | 312.67 | 676 | 653 | 144.4 |
| B | 10 | 247 | 22458 | 150.95 | 676 | 653 | 144.4 |
| C | 13 | 3 | 133332 | 721.44 | 671 | 662 | 183.9 |
| C | 14 | 254 | 96593 | 521.65 | 671 | 662 | 183.9 |
| C | 9 | 38 | 58619 | 315.16 | 671 | 662 | 183.9 |
| D | 11 | 129 | 946751 | 5178.83 | 650 | 624 | 182.7 |
| D | 6 | 239 | 236627 | 1291.81 | 650 | 624 | 182.7 |
| D | 3 | 12 | 85724 | 465.81 | 650 | 624 | 182.7 |
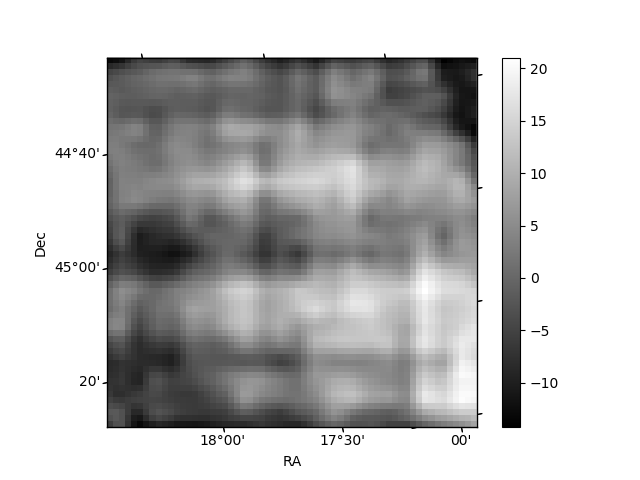
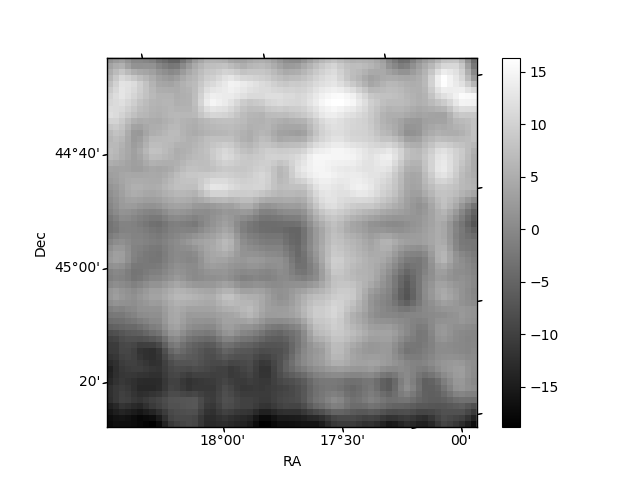
Histogram calculated using DETX and DETY for each event in the final _common_clean file
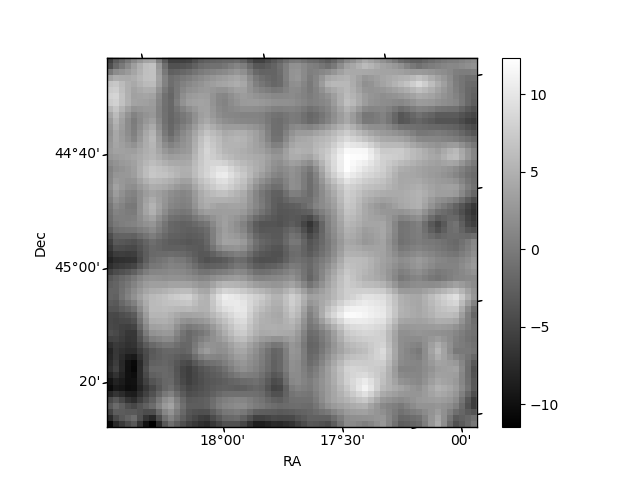
| Quadrant A | 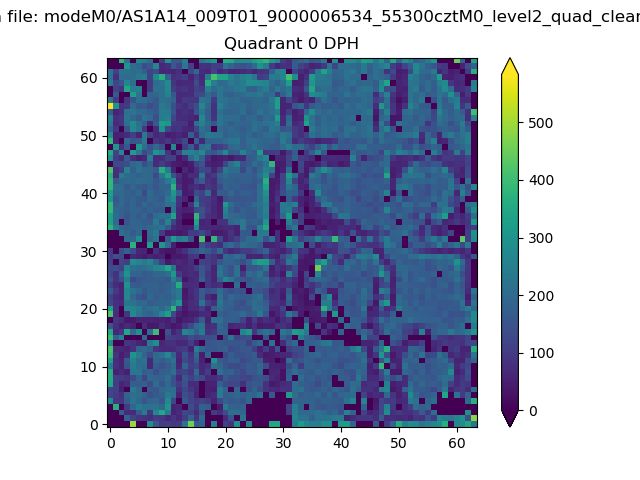 |
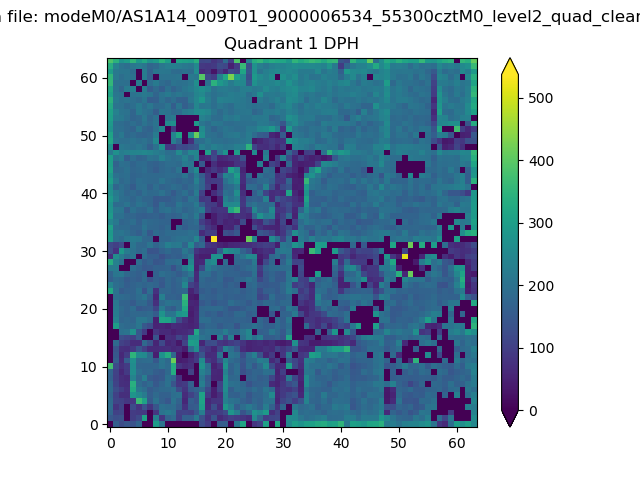 |
Quadrant B |
|---|---|---|---|
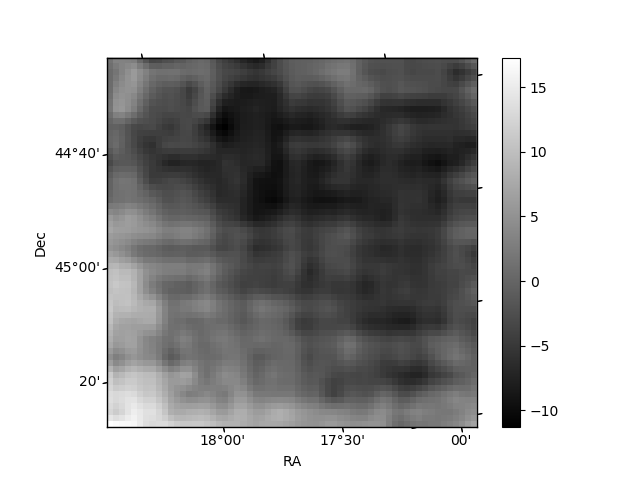
| Quadrant D | 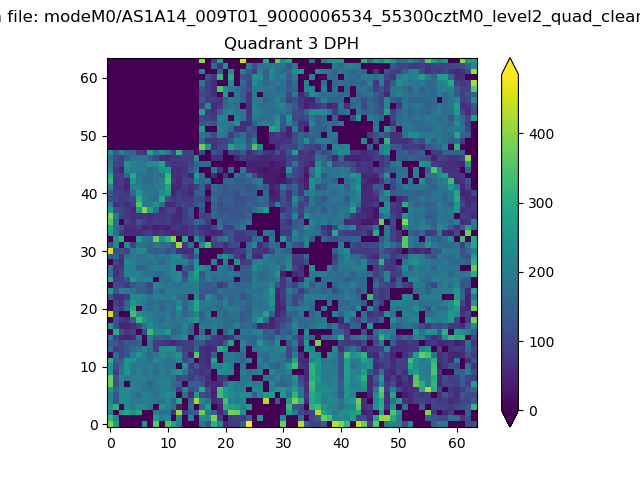 |
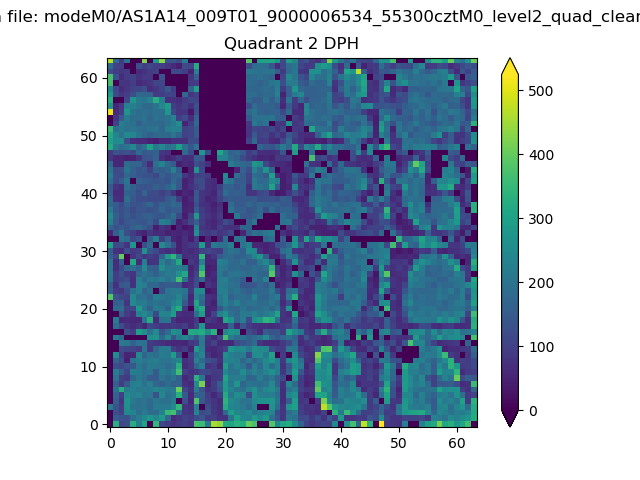 |
Quadrant C |
| Plot type | Count rate plots | Images |
|---|---|---|
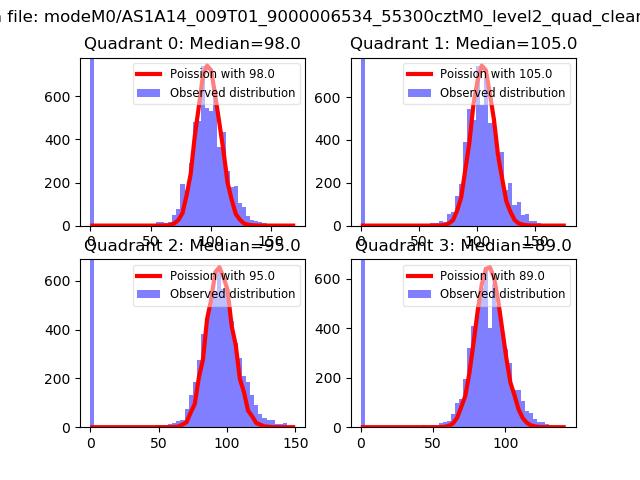
| Comparison with Poisson distribution Blue bars denote a histogram of data divided into 1 sec bins. Red curve is a Poisson curve with rate = median count rate of data. |
 |
 |
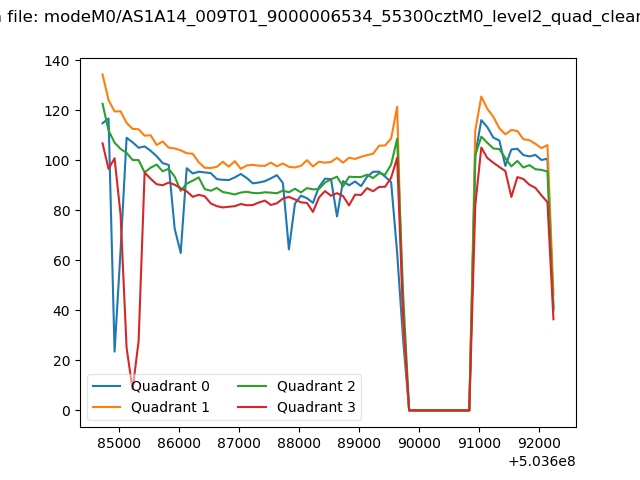
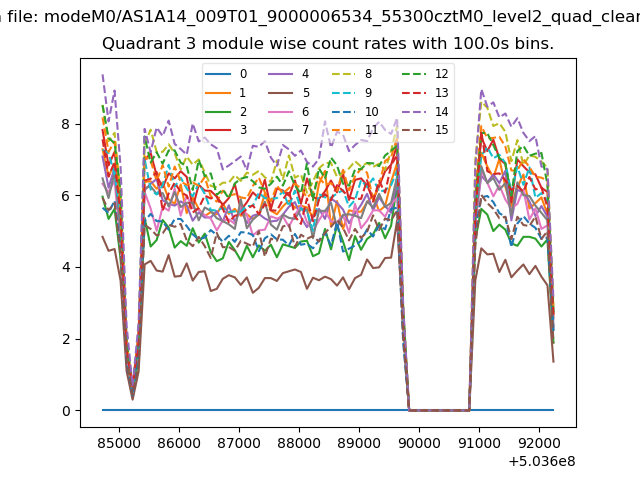
| Quadrant-wise count rates Data is divided into 100 sec bins |
 |
|
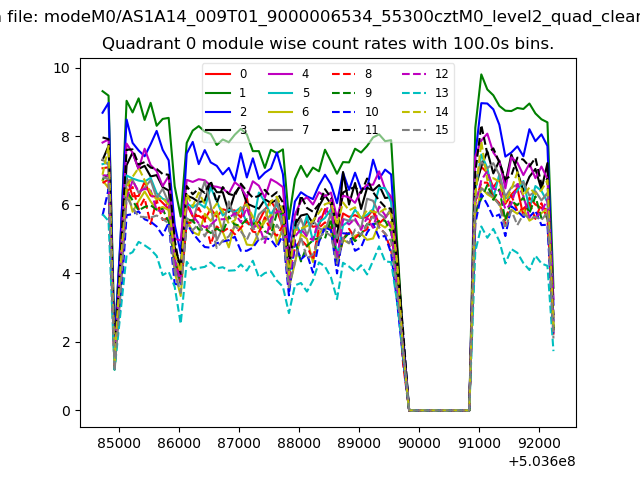
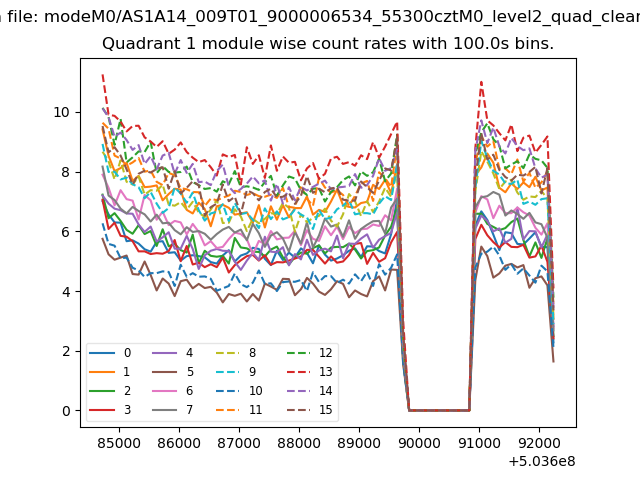
| Module-wise count rates for Quadrant A Data is divided into 100 sec bins |
 |
 |
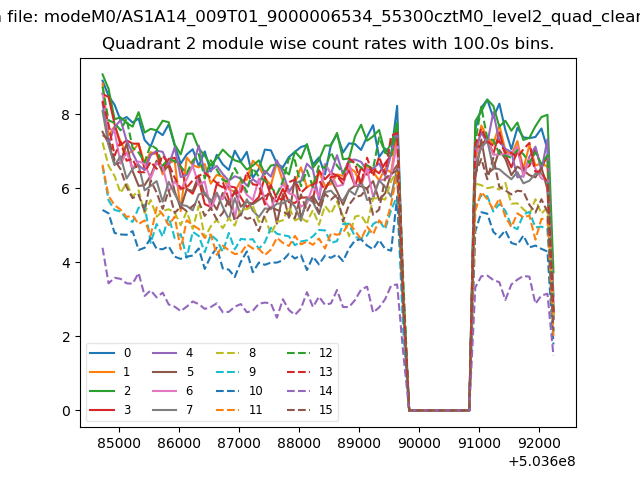
| Module-wise count rates for Quadrant B Data is divided into 100 sec bins |
 |
 |
| Module-wise count rates for Quadrant C Data is divided into 100 sec bins |
 |
 |
| Module-wise count rates for Quadrant D Data is divided into 100 sec bins |
 |
 |
| Parameter | Plot |
|---|---|
| CZT HV Monitor | 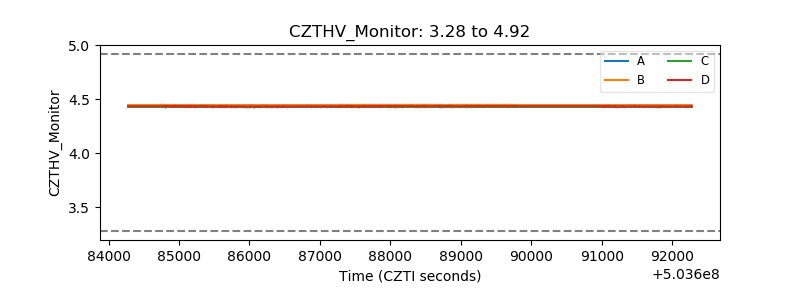 |
| D_VDD | 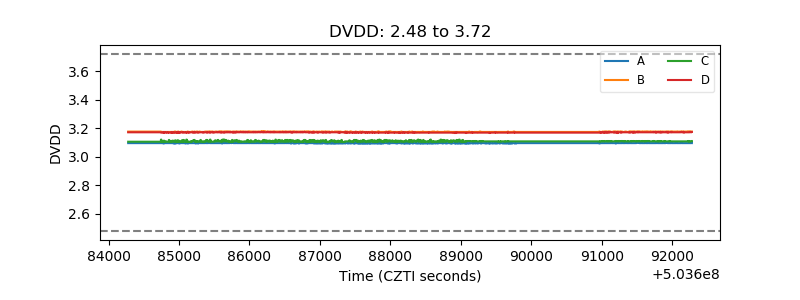 |
| Temperature 1 | 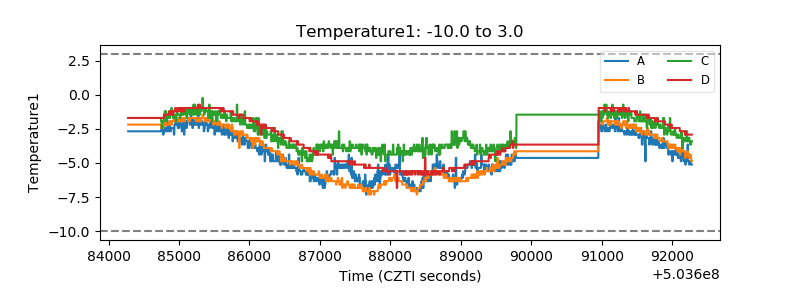 |
| Veto HV Monitor | 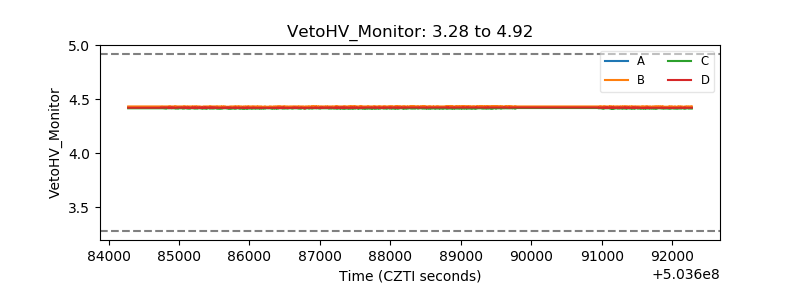 |
| Veto LLD | 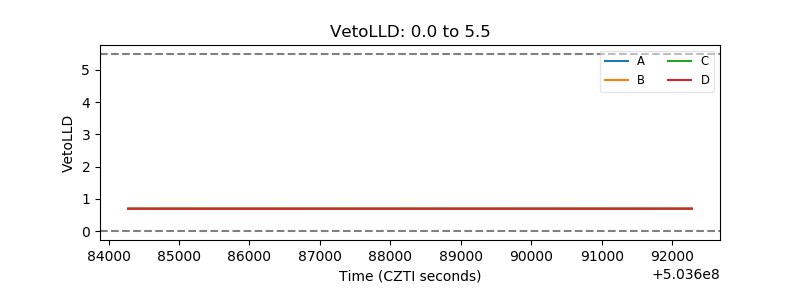 |
| Alpha Counter | 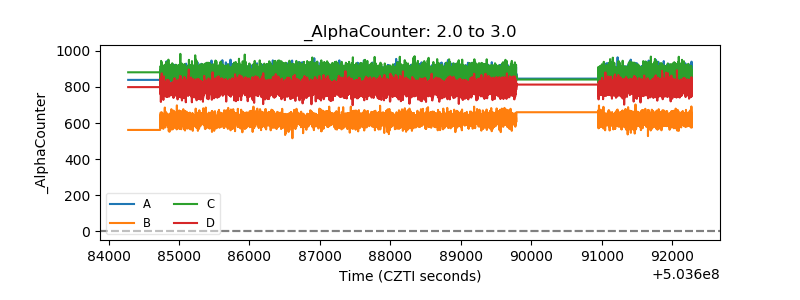 |
| _CPM_Rate | 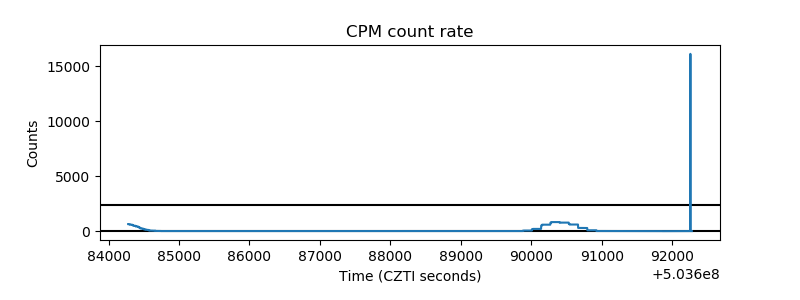 |
| CZT Counter | 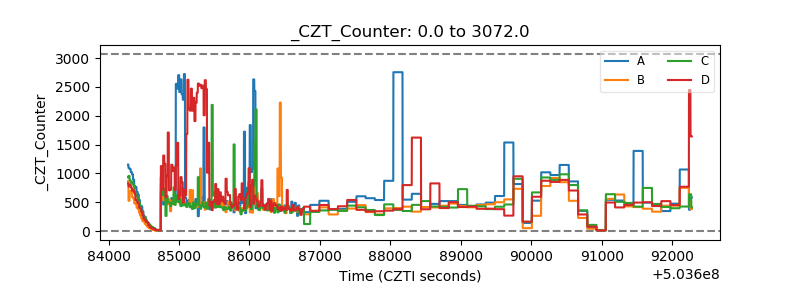 |
| +2.5 Volts monitor | 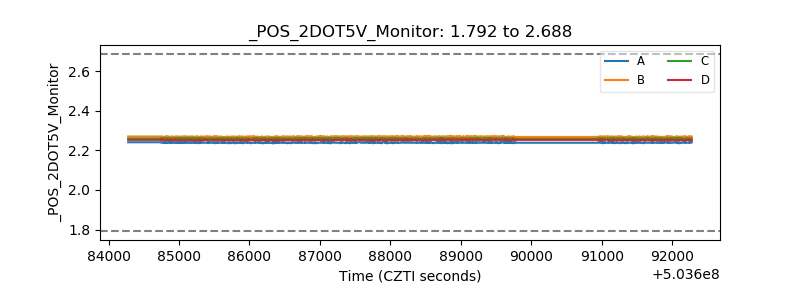 |
| +5 Volts monitor | 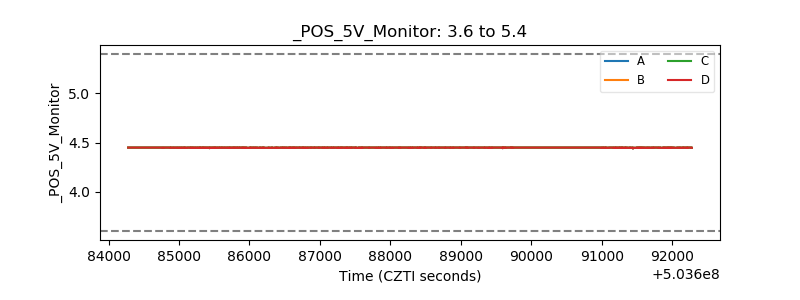 |
| _ROLL_ROT | 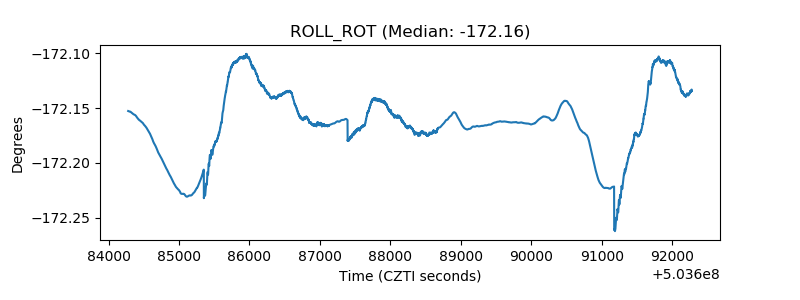 |
| _Roll_DEC | 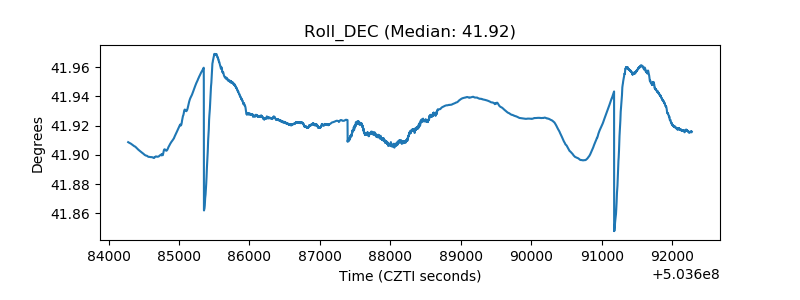 |
| _Roll_RA | 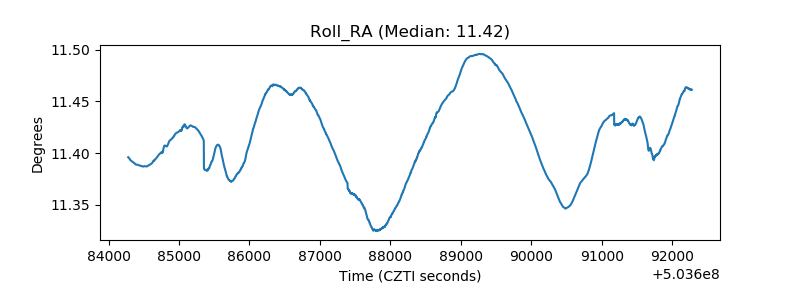 |
| Veto Counter | 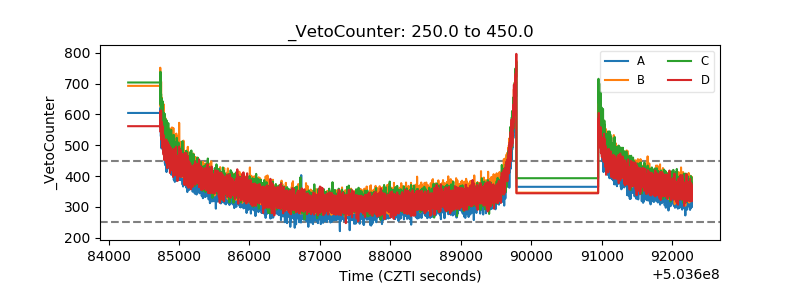 |