| Param | Original file | Final file |
|---|---|---|
| Filename | modeM0/AS1A14_009T01_9000006534_55302cztM0_level2.fits | modeM0/AS1A14_009T01_9000006534_55302cztM0_level2_quad_clean.evt |
| Size (bytes) | 390,628,800 | 88,943,040 |
| Size | 372.5 MB | 84.8 MB |
| Events in quadrant A | 3,123,422 | 579,032 |
| Events in quadrant B | 2,955,731 | 623,251 |
| Events in quadrant C | 3,357,530 | 548,130 |
| Events in quadrant D | 4,513,607 | 486,494 |
| Mode SS | |||
|---|---|---|---|
| Quadrant | BADHDUFLAG | Total packets | Discarded packets |
| A | 0 | 132 | 0 |
| B | 0 | 132 | 0 |
| C | 0 | 132 | 0 |
| D | 0 | 132 | 0 |
| Mode M0 | |||
|---|---|---|---|
| Quadrant | BADHDUFLAG | Total packets | Discarded packets |
| A | 0 | 14279 | 2 |
| B | 0 | 13819 | 2 |
| C | 0 | 15076 | 2 |
| D | 0 | 18202 | 2 |
| Mode M9 | |||
|---|---|---|---|
| Quadrant | BADHDUFLAG | Total packets | Discarded packets |
| A | 0 | 17 | 0 |
| B | 0 | 17 | 0 |
| C | 0 | 18 | 0 |
| D | 0 | 18 | 0 |
| Quadrant | Total seconds | Saturated seconds | Saturation percentage |
|---|---|---|---|
| A | 6546 | 60 | 0.916590% |
| B | 6546 | 45 | 0.687443% |
| C | 6545 | 141 | 2.154316% |
| D | 6545 | 254 | 3.880825% |
Noise dominated data is calculated using 1-second bins in cleaned event files. If a bin has >2000 counts, and if more than 50% of those come from <1% of pixels, then it is considered to be noise-dominated and hence unusable.
| Quadrant | # 1 sec bins | Bins with >0 counts | Bins with >2000 counts | High rate bins dominated by noise | Noise dominated (total time) | Noise dominated (detector-on time) | Marked lightcurve |
|---|---|---|---|---|---|---|---|
| A | 7911 | 6822 | 53 | 53 | 0.67% | 0.78% | 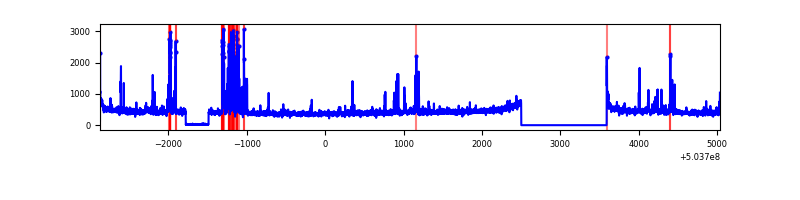 |
| B | 7911 | 6822 | 8 | 8 | 0.10% | 0.12% | 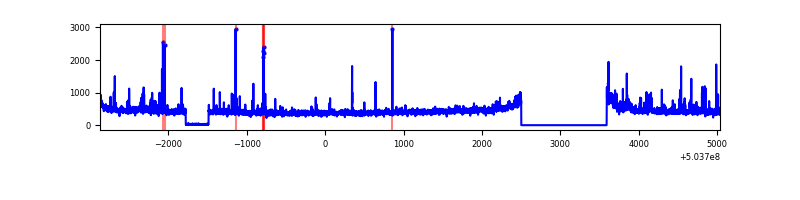 |
| C | 7910 | 6821 | 122 | 122 | 1.54% | 1.79% | 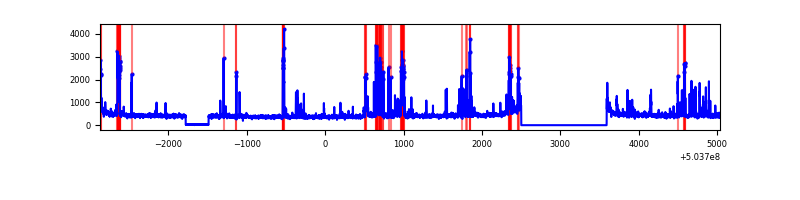 |
| D | 7910 | 6815 | 276 | 276 | 3.49% | 4.05% | 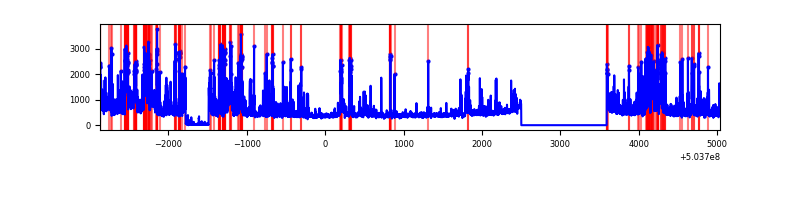 |
Top three noisy pixels from each quadrant. If the there are fewer than three noisy pixels in the level2.evt file, extra rows are filled as -1
| Pixel properties | Quadrant properties | ||||||
|---|---|---|---|---|---|---|---|
| Quadrant | DetID | PixID | Counts | Sigma | Mean | Median | Sigma |
| A | 0 | 8 | 323877 | 1922.9 | 680 | 663 | 168.1 |
| A | 3 | 78 | 29049 | 168.88 | 680 | 663 | 168.1 |
| A | 12 | 18 | 28052 | 162.95 | 680 | 663 | 168.1 |
| B | 0 | 199 | 87551 | 599.53 | 677 | 652 | 144.9 |
| B | 7 | 252 | 47194 | 321.1 | 677 | 652 | 144.9 |
| B | 9 | 254 | 39286 | 266.54 | 677 | 652 | 144.9 |
| C | 9 | 38 | 174379 | 943.48 | 670 | 664 | 184.1 |
| C | 14 | 254 | 163978 | 886.99 | 670 | 664 | 184.1 |
| C | 13 | 3 | 139062 | 751.66 | 670 | 664 | 184.1 |
| D | 11 | 129 | 872466 | 4672.07 | 659 | 631 | 186.6 |
| D | 11 | 176 | 530237 | 2838.1 | 659 | 631 | 186.6 |
| D | 6 | 239 | 276488 | 1478.29 | 659 | 631 | 186.6 |
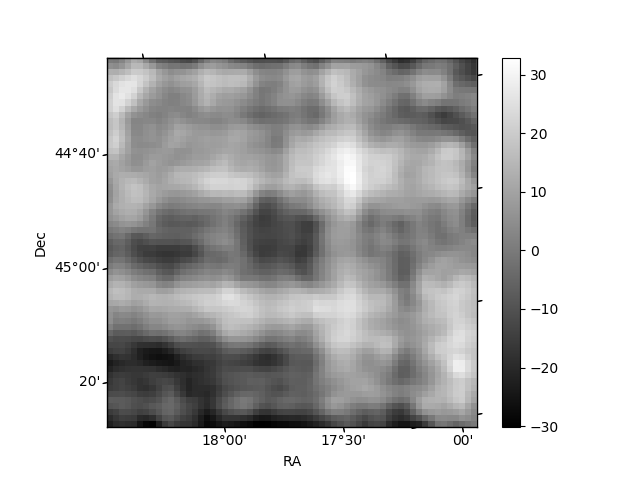
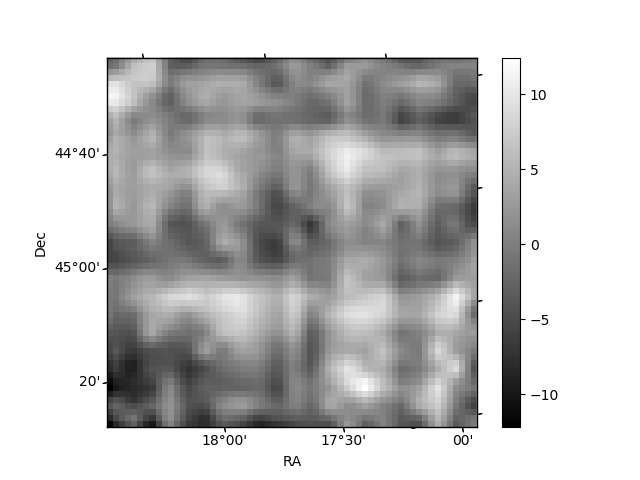
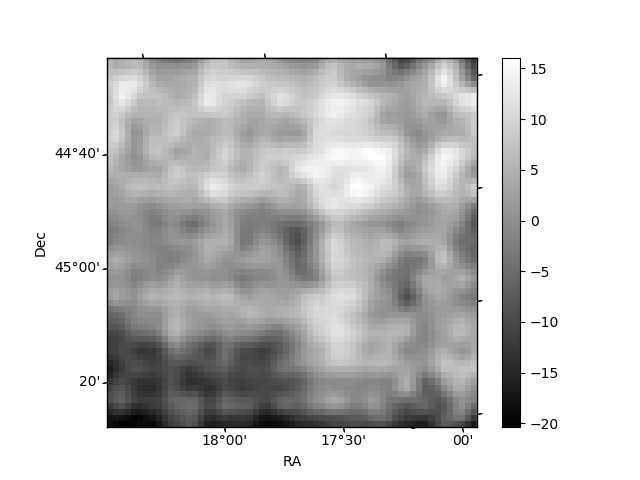
Histogram calculated using DETX and DETY for each event in the final _common_clean file
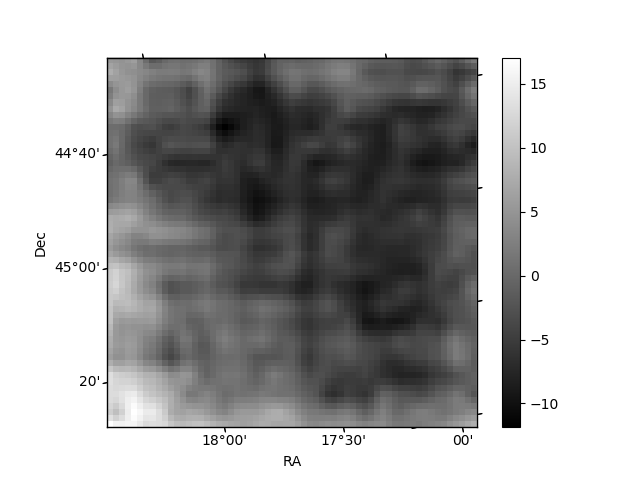
| Quadrant A | 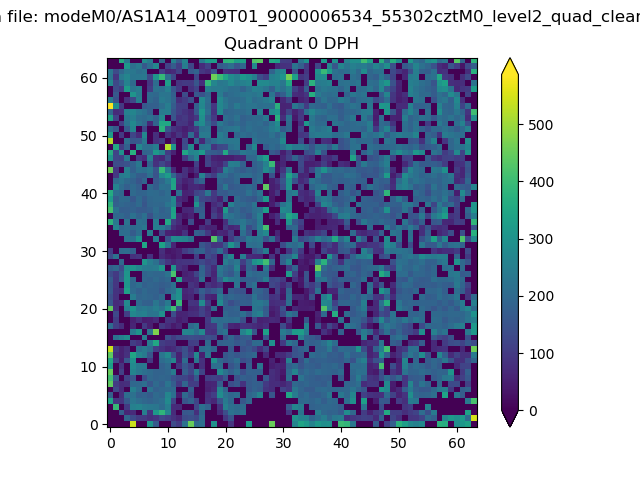 |
 |
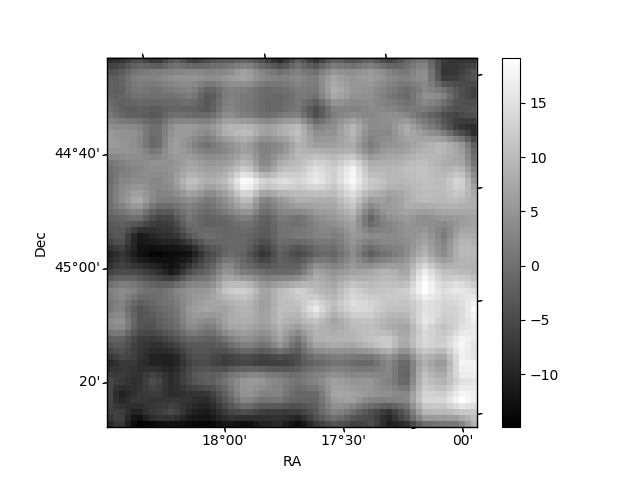
Quadrant B |
|---|---|---|---|
| Quadrant D | 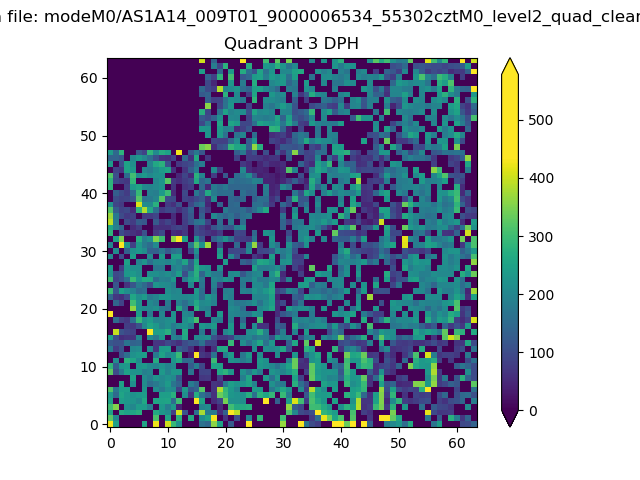 |
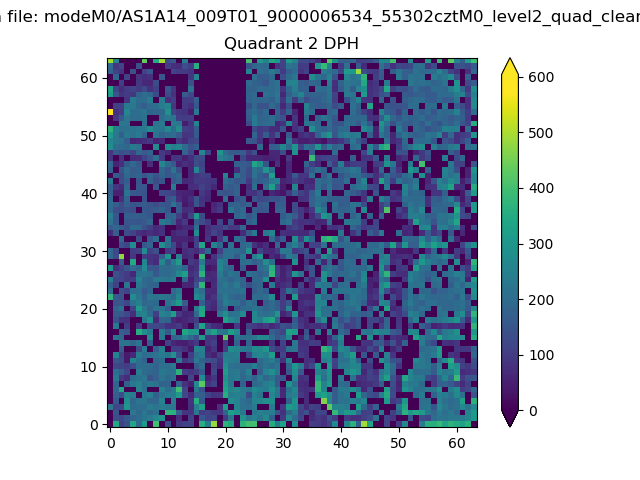 |
Quadrant C |
| Plot type | Count rate plots | Images |
|---|---|---|
| Comparison with Poisson distribution Blue bars denote a histogram of data divided into 1 sec bins. Red curve is a Poisson curve with rate = median count rate of data. |
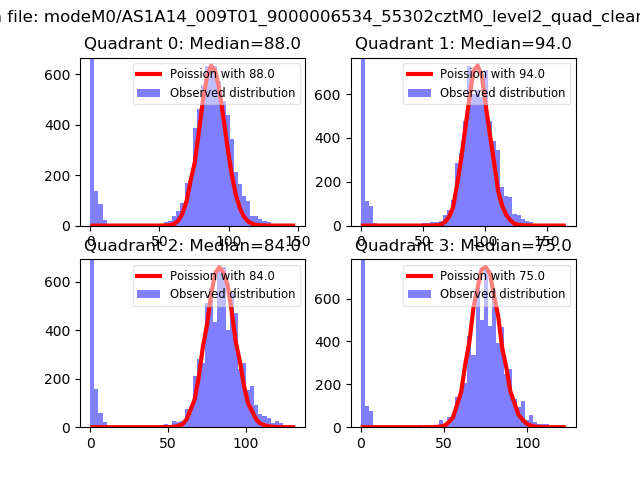 |
 |
| Quadrant-wise count rates Data is divided into 100 sec bins |
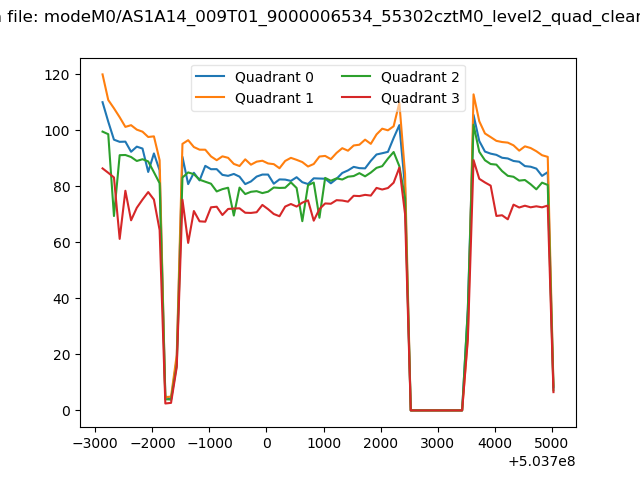 |
|
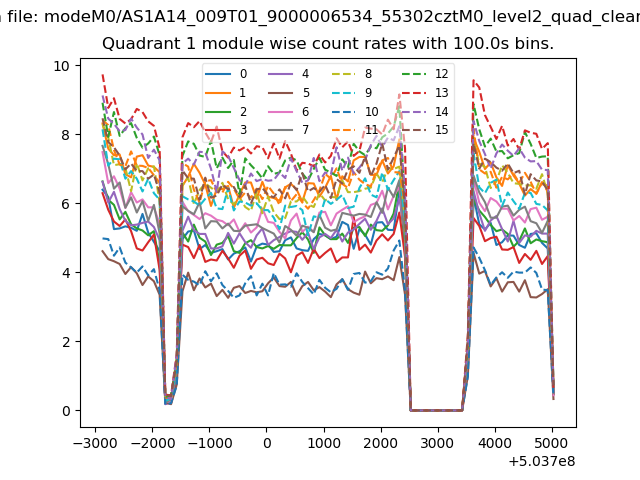
| Module-wise count rates for Quadrant A Data is divided into 100 sec bins |
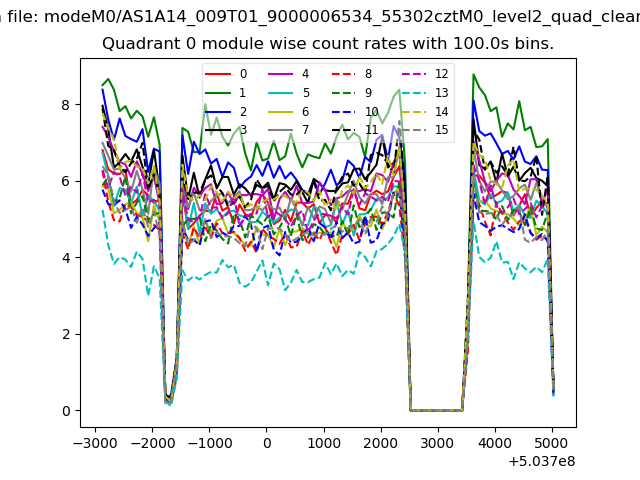 |
 |
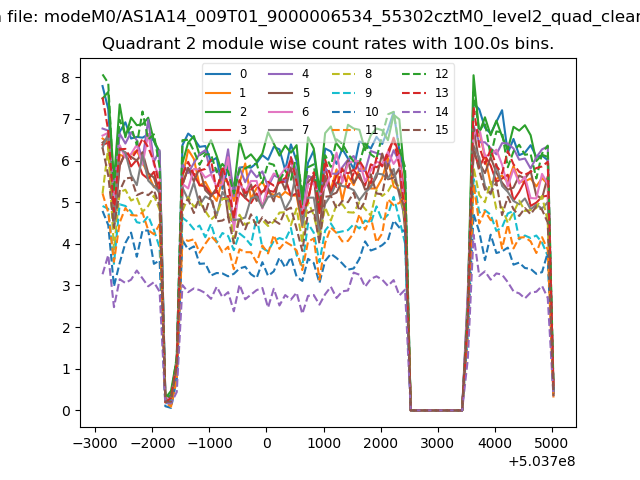
| Module-wise count rates for Quadrant B Data is divided into 100 sec bins |
 |
 |
| Module-wise count rates for Quadrant C Data is divided into 100 sec bins |
 |
 |
| Module-wise count rates for Quadrant D Data is divided into 100 sec bins |
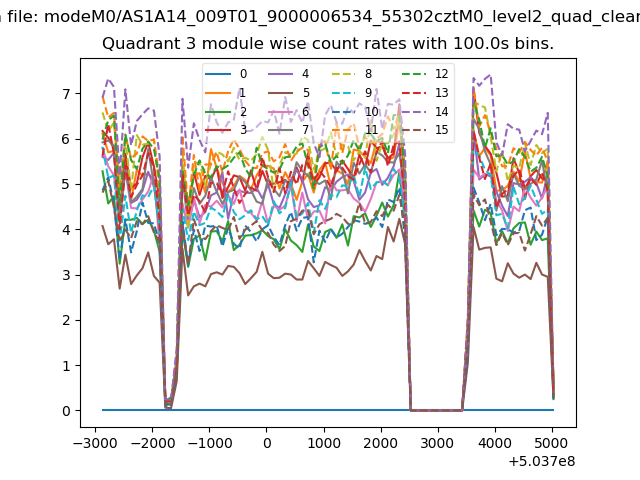 |
 |
| Parameter | Plot |
|---|---|
| CZT HV Monitor | 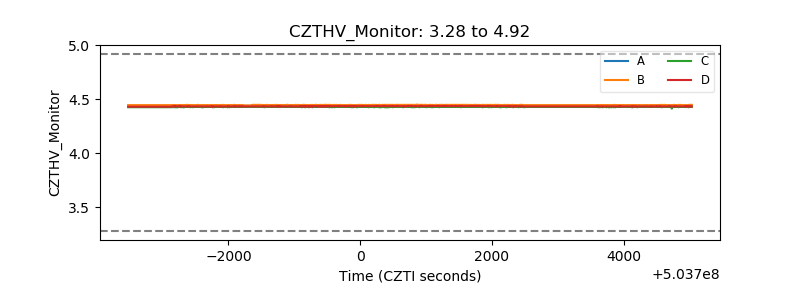 |
| D_VDD | 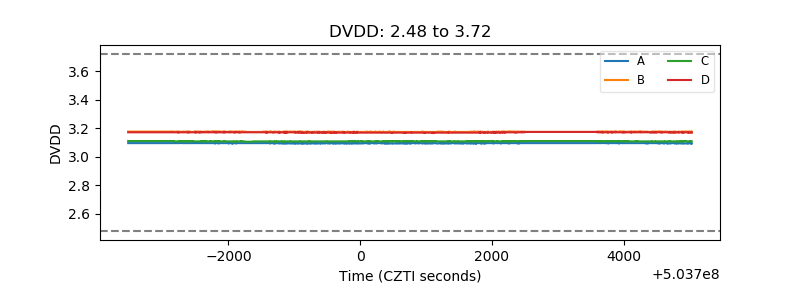 |
| Temperature 1 | 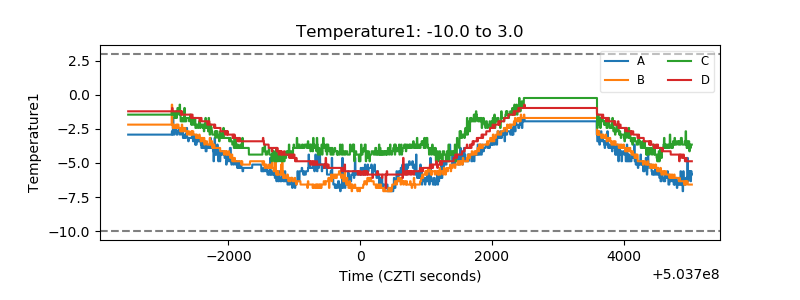 |
| Veto HV Monitor | 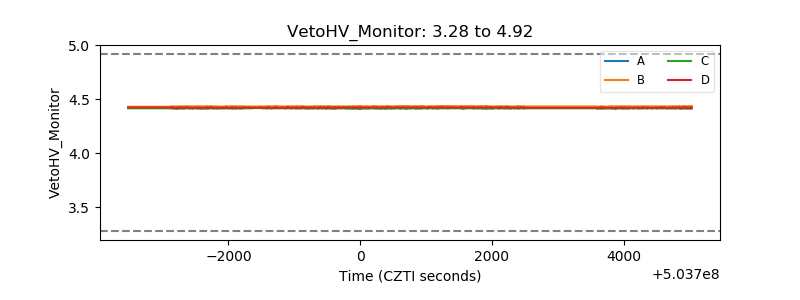 |
| Veto LLD | 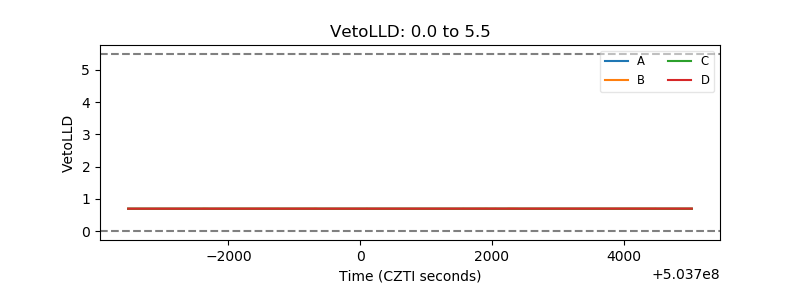 |
| Alpha Counter | 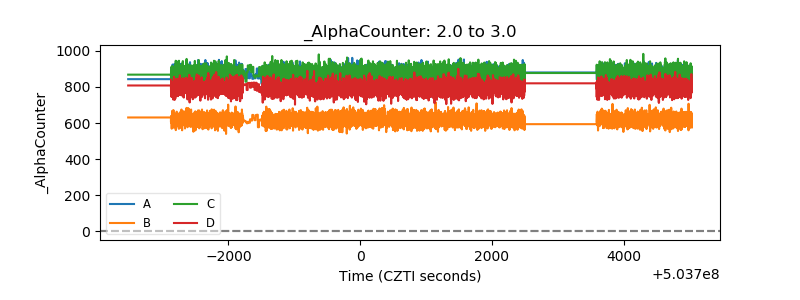 |
| _CPM_Rate | 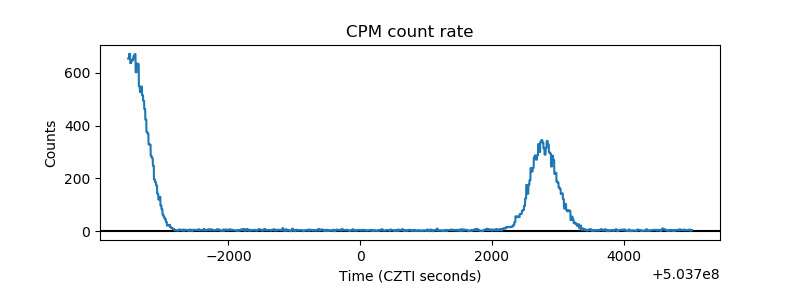 |
| CZT Counter | 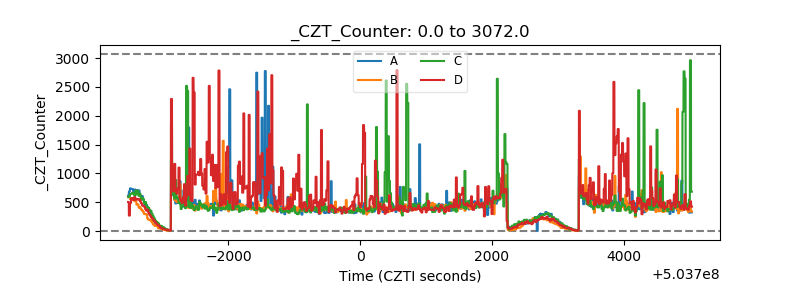 |
| +2.5 Volts monitor |  |
| +5 Volts monitor |  |
| _ROLL_ROT | 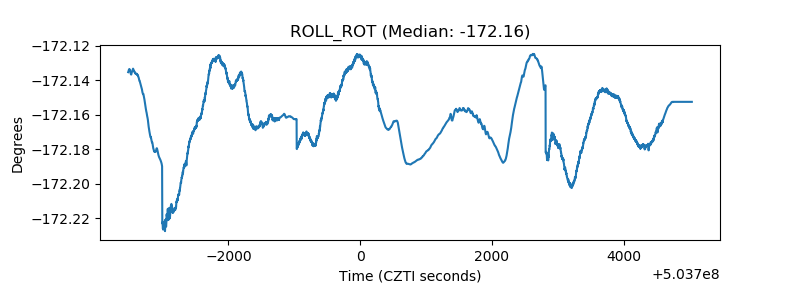 |
| _Roll_DEC | 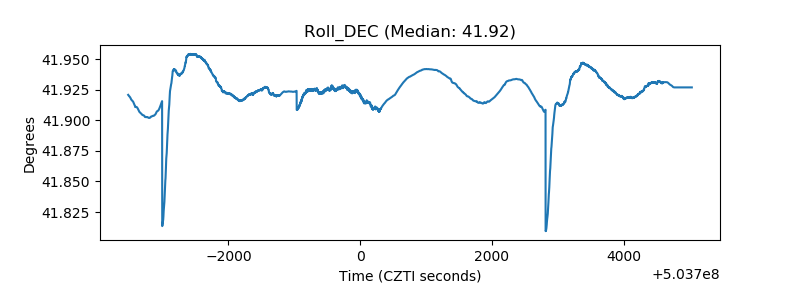 |
| _Roll_RA | 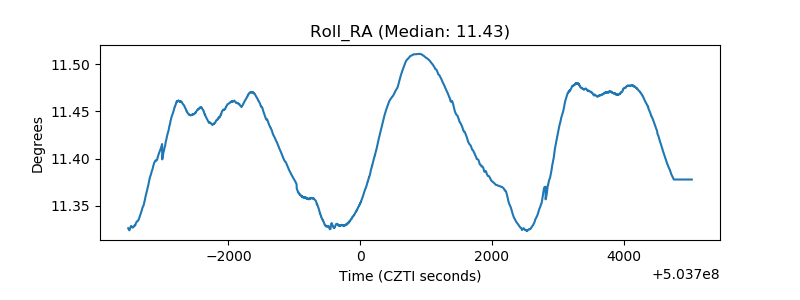 |
| Veto Counter | 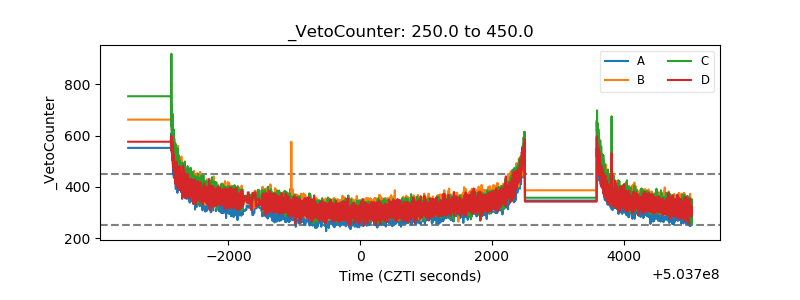 |