| Param | Original file | Final file |
|---|---|---|
| Filename | modeM0/AS1A14_009T01_9000006534_55304cztM0_level2.fits | modeM0/AS1A14_009T01_9000006534_55304cztM0_level2_quad_clean.evt |
| Size (bytes) | 408,715,200 | 92,885,760 |
| Size | 389.8 MB | 88.6 MB |
| Events in quadrant A | 3,654,456 | 589,870 |
| Events in quadrant B | 3,404,547 | 621,087 |
| Events in quadrant C | 3,618,057 | 558,361 |
| Events in quadrant D | 3,873,993 | 525,457 |
| Mode SS | |||
|---|---|---|---|
| Quadrant | BADHDUFLAG | Total packets | Discarded packets |
| A | 0 | 156 | 0 |
| B | 0 | 156 | 0 |
| C | 0 | 156 | 0 |
| D | 0 | 156 | 0 |
| Mode M0 | |||
|---|---|---|---|
| Quadrant | BADHDUFLAG | Total packets | Discarded packets |
| A | 0 | 16602 | 3 |
| B | 0 | 15939 | 3 |
| C | 0 | 16566 | 3 |
| D | 0 | 17149 | 3 |
| Mode M9 | |||
|---|---|---|---|
| Quadrant | BADHDUFLAG | Total packets | Discarded packets |
| A | 0 | 11 | 0 |
| B | 0 | 11 | 0 |
| C | 0 | 11 | 0 |
| D | 0 | 11 | 0 |
| Quadrant | Total seconds | Saturated seconds | Saturation percentage |
|---|---|---|---|
| A | 7427 | 107 | 1.440689% |
| B | 7427 | 136 | 1.831157% |
| C | 7427 | 160 | 2.154302% |
| D | 7427 | 93 | 1.252188% |
Noise dominated data is calculated using 1-second bins in cleaned event files. If a bin has >2000 counts, and if more than 50% of those come from <1% of pixels, then it is considered to be noise-dominated and hence unusable.
| Quadrant | # 1 sec bins | Bins with >0 counts | Bins with >2000 counts | High rate bins dominated by noise | Noise dominated (total time) | Noise dominated (detector-on time) | Marked lightcurve |
|---|---|---|---|---|---|---|---|
| A | 8952 | 7701 | 55 | 55 | 0.61% | 0.71% | 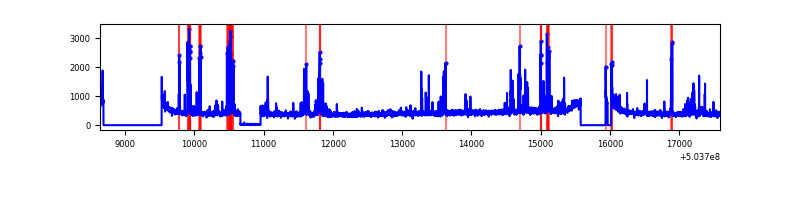 |
| B | 8952 | 7700 | 25 | 25 | 0.28% | 0.32% | 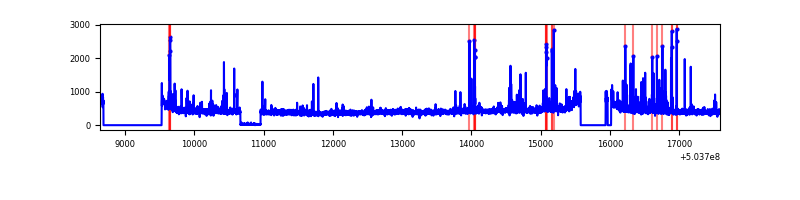 |
| C | 8952 | 7701 | 116 | 116 | 1.30% | 1.51% | 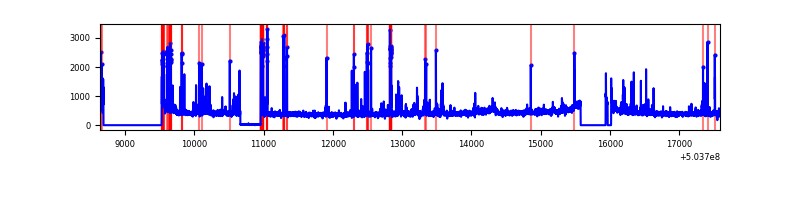 |
| D | 8952 | 7701 | 86 | 86 | 0.96% | 1.12% | 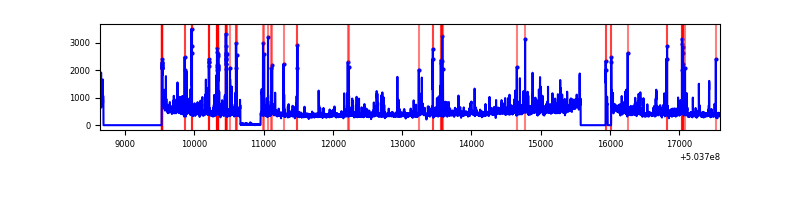 |
Top three noisy pixels from each quadrant. If the there are fewer than three noisy pixels in the level2.evt file, extra rows are filled as -1
| Pixel properties | Quadrant properties | ||||||
|---|---|---|---|---|---|---|---|
| Quadrant | DetID | PixID | Counts | Sigma | Mean | Median | Sigma |
| A | 0 | 8 | 337183 | 1765.61 | 775 | 756 | 190.5 |
| A | 12 | 18 | 147801 | 771.71 | 775 | 756 | 190.5 |
| A | 3 | 14 | 35340 | 181.5 | 775 | 756 | 190.5 |
| B | 7 | 252 | 113690 | 679.32 | 770 | 740 | 166.3 |
| B | 0 | 199 | 108377 | 647.36 | 770 | 740 | 166.3 |
| B | 10 | 245 | 27125 | 158.69 | 770 | 740 | 166.3 |
| C | 13 | 3 | 213353 | 1019.51 | 760 | 750 | 208.5 |
| C | 12 | 249 | 149003 | 710.93 | 760 | 750 | 208.5 |
| C | 9 | 38 | 128201 | 611.17 | 760 | 750 | 208.5 |
| D | 6 | 239 | 220346 | 1027.34 | 757 | 725 | 213.8 |
| D | 2 | 31 | 160284 | 746.38 | 757 | 725 | 213.8 |
| D | 3 | 12 | 141626 | 659.1 | 757 | 725 | 213.8 |
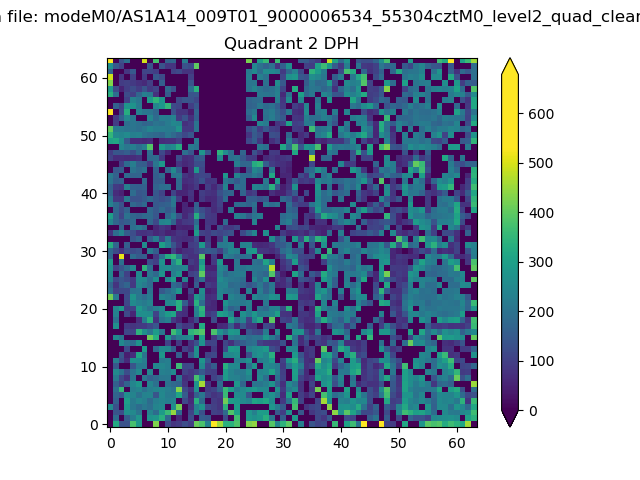
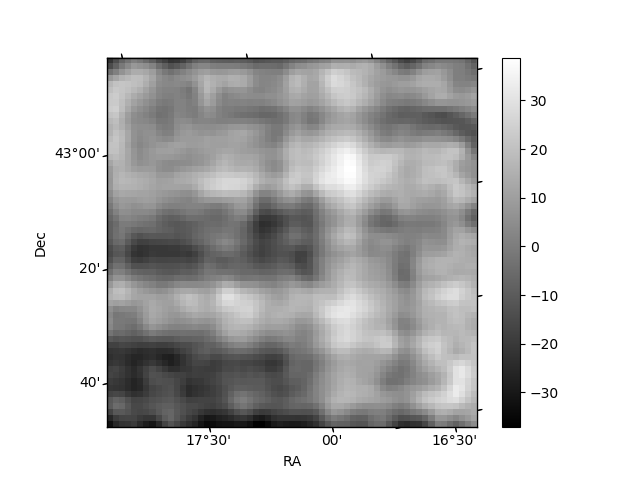
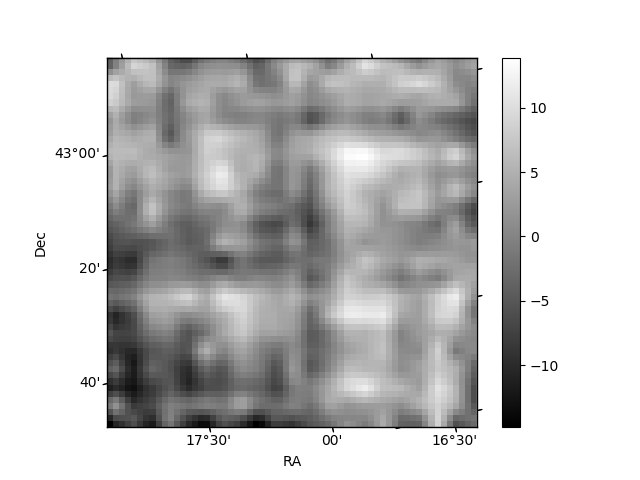
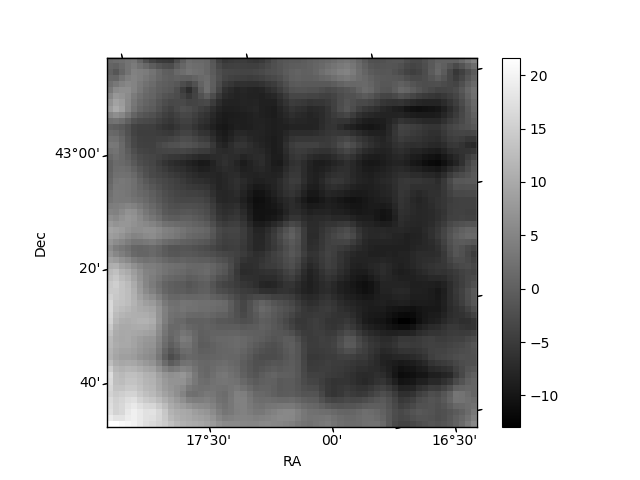
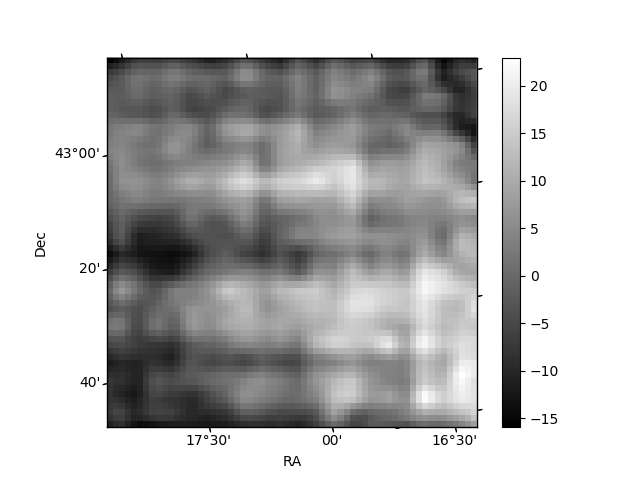
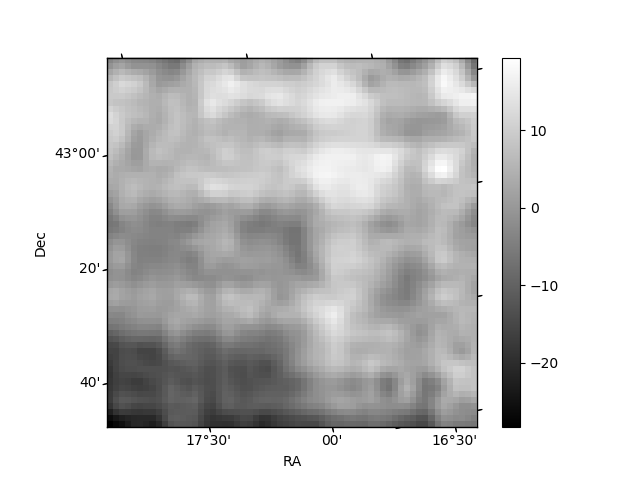
Histogram calculated using DETX and DETY for each event in the final _common_clean file
| Quadrant A | 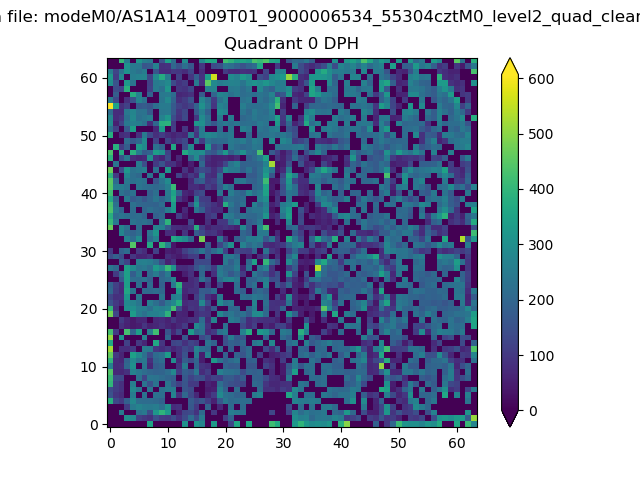 |
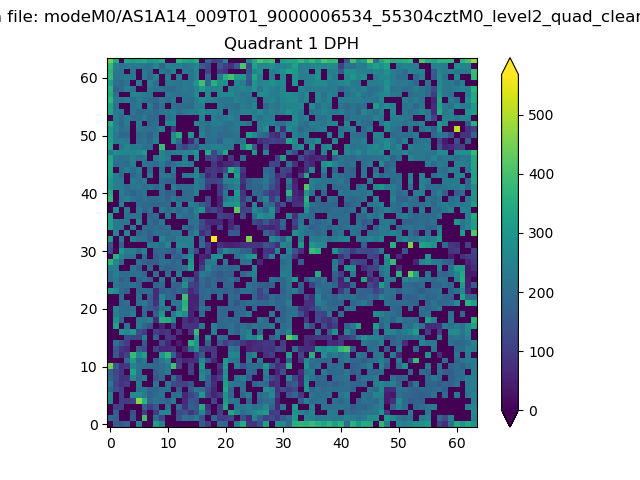 |
Quadrant B |
|---|---|---|---|
| Quadrant D | 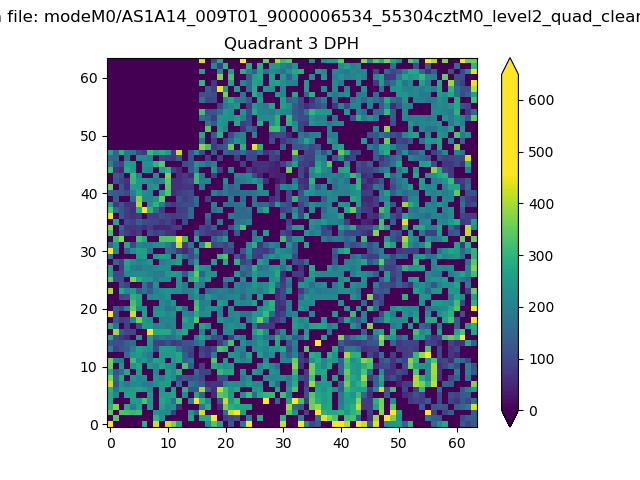 |
 |
Quadrant C |
| Plot type | Count rate plots | Images |
|---|---|---|
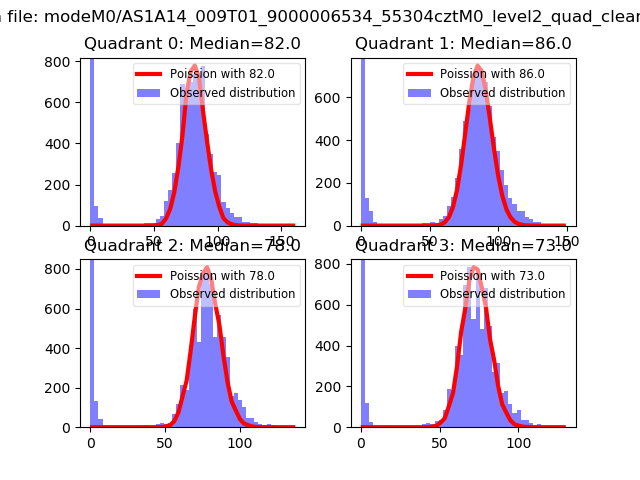
| Comparison with Poisson distribution Blue bars denote a histogram of data divided into 1 sec bins. Red curve is a Poisson curve with rate = median count rate of data. |
 |
 |
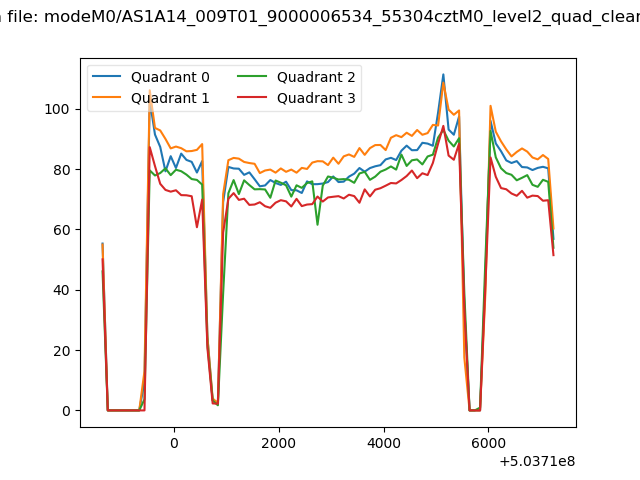
| Quadrant-wise count rates Data is divided into 100 sec bins |
 |
|
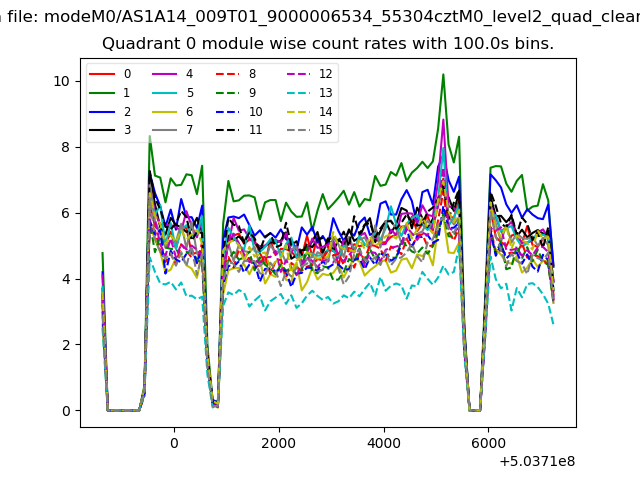
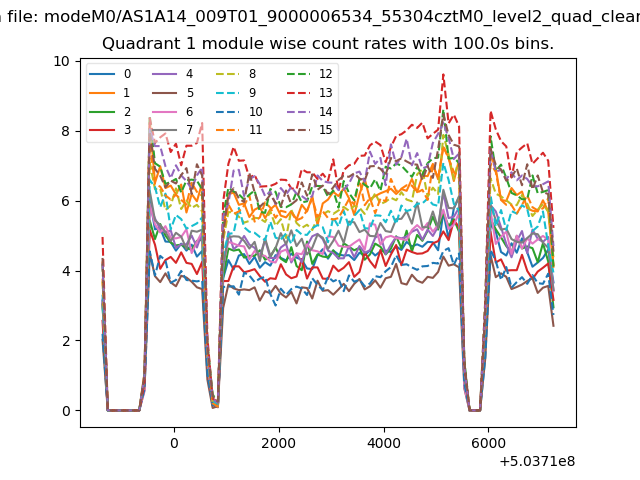
| Module-wise count rates for Quadrant A Data is divided into 100 sec bins |
 |
 |
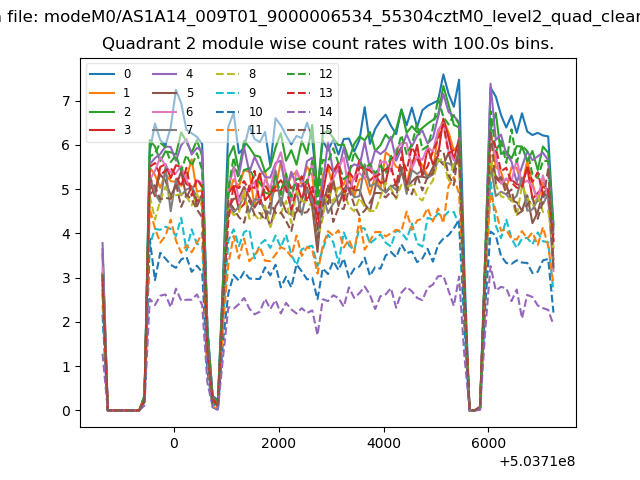
| Module-wise count rates for Quadrant B Data is divided into 100 sec bins |
 |
 |
| Module-wise count rates for Quadrant C Data is divided into 100 sec bins |
 |
 |
| Module-wise count rates for Quadrant D Data is divided into 100 sec bins |
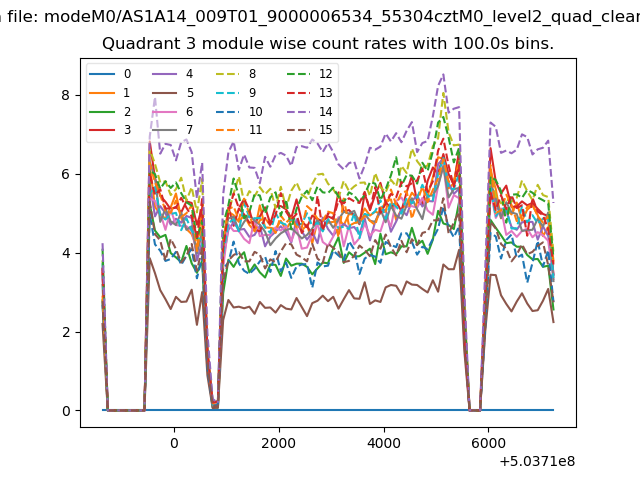 |
 |
| Parameter | Plot |
|---|---|
| CZT HV Monitor | 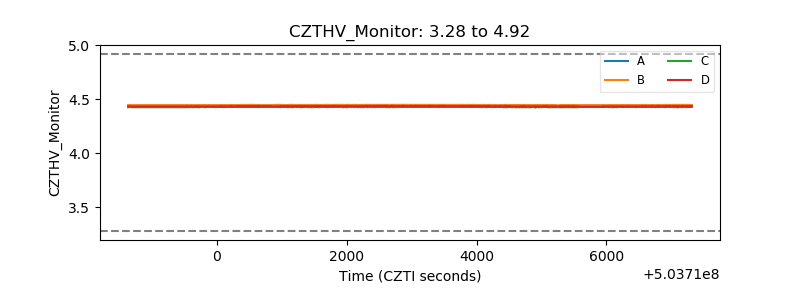 |
| D_VDD |  |
| Temperature 1 | 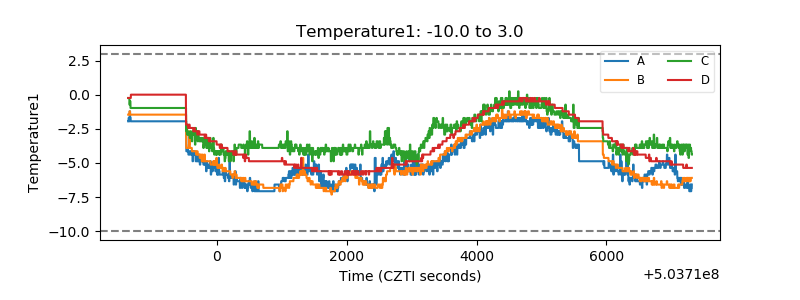 |
| Veto HV Monitor | 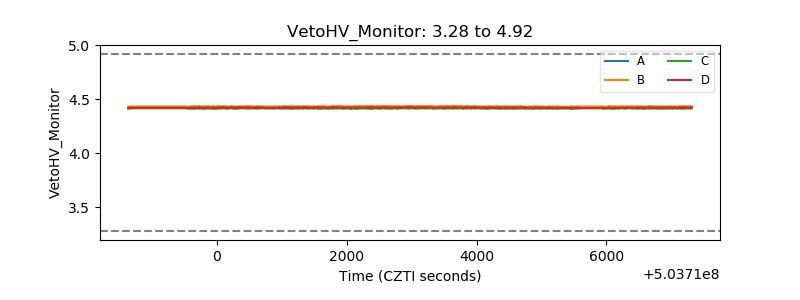 |
| Veto LLD | 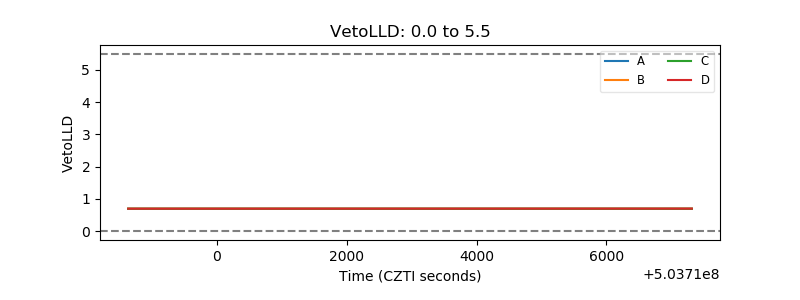 |
| Alpha Counter | 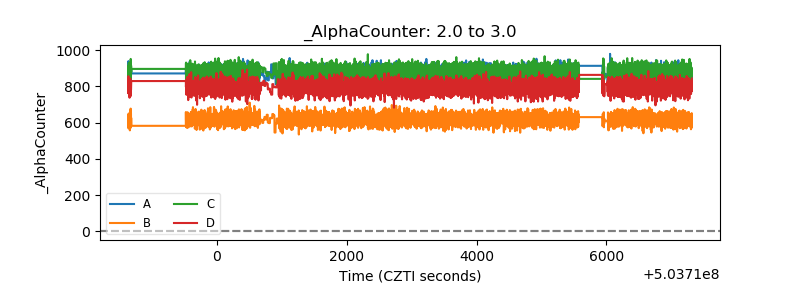 |
| _CPM_Rate | 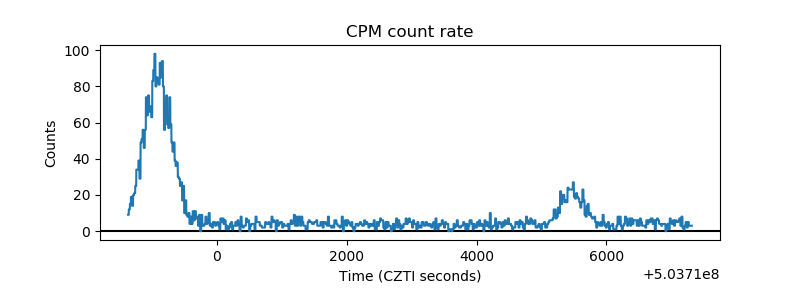 |
| CZT Counter | 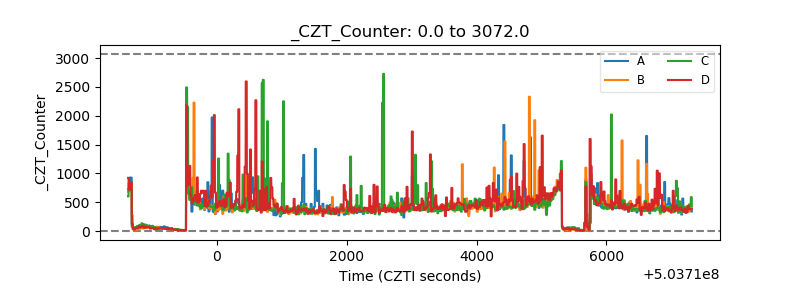 |
| +2.5 Volts monitor |  |
| +5 Volts monitor | 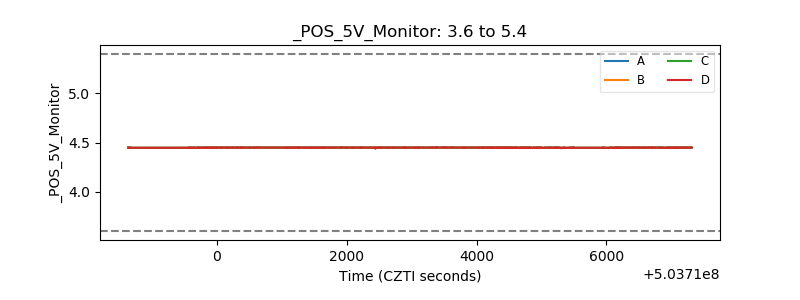 |
| _ROLL_ROT | 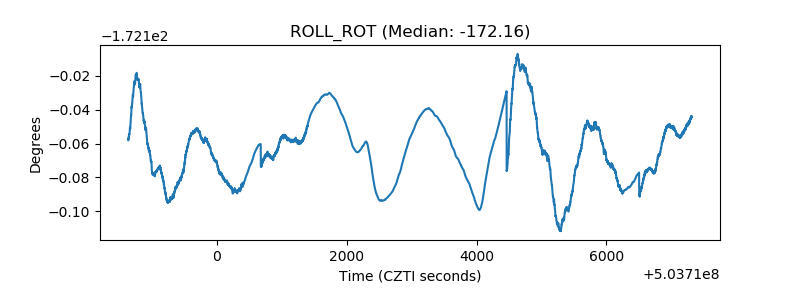 |
| _Roll_DEC | 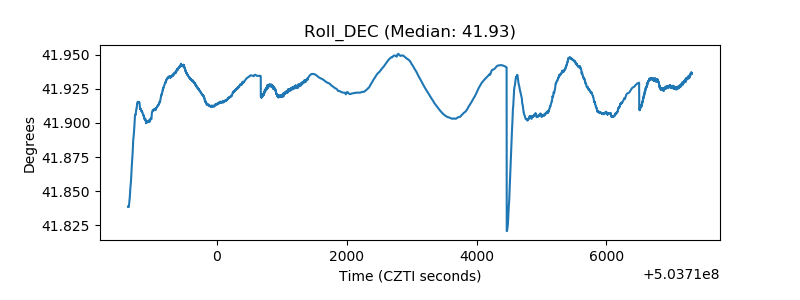 |
| _Roll_RA | 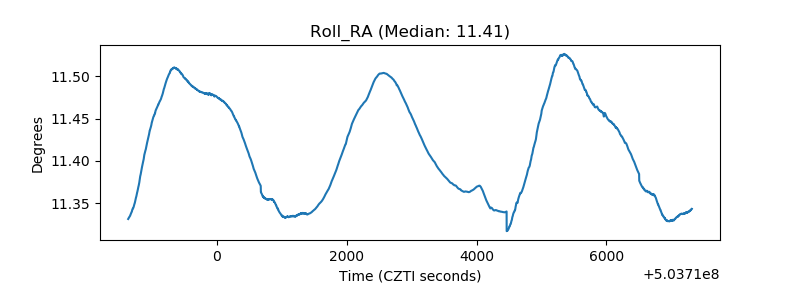 |
| Veto Counter | 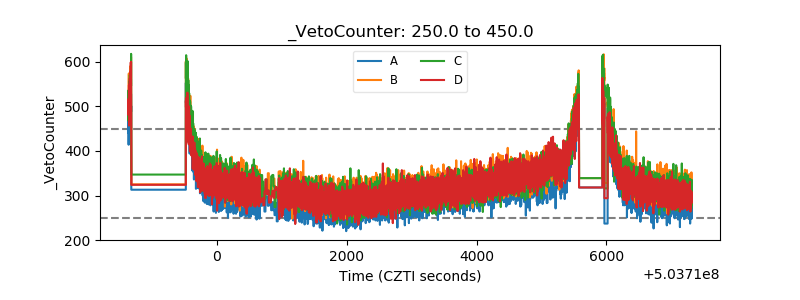 |