| Param | Original file | Final file |
|---|---|---|
| Filename | modeM0/AS1A14_009T01_9000006534_55305cztM0_level2.fits | modeM0/AS1A14_009T01_9000006534_55305cztM0_level2_quad_clean.evt |
| Size (bytes) | 512,507,520 | 127,126,080 |
| Size | 488.8 MB | 121.2 MB |
| Events in quadrant A | 4,707,531 | 821,740 |
| Events in quadrant B | 4,177,769 | 877,685 |
| Events in quadrant C | 4,115,805 | 795,381 |
| Events in quadrant D | 5,282,402 | 739,515 |
| Mode SS | |||
|---|---|---|---|
| Quadrant | BADHDUFLAG | Total packets | Discarded packets |
| A | 0 | 182 | 0 |
| B | 0 | 182 | 0 |
| C | 0 | 182 | 0 |
| D | 0 | 182 | 0 |
| Mode M0 | |||
|---|---|---|---|
| Quadrant | BADHDUFLAG | Total packets | Discarded packets |
| A | 0 | 20467 | 2 |
| B | 0 | 19082 | 2 |
| C | 0 | 19043 | 2 |
| D | 0 | 22381 | 2 |
| Mode M9 | |||
|---|---|---|---|
| Quadrant | BADHDUFLAG | Total packets | Discarded packets |
| A | 0 | 3 | 0 |
| B | 0 | 3 | 0 |
| C | 0 | 3 | 0 |
| D | 0 | 3 | 0 |
| Quadrant | Total seconds | Saturated seconds | Saturation percentage |
|---|---|---|---|
| A | 8848 | 131 | 1.480561% |
| B | 8849 | 125 | 1.412589% |
| C | 8849 | 50 | 0.565036% |
| D | 8849 | 273 | 3.085094% |
Noise dominated data is calculated using 1-second bins in cleaned event files. If a bin has >2000 counts, and if more than 50% of those come from <1% of pixels, then it is considered to be noise-dominated and hence unusable.
| Quadrant | # 1 sec bins | Bins with >0 counts | Bins with >2000 counts | High rate bins dominated by noise | Noise dominated (total time) | Noise dominated (detector-on time) | Marked lightcurve |
|---|---|---|---|---|---|---|---|
| A | 9258 | 8850 | 103 | 103 | 1.11% | 1.16% | 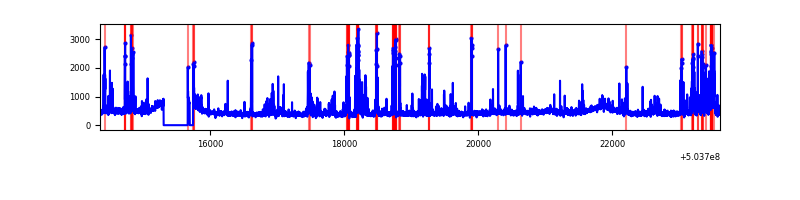 |
| B | 9259 | 8850 | 23 | 23 | 0.25% | 0.26% | 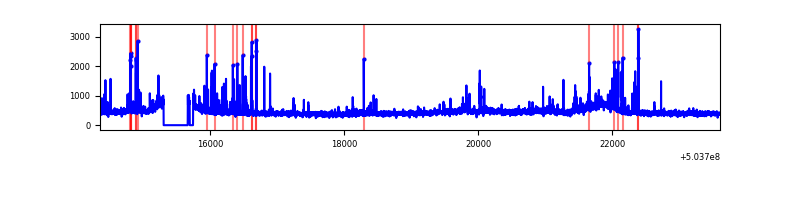 |
| C | 9259 | 8851 | 30 | 30 | 0.32% | 0.34% | 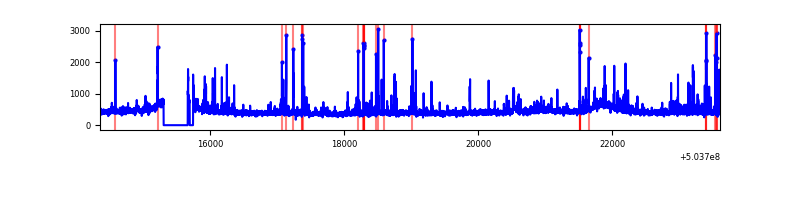 |
| D | 9259 | 8851 | 240 | 240 | 2.59% | 2.71% | 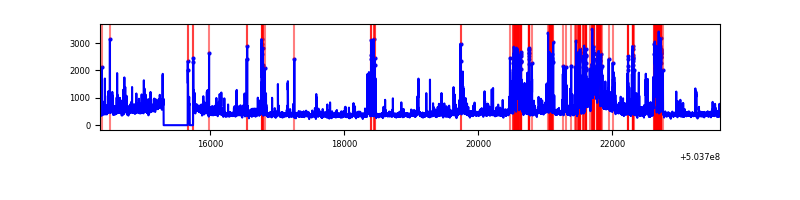 |
Top three noisy pixels from each quadrant. If the there are fewer than three noisy pixels in the level2.evt file, extra rows are filled as -1
| Pixel properties | Quadrant properties | ||||||
|---|---|---|---|---|---|---|---|
| Quadrant | DetID | PixID | Counts | Sigma | Mean | Median | Sigma |
| A | 12 | 18 | 501267 | 2176.73 | 940 | 915 | 229.9 |
| A | 0 | 8 | 286604 | 1242.86 | 940 | 915 | 229.9 |
| A | 12 | 194 | 72312 | 310.6 | 940 | 915 | 229.9 |
| B | 0 | 199 | 119086 | 590.67 | 934 | 897 | 200.1 |
| B | 0 | 197 | 110690 | 548.71 | 934 | 897 | 200.1 |
| B | 7 | 252 | 110206 | 546.29 | 934 | 897 | 200.1 |
| C | 13 | 3 | 195829 | 763.65 | 929 | 916 | 255.2 |
| C | 9 | 38 | 64301 | 248.34 | 929 | 916 | 255.2 |
| C | 14 | 254 | 43289 | 166.01 | 929 | 916 | 255.2 |
| D | 6 | 239 | 523162 | 2039.35 | 910 | 870 | 256.1 |
| D | 11 | 129 | 335546 | 1306.78 | 910 | 870 | 256.1 |
| D | 3 | 12 | 314190 | 1223.4 | 910 | 870 | 256.1 |
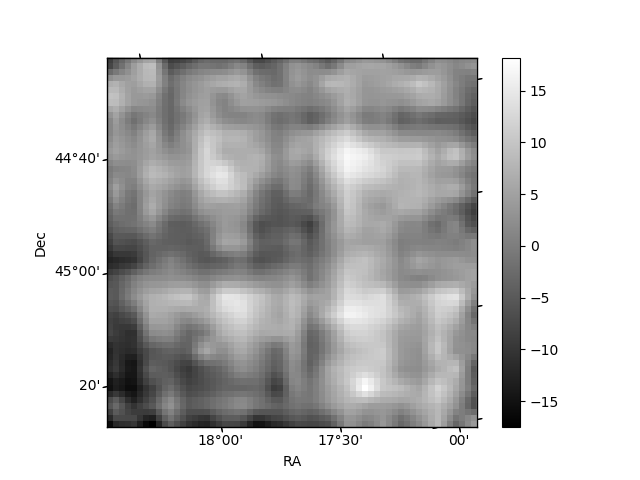
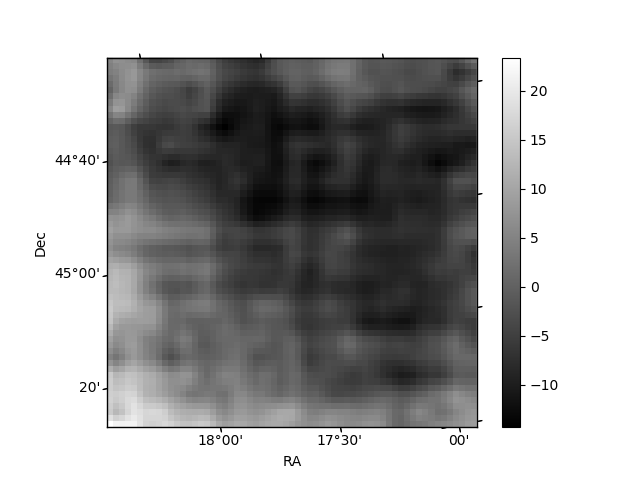
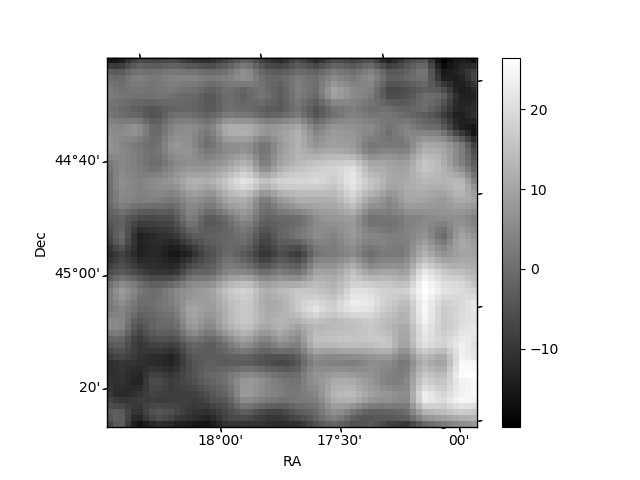
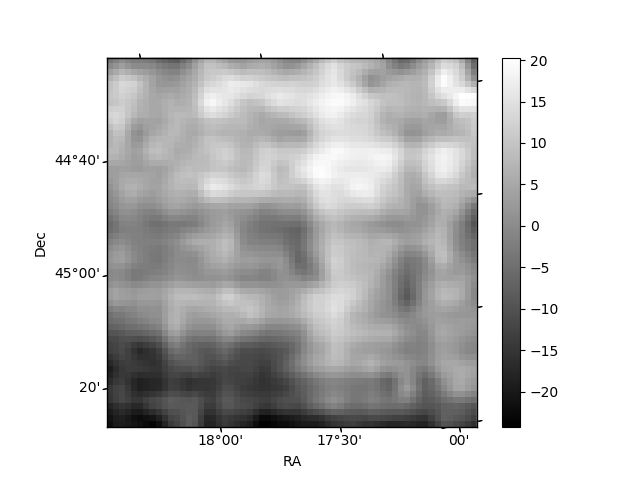
Histogram calculated using DETX and DETY for each event in the final _common_clean file
| Quadrant A | 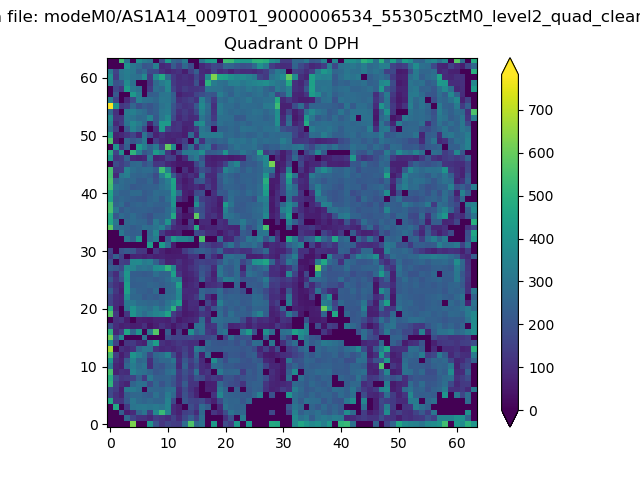 |
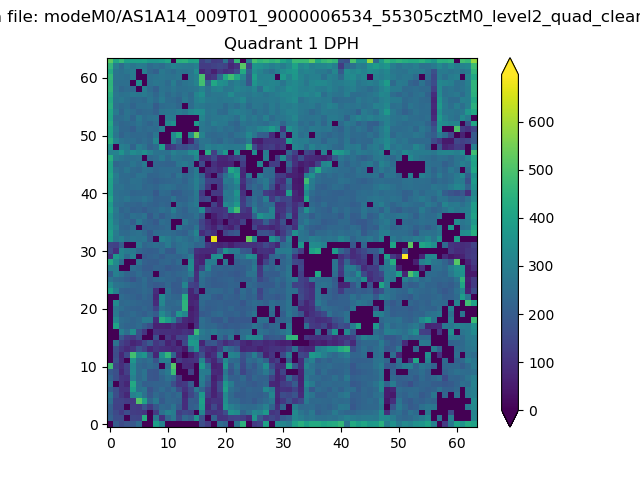 |
Quadrant B |
|---|---|---|---|
| Quadrant D | 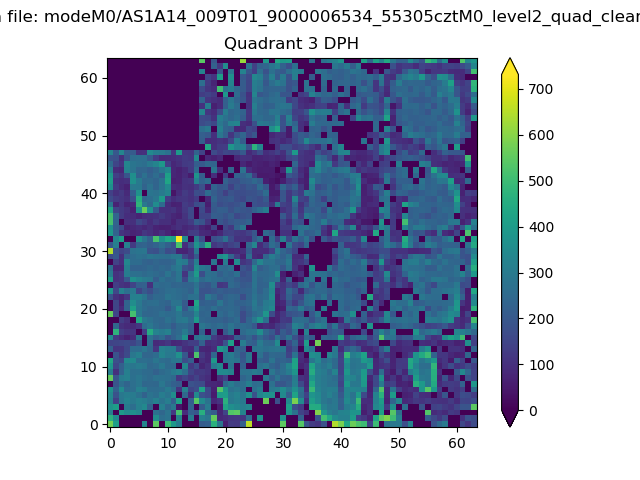 |
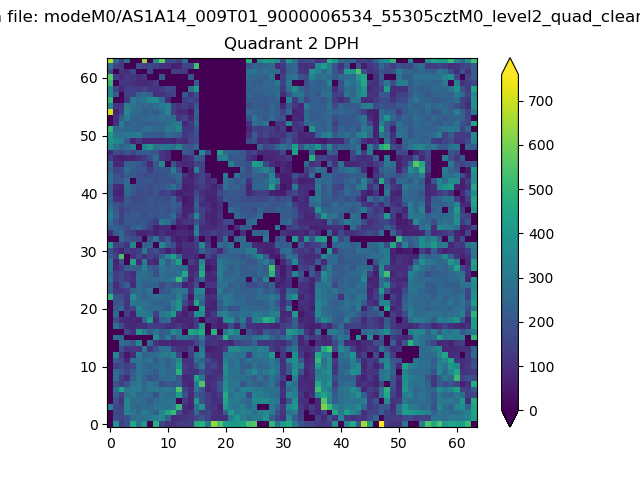 |
Quadrant C |
| Plot type | Count rate plots | Images |
|---|---|---|
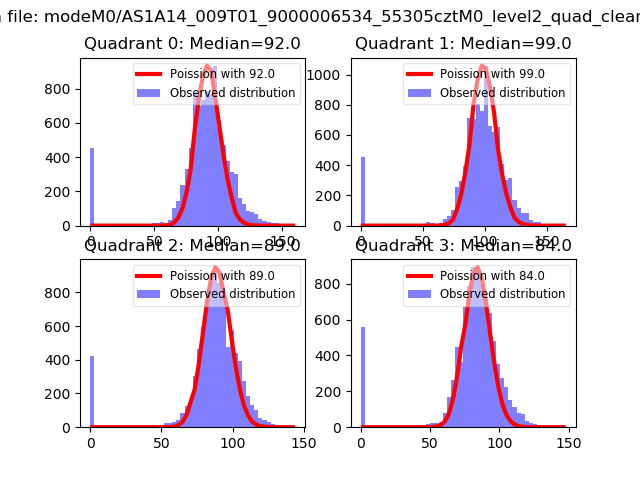
| Comparison with Poisson distribution Blue bars denote a histogram of data divided into 1 sec bins. Red curve is a Poisson curve with rate = median count rate of data. |
 |
 |
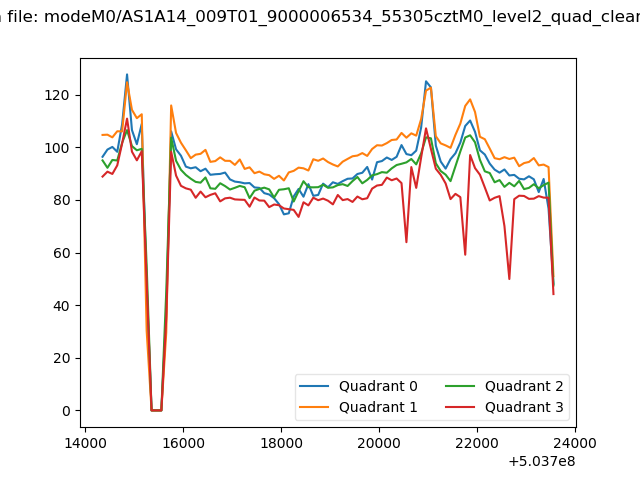
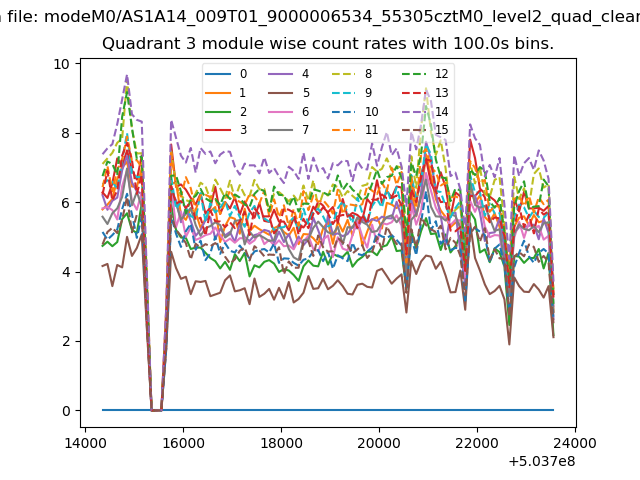
| Quadrant-wise count rates Data is divided into 100 sec bins |
 |
|
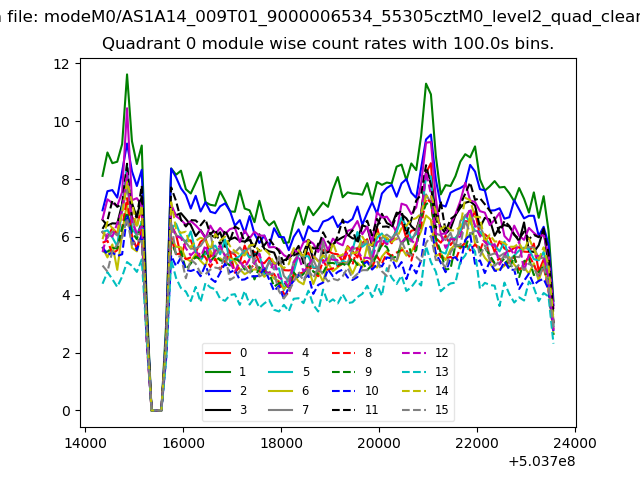
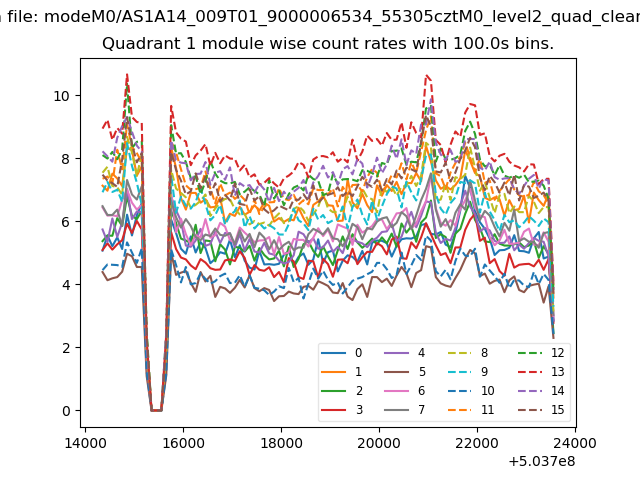
| Module-wise count rates for Quadrant A Data is divided into 100 sec bins |
 |
 |
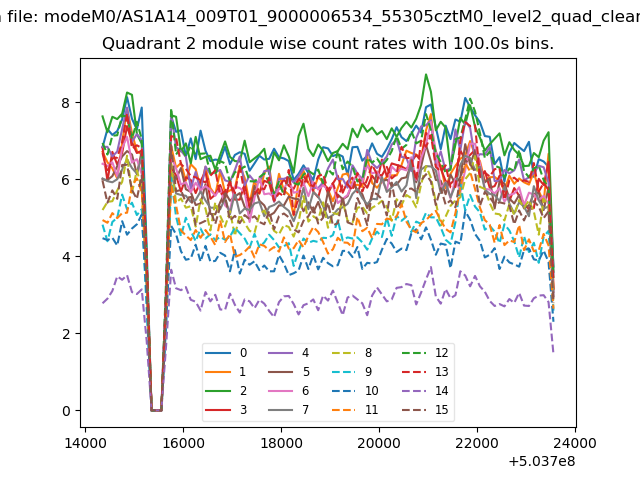
| Module-wise count rates for Quadrant B Data is divided into 100 sec bins |
 |
 |
| Module-wise count rates for Quadrant C Data is divided into 100 sec bins |
 |
 |
| Module-wise count rates for Quadrant D Data is divided into 100 sec bins |
 |
 |
| Parameter | Plot |
|---|---|
| CZT HV Monitor | 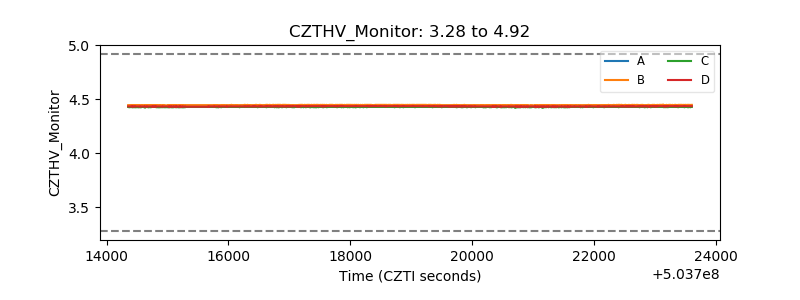 |
| D_VDD | 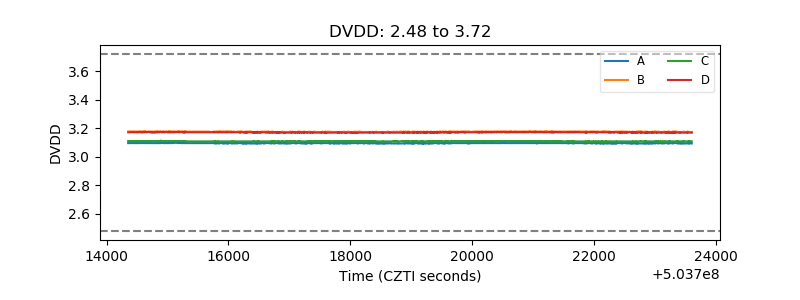 |
| Temperature 1 | 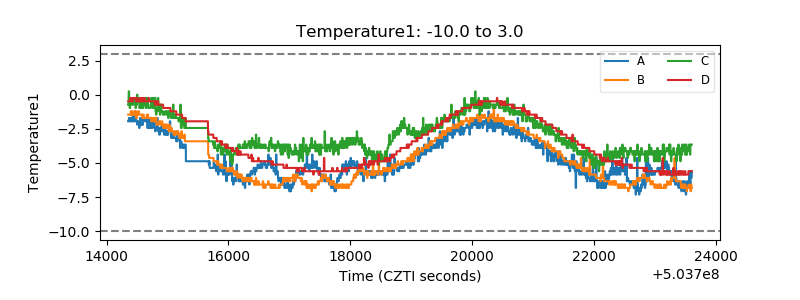 |
| Veto HV Monitor | 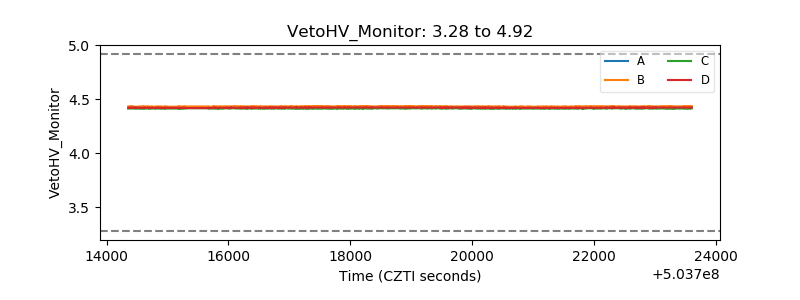 |
| Veto LLD | 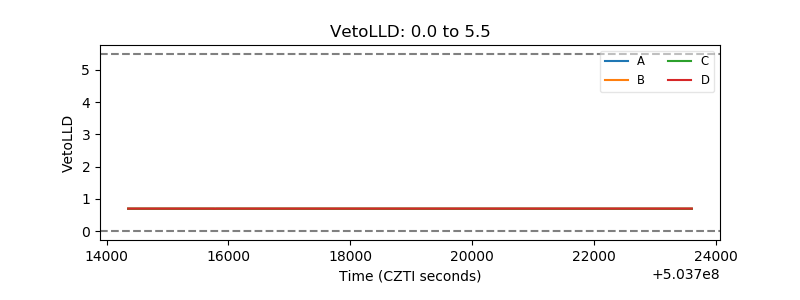 |
| Alpha Counter | 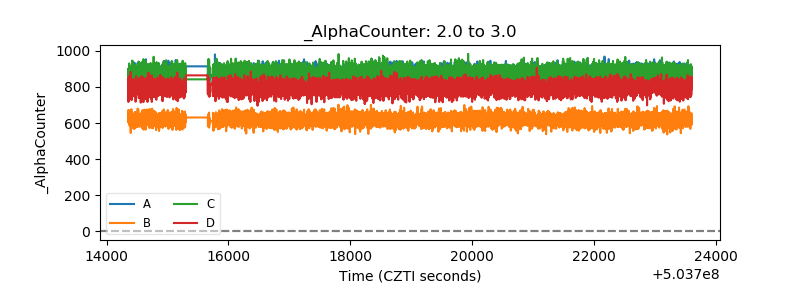 |
| _CPM_Rate | 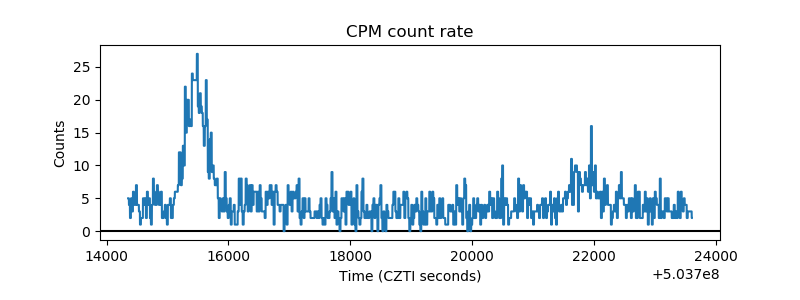 |
| CZT Counter | 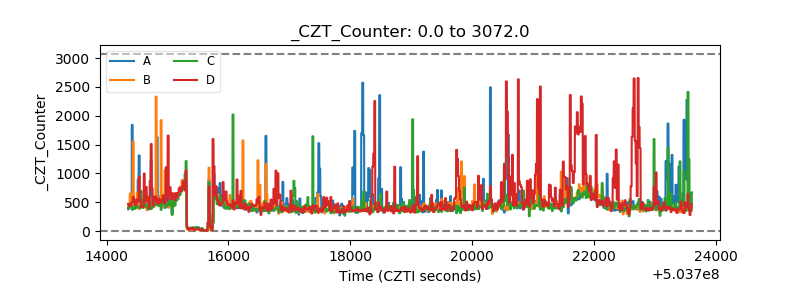 |
| +2.5 Volts monitor |  |
| +5 Volts monitor |  |
| _ROLL_ROT | 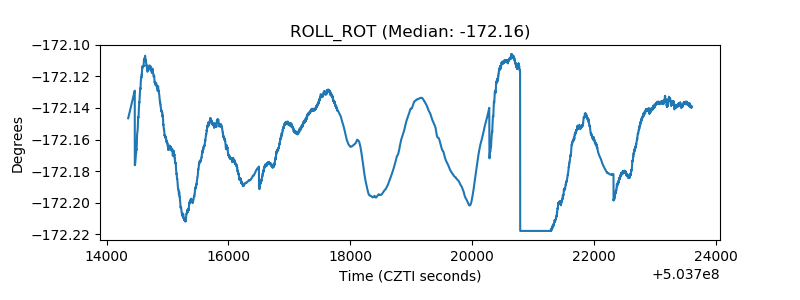 |
| _Roll_DEC | 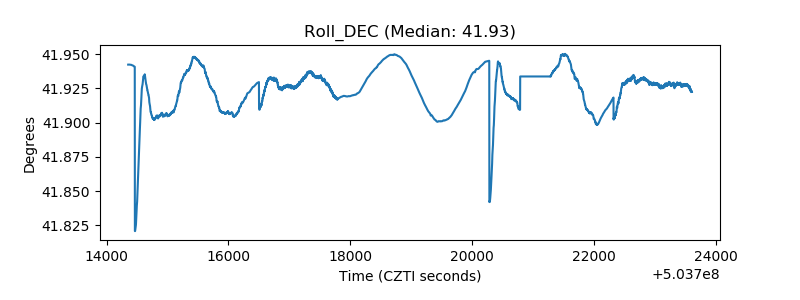 |
| _Roll_RA | 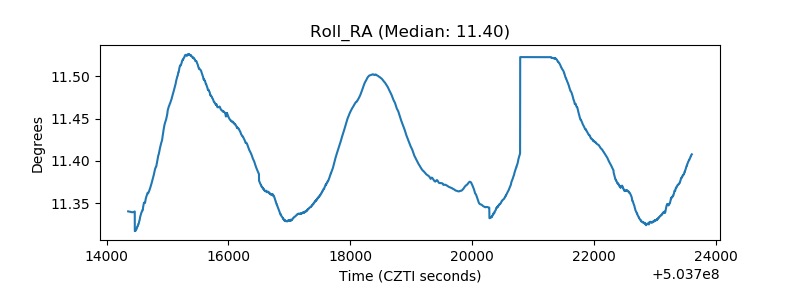 |
| Veto Counter | 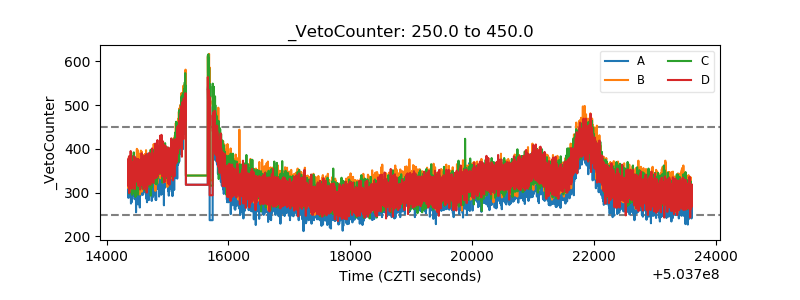 |