| Param | Original file | Final file |
|---|---|---|
| Filename | modeM0/AS1A14_009T01_9000006534_55319cztM0_level2.fits | modeM0/AS1A14_009T01_9000006534_55319cztM0_level2_quad_clean.evt |
| Size (bytes) | 560,658,240 | 108,299,520 |
| Size | 534.7 MB | 103.3 MB |
| Events in quadrant A | 5,910,861 | 680,488 |
| Events in quadrant B | 4,036,286 | 746,950 |
| Events in quadrant C | 4,451,656 | 657,458 |
| Events in quadrant D | 5,699,693 | 607,460 |
| Mode SS | |||
|---|---|---|---|
| Quadrant | BADHDUFLAG | Total packets | Discarded packets |
| A | 0 | 172 | 0 |
| B | 0 | 172 | 0 |
| C | 0 | 172 | 0 |
| D | 0 | 172 | 0 |
| Mode M0 | |||
|---|---|---|---|
| Quadrant | BADHDUFLAG | Total packets | Discarded packets |
| A | 0 | 23440 | 2 |
| B | 0 | 18566 | 2 |
| C | 0 | 19704 | 2 |
| D | 0 | 22987 | 2 |
| Mode M9 | |||
|---|---|---|---|
| Quadrant | BADHDUFLAG | Total packets | Discarded packets |
| A | 0 | 6 | 0 |
| B | 0 | 6 | 0 |
| C | 0 | 6 | 0 |
| D | 0 | 6 | 0 |
| Quadrant | Total seconds | Saturated seconds | Saturation percentage |
|---|---|---|---|
| A | 8439 | 412 | 4.882095% |
| B | 8440 | 197 | 2.334123% |
| C | 8440 | 180 | 2.132701% |
| D | 8440 | 345 | 4.087678% |
Noise dominated data is calculated using 1-second bins in cleaned event files. If a bin has >2000 counts, and if more than 50% of those come from <1% of pixels, then it is considered to be noise-dominated and hence unusable.
| Quadrant | # 1 sec bins | Bins with >0 counts | Bins with >2000 counts | High rate bins dominated by noise | Noise dominated (total time) | Noise dominated (detector-on time) | Marked lightcurve |
|---|---|---|---|---|---|---|---|
| A | 9398 | 8713 | 311 | 311 | 3.31% | 3.57% | 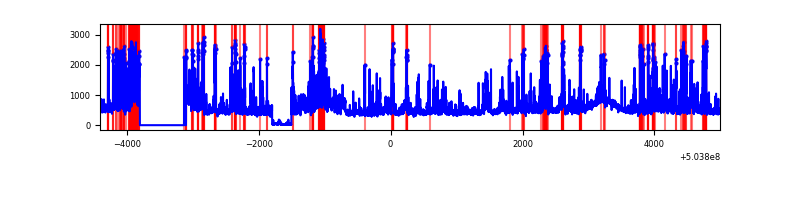 |
| B | 9399 | 8714 | 49 | 49 | 0.52% | 0.56% | 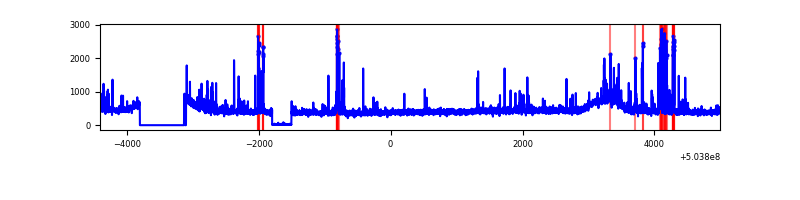 |
| C | 9399 | 8716 | 136 | 136 | 1.45% | 1.56% | 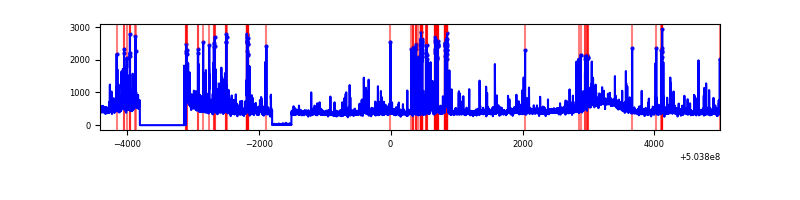 |
| D | 9399 | 8714 | 332 | 332 | 3.53% | 3.81% | 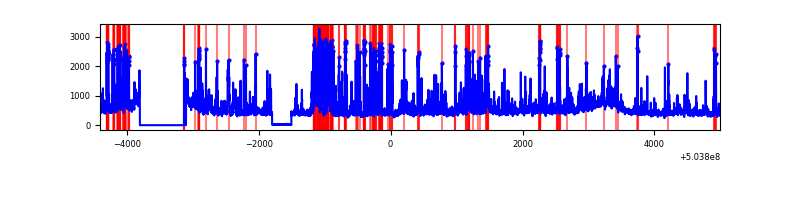 |
Top three noisy pixels from each quadrant. If the there are fewer than three noisy pixels in the level2.evt file, extra rows are filled as -1
| Pixel properties | Quadrant properties | ||||||
|---|---|---|---|---|---|---|---|
| Quadrant | DetID | PixID | Counts | Sigma | Mean | Median | Sigma |
| A | 3 | 78 | 1160344 | 5303.87 | 893 | 869 | 218.6 |
| A | 0 | 8 | 521240 | 2380.37 | 893 | 869 | 218.6 |
| A | 3 | 14 | 375763 | 1714.9 | 893 | 869 | 218.6 |
| B | 2 | 249 | 163295 | 853.23 | 897 | 863 | 190.4 |
| B | 0 | 199 | 133204 | 695.16 | 897 | 863 | 190.4 |
| B | 7 | 252 | 103542 | 539.36 | 897 | 863 | 190.4 |
| C | 6 | 223 | 328974 | 1353.47 | 887 | 879 | 242.4 |
| C | 13 | 3 | 291777 | 1200.03 | 887 | 879 | 242.4 |
| C | 12 | 241 | 99884 | 408.42 | 887 | 879 | 242.4 |
| D | 8 | 160 | 1022698 | 4142.45 | 877 | 841 | 246.7 |
| D | 11 | 129 | 531400 | 2150.81 | 877 | 841 | 246.7 |
| D | 3 | 12 | 122365 | 492.64 | 877 | 841 | 246.7 |
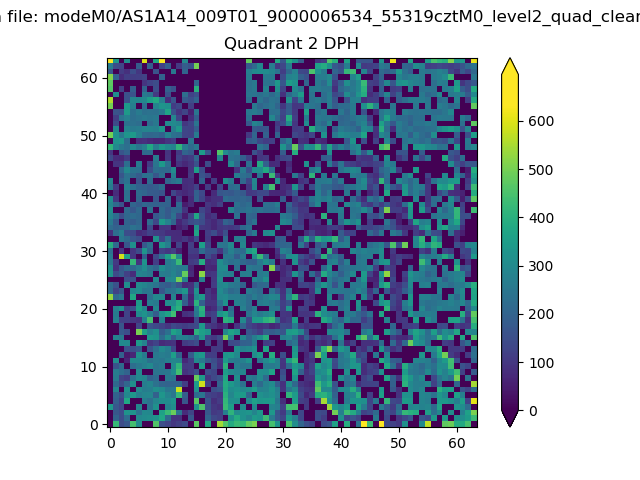
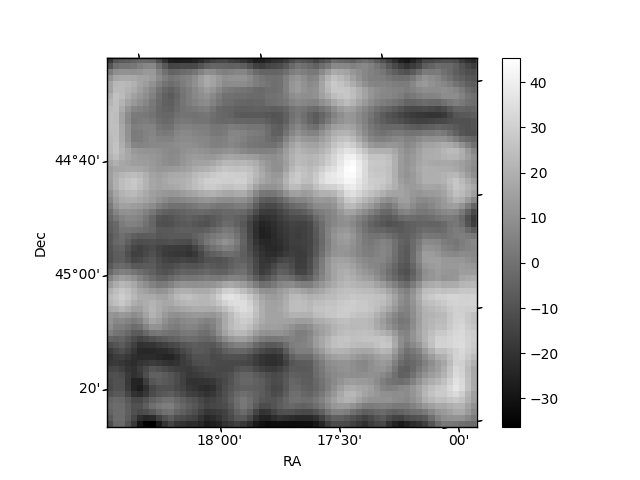
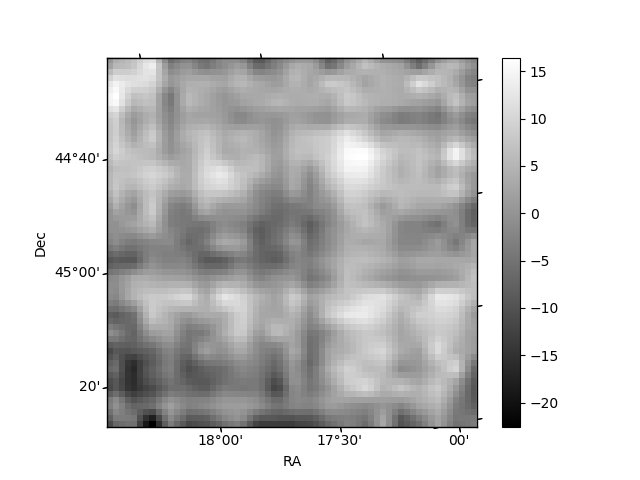
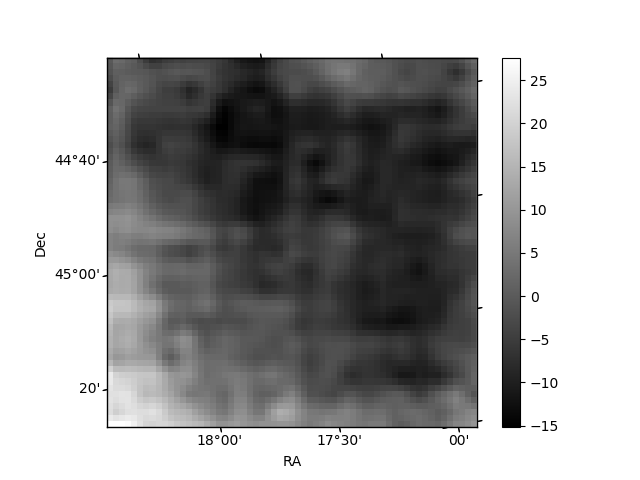
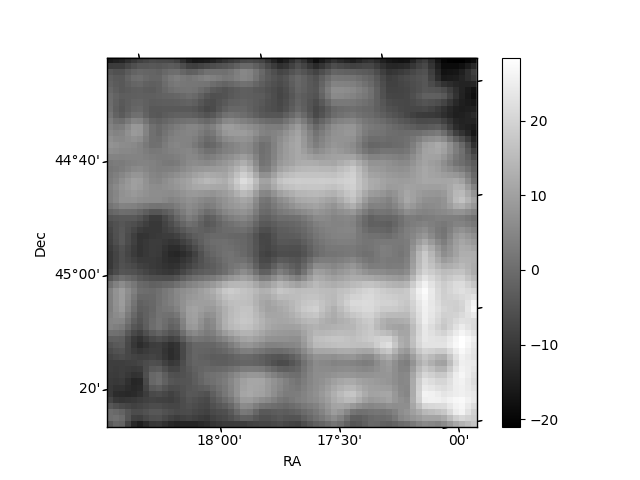
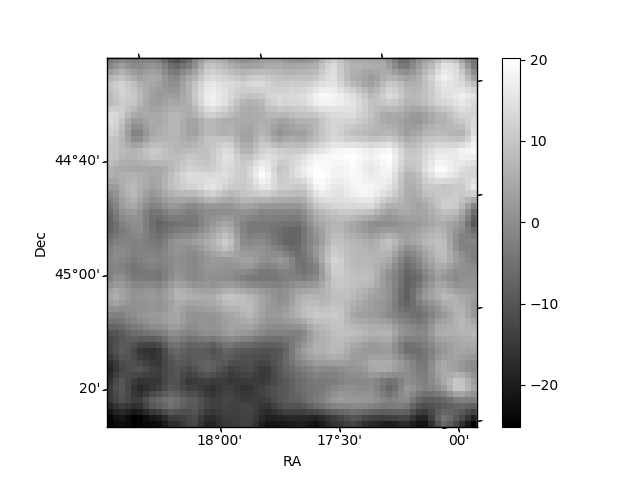
Histogram calculated using DETX and DETY for each event in the final _common_clean file
| Quadrant A | 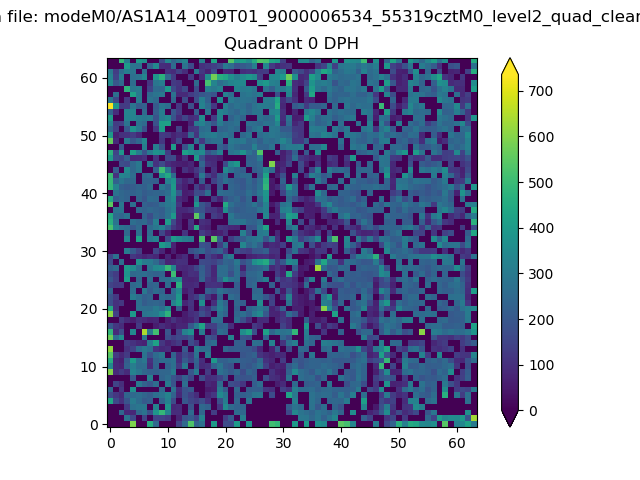 |
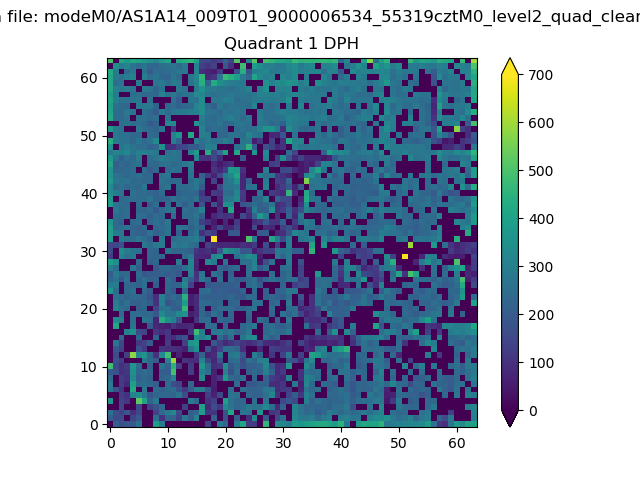 |
Quadrant B |
|---|---|---|---|
| Quadrant D | 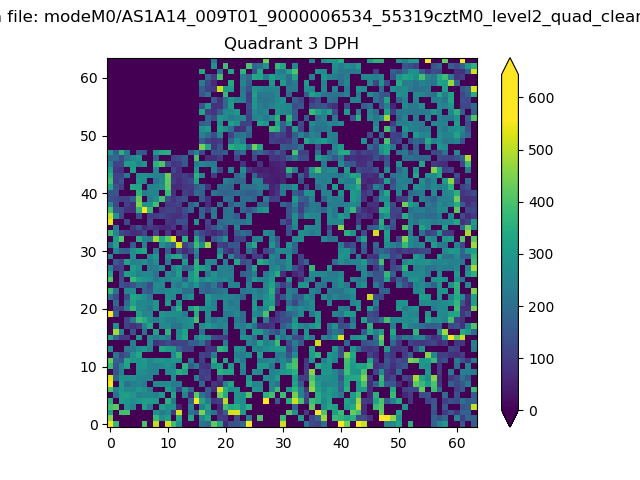 |
 |
Quadrant C |
| Plot type | Count rate plots | Images |
|---|---|---|
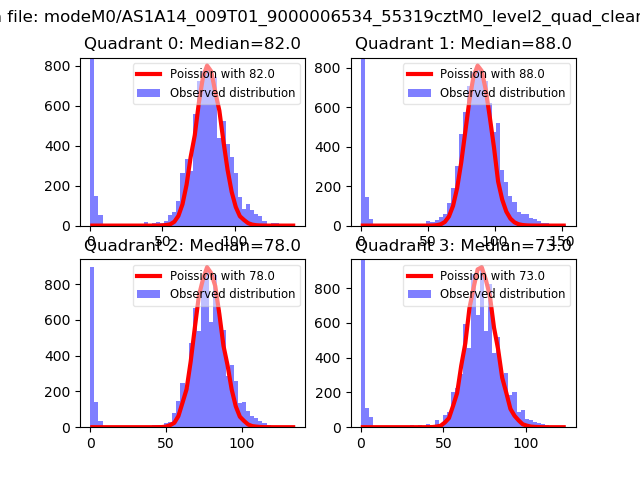
| Comparison with Poisson distribution Blue bars denote a histogram of data divided into 1 sec bins. Red curve is a Poisson curve with rate = median count rate of data. |
 |
 |
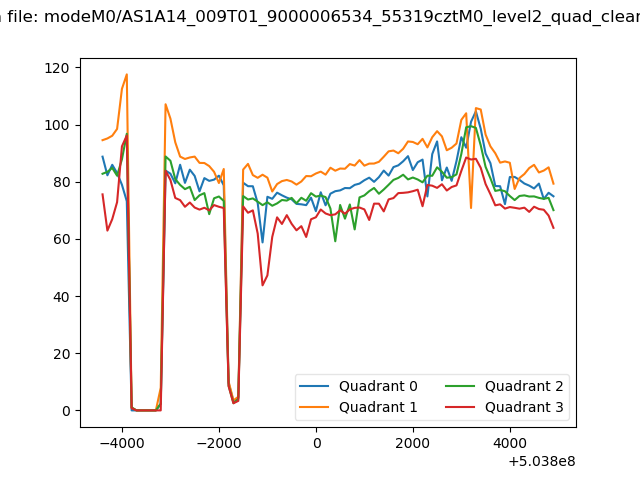
| Quadrant-wise count rates Data is divided into 100 sec bins |
 |
|
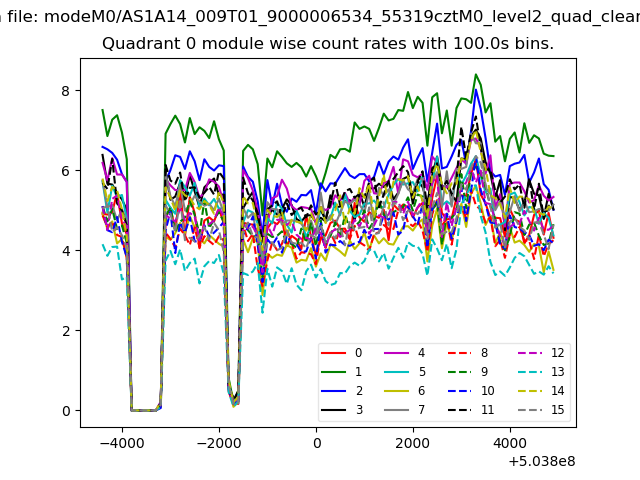
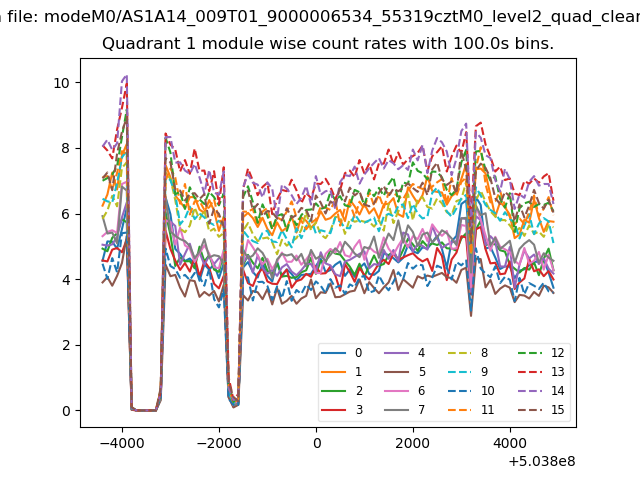
| Module-wise count rates for Quadrant A Data is divided into 100 sec bins |
 |
 |
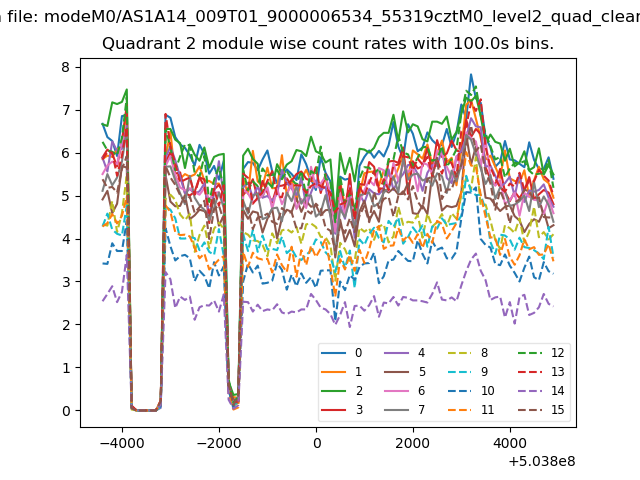
| Module-wise count rates for Quadrant B Data is divided into 100 sec bins |
 |
 |
| Module-wise count rates for Quadrant C Data is divided into 100 sec bins |
 |
 |
| Module-wise count rates for Quadrant D Data is divided into 100 sec bins |
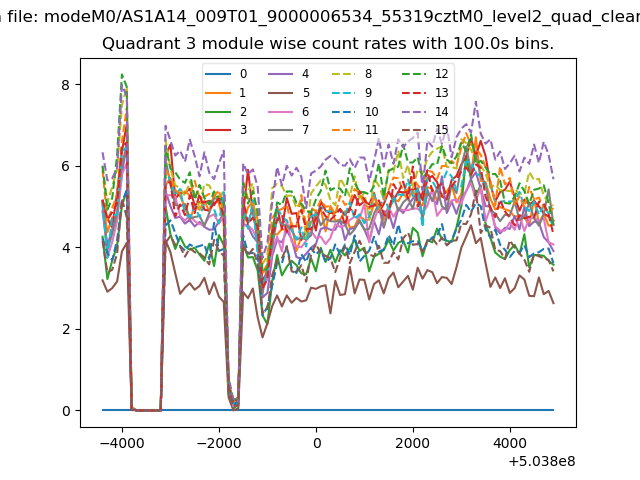 |
 |
| Parameter | Plot |
|---|---|
| CZT HV Monitor | 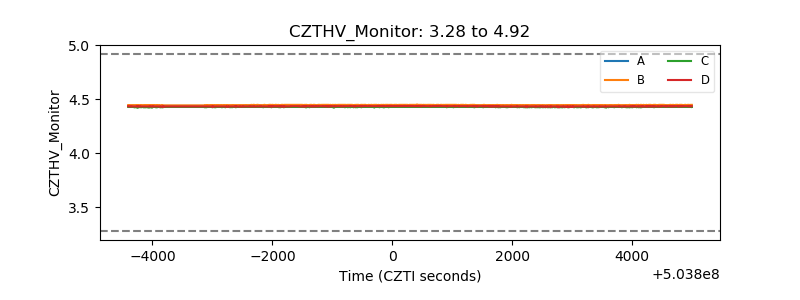 |
| D_VDD | 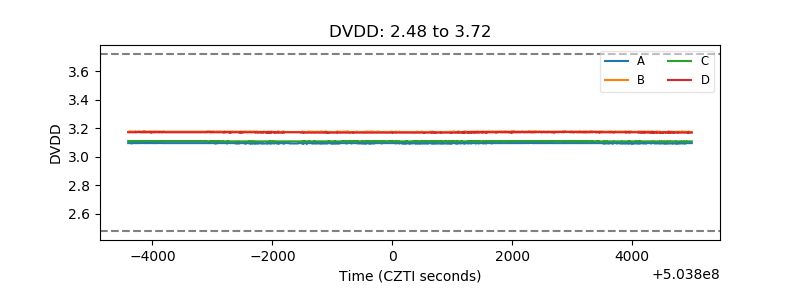 |
| Temperature 1 | 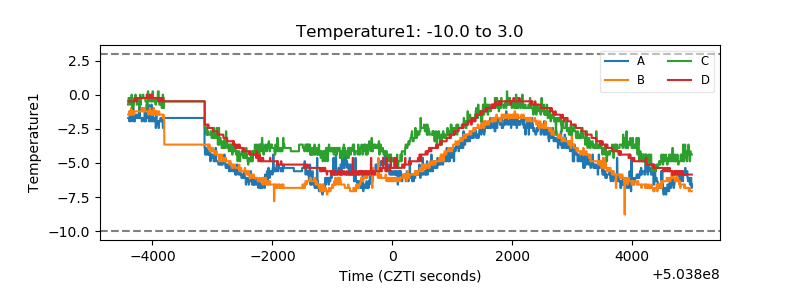 |
| Veto HV Monitor | 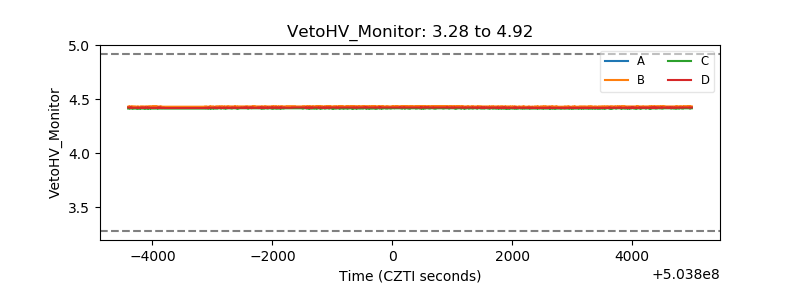 |
| Veto LLD | 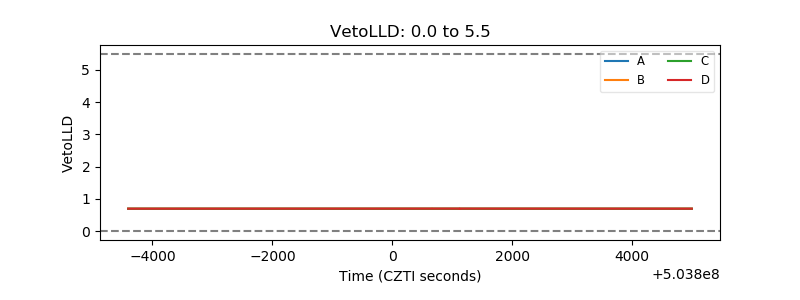 |
| Alpha Counter | 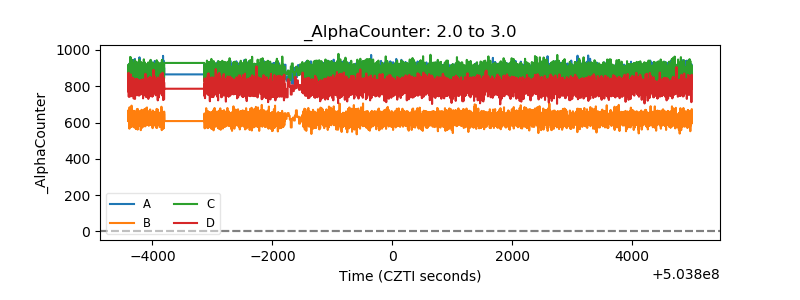 |
| _CPM_Rate | 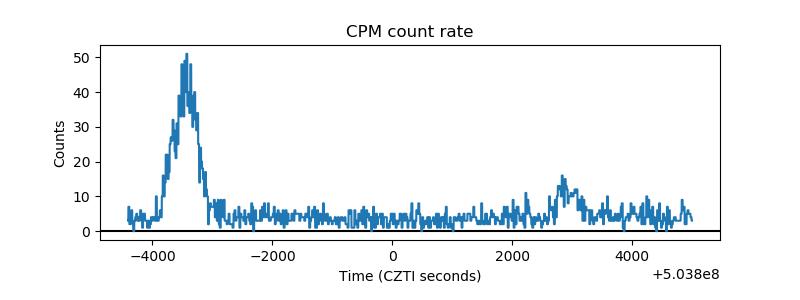 |
| CZT Counter | 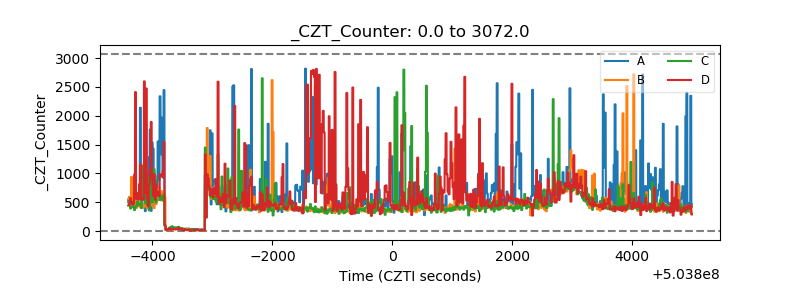 |
| +2.5 Volts monitor |  |
| +5 Volts monitor |  |
| _ROLL_ROT | 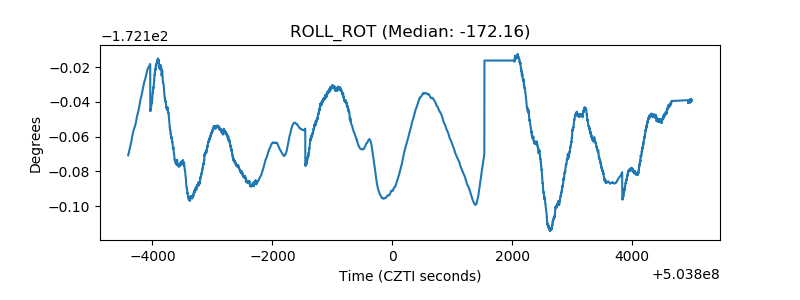 |
| _Roll_DEC | 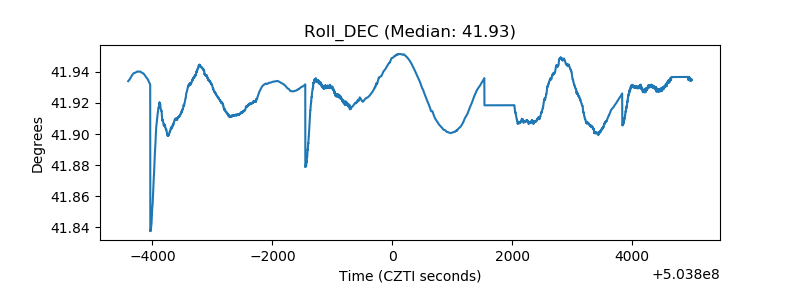 |
| _Roll_RA | 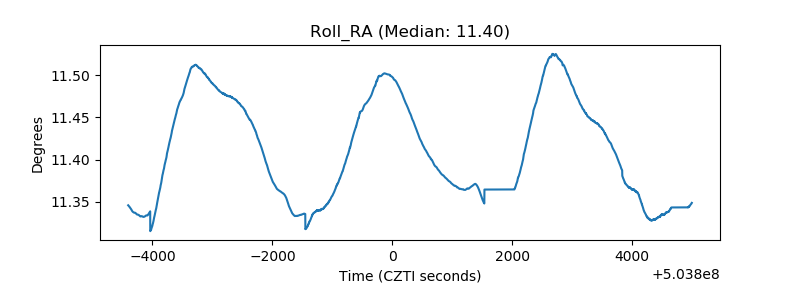 |
| Veto Counter | 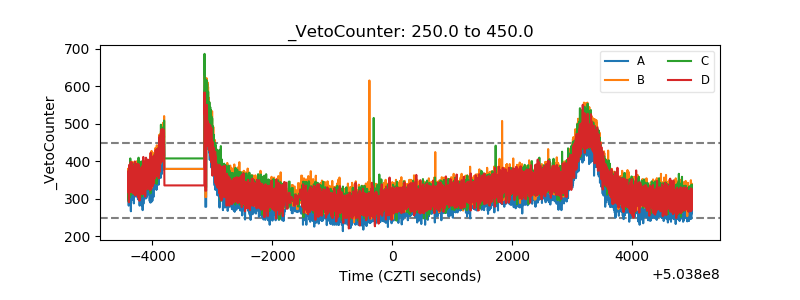 |