| Param | Original file | Final file |
|---|---|---|
| Filename | modeM0/AS1A14_009T01_9000006534_55320cztM0_level2.fits | modeM0/AS1A14_009T01_9000006534_55320cztM0_level2_quad_clean.evt |
| Size (bytes) | 568,817,280 | 112,484,160 |
| Size | 542.5 MB | 107.3 MB |
| Events in quadrant A | 5,885,772 | 703,243 |
| Events in quadrant B | 4,206,174 | 762,924 |
| Events in quadrant C | 5,259,169 | 679,092 |
| Events in quadrant D | 5,000,545 | 631,129 |
| Mode SS | |||
|---|---|---|---|
| Quadrant | BADHDUFLAG | Total packets | Discarded packets |
| A | 0 | 182 | 0 |
| B | 0 | 182 | 0 |
| C | 0 | 182 | 0 |
| D | 0 | 182 | 0 |
| Mode M0 | |||
|---|---|---|---|
| Quadrant | BADHDUFLAG | Total packets | Discarded packets |
| A | 0 | 23992 | 150 |
| B | 0 | 19566 | 53 |
| C | 0 | 22505 | 46 |
| D | 0 | 21620 | 47 |
| Quadrant | Total seconds | Saturated seconds | Saturation percentage |
|---|---|---|---|
| A | 9057 | 275 | 3.036325% |
| B | 9065 | 157 | 1.731936% |
| C | 9068 | 385 | 4.245699% |
| D | 9072 | 106 | 1.168430% |
Noise dominated data is calculated using 1-second bins in cleaned event files. If a bin has >2000 counts, and if more than 50% of those come from <1% of pixels, then it is considered to be noise-dominated and hence unusable.
| Quadrant | # 1 sec bins | Bins with >0 counts | Bins with >2000 counts | High rate bins dominated by noise | Noise dominated (total time) | Noise dominated (detector-on time) | Marked lightcurve |
|---|---|---|---|---|---|---|---|
| A | 9366 | 9350 | 247 | 247 | 2.64% | 2.64% | 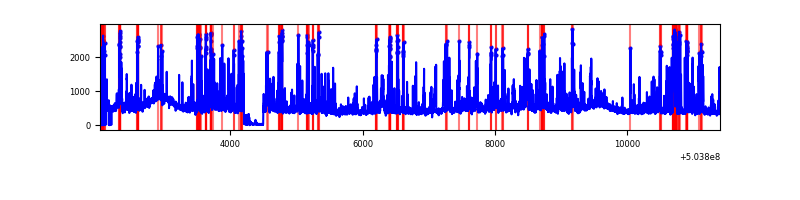 |
| B | 9363 | 9358 | 36 | 36 | 0.38% | 0.38% | 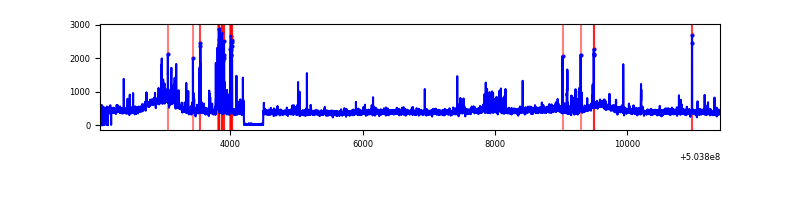 |
| C | 9366 | 9363 | 318 | 318 | 3.40% | 3.40% | 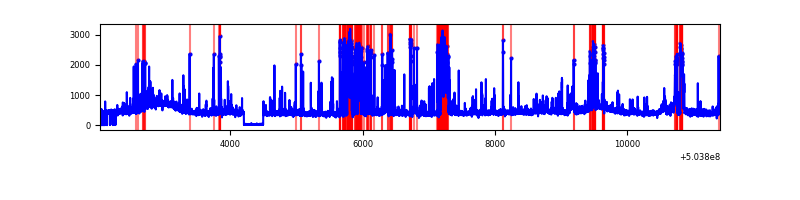 |
| D | 9366 | 9362 | 99 | 99 | 1.06% | 1.06% | 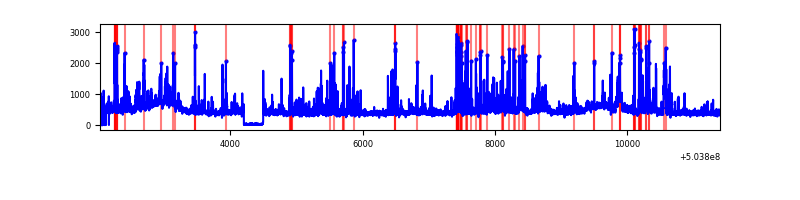 |
Top three noisy pixels from each quadrant. If the there are fewer than three noisy pixels in the level2.evt file, extra rows are filled as -1
| Pixel properties | Quadrant properties | ||||||
|---|---|---|---|---|---|---|---|
| Quadrant | DetID | PixID | Counts | Sigma | Mean | Median | Sigma |
| A | 3 | 78 | 1132980 | 4767.72 | 963 | 939 | 237.4 |
| A | 0 | 8 | 606729 | 2551.35 | 963 | 939 | 237.4 |
| A | 3 | 14 | 150985 | 631.94 | 963 | 939 | 237.4 |
| B | 0 | 199 | 136588 | 653.78 | 964 | 927 | 207.5 |
| B | 2 | 249 | 104867 | 500.91 | 964 | 927 | 207.5 |
| B | 7 | 252 | 85792 | 408.98 | 964 | 927 | 207.5 |
| C | 12 | 249 | 794626 | 3108.77 | 937 | 929 | 255.3 |
| C | 15 | 147 | 416631 | 1628.23 | 937 | 929 | 255.3 |
| C | 13 | 3 | 179864 | 700.86 | 937 | 929 | 255.3 |
| D | 15 | 42 | 264700 | 992.99 | 947 | 906 | 265.7 |
| D | 11 | 129 | 262648 | 985.27 | 947 | 906 | 265.7 |
| D | 6 | 239 | 172343 | 645.34 | 947 | 906 | 265.7 |
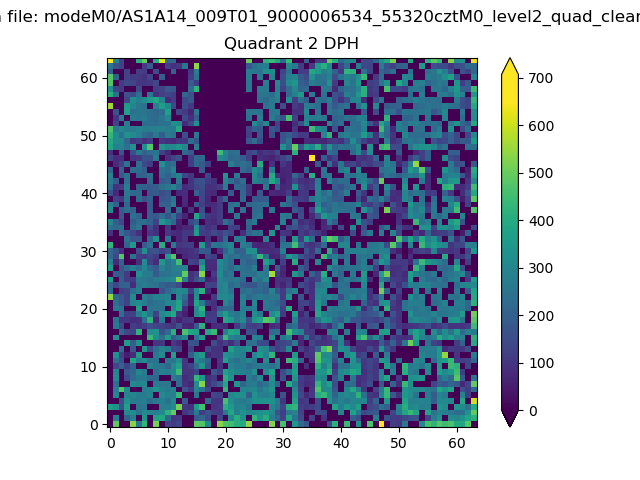
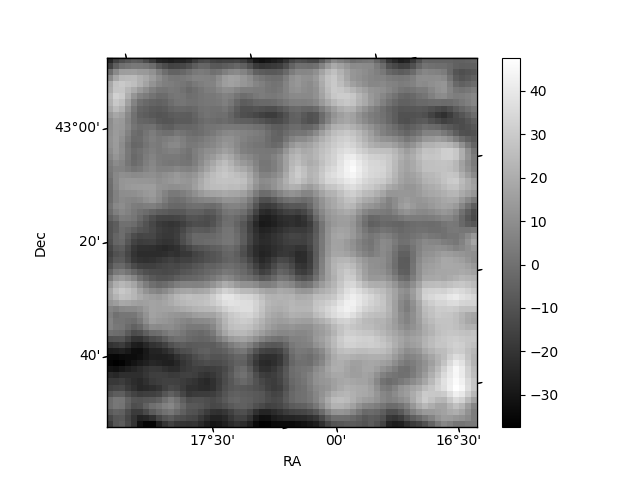
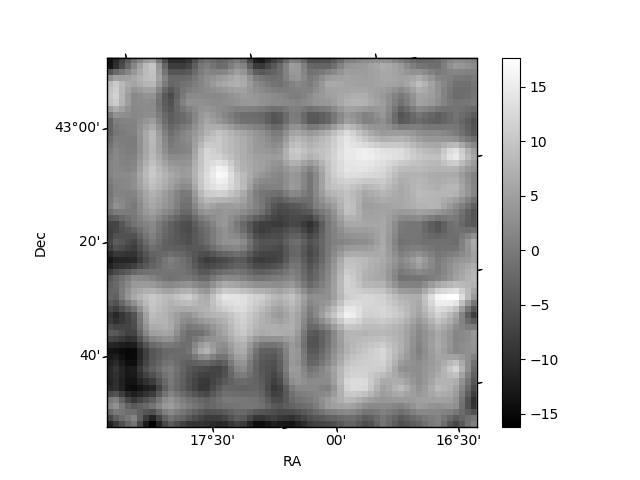
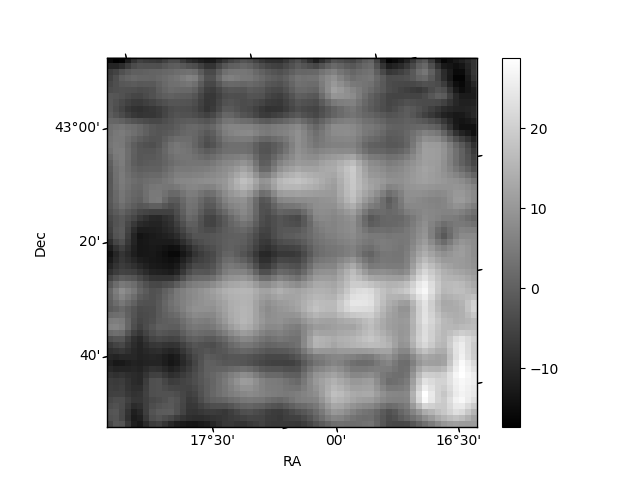
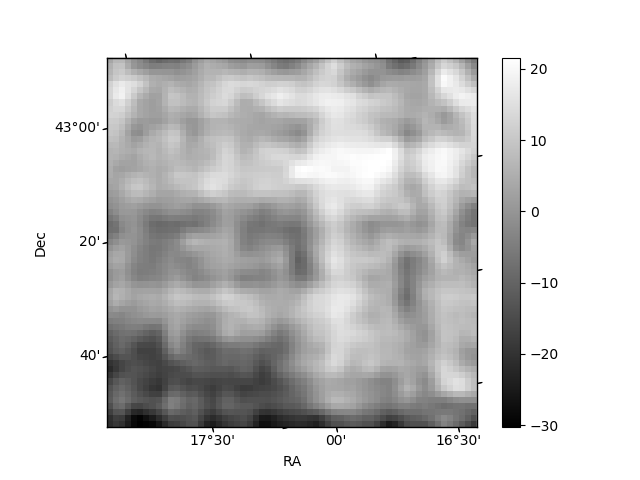
Histogram calculated using DETX and DETY for each event in the final _common_clean file
| Quadrant A | 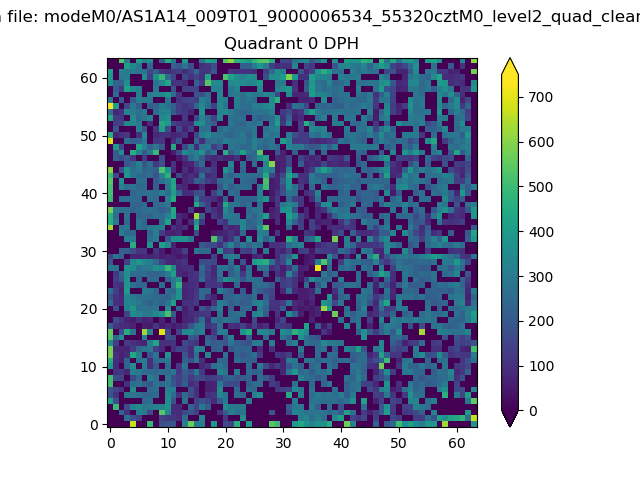 |
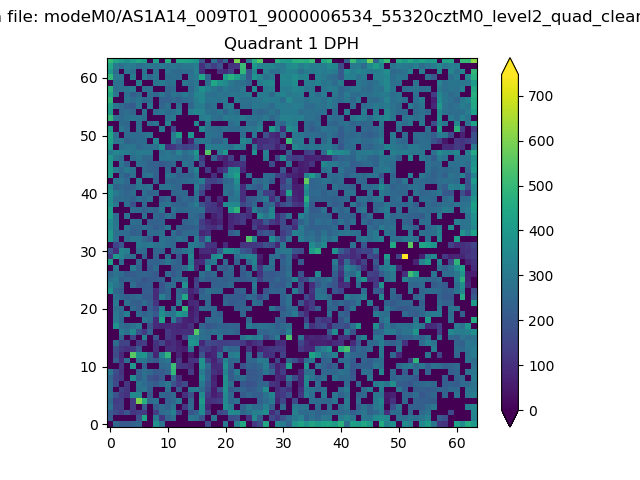 |
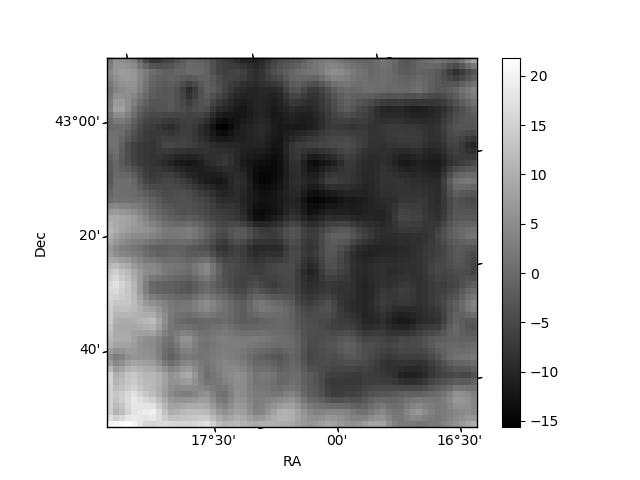
Quadrant B |
|---|---|---|---|
| Quadrant D | 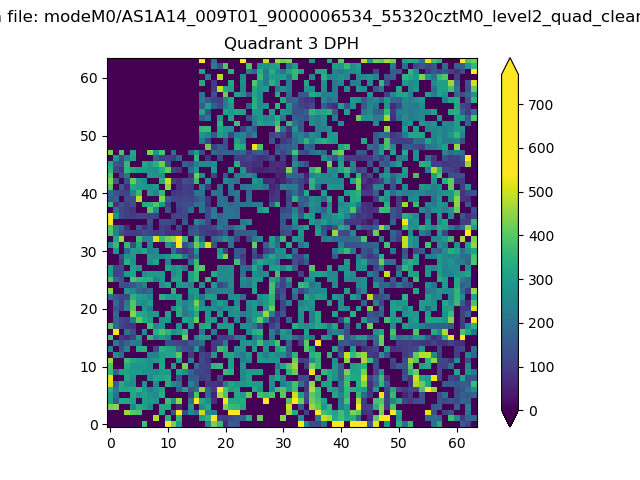 |
 |
Quadrant C |
| Plot type | Count rate plots | Images |
|---|---|---|
| Comparison with Poisson distribution Blue bars denote a histogram of data divided into 1 sec bins. Red curve is a Poisson curve with rate = median count rate of data. |
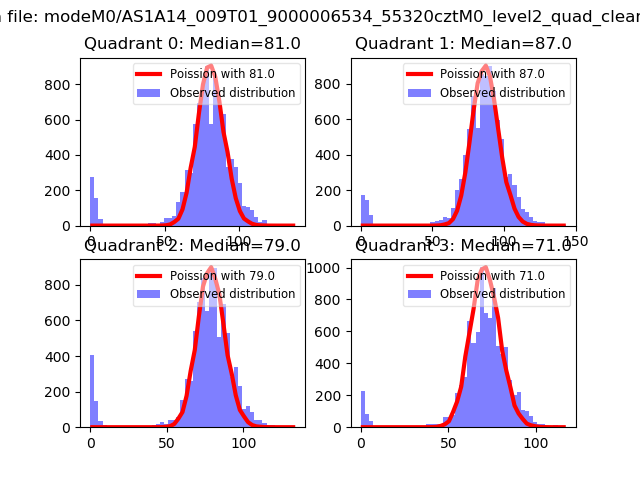 |
 |
| Quadrant-wise count rates Data is divided into 100 sec bins |
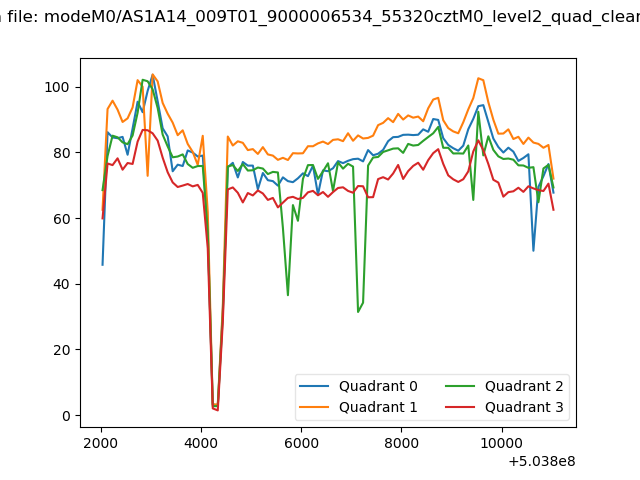 |
|
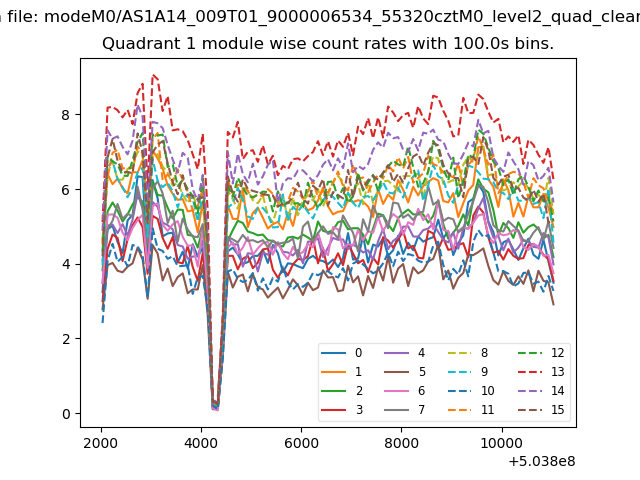
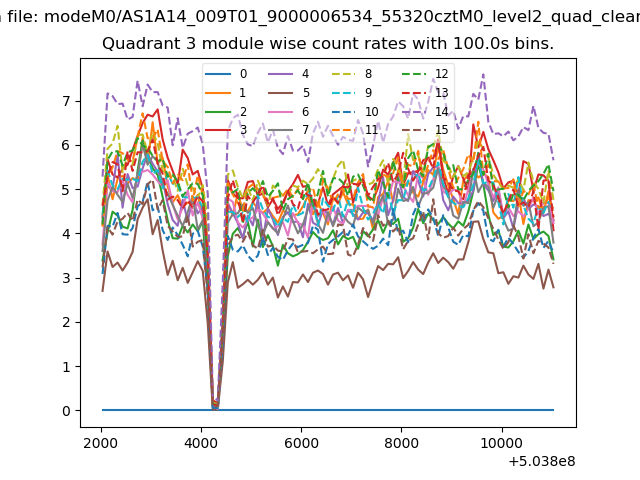
| Module-wise count rates for Quadrant A Data is divided into 100 sec bins |
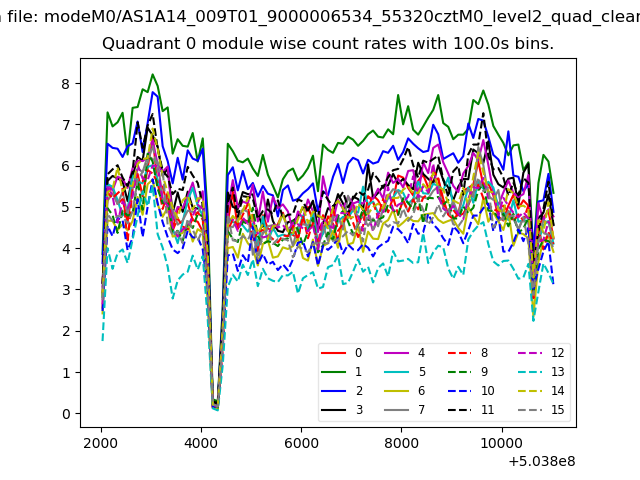 |
 |
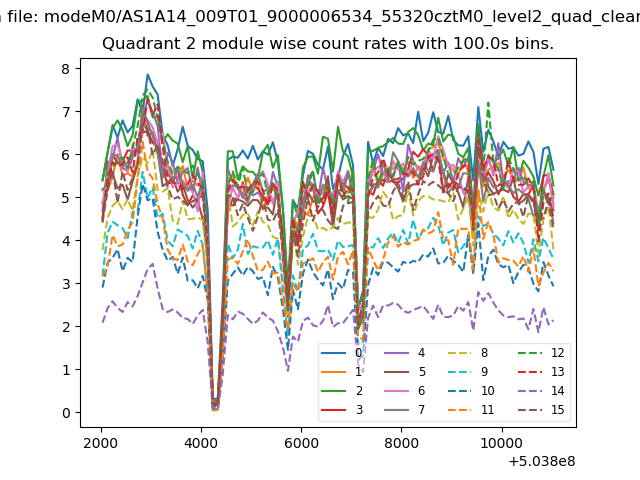
| Module-wise count rates for Quadrant B Data is divided into 100 sec bins |
 |
 |
| Module-wise count rates for Quadrant C Data is divided into 100 sec bins |
 |
 |
| Module-wise count rates for Quadrant D Data is divided into 100 sec bins |
 |
 |
| Parameter | Plot |
|---|---|
| CZT HV Monitor | 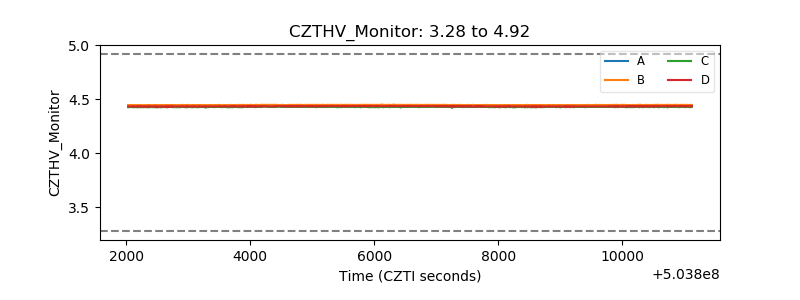 |
| D_VDD | 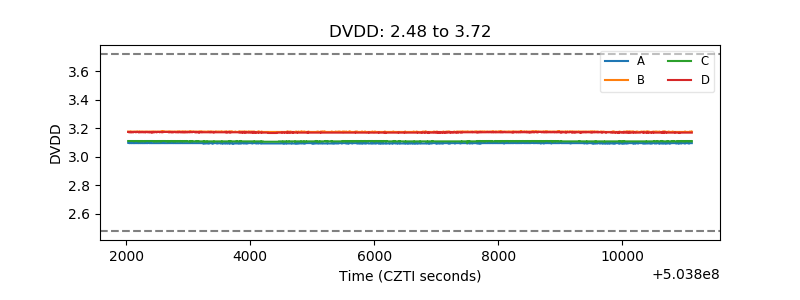 |
| Temperature 1 | 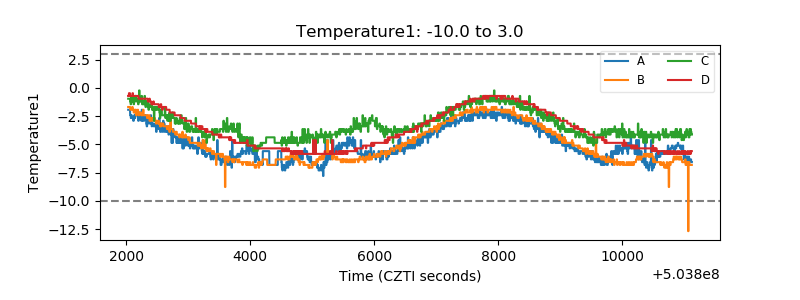 |
| Veto HV Monitor | 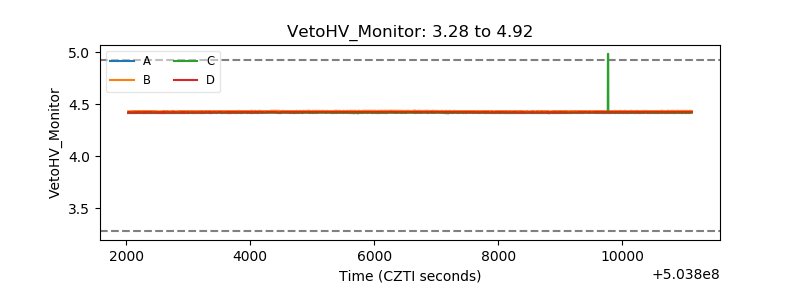 |
| Veto LLD | 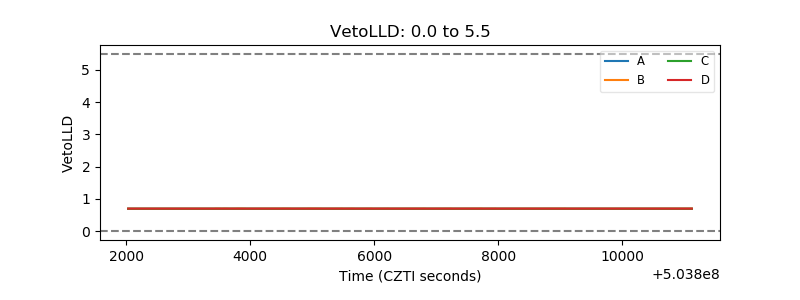 |
| Alpha Counter | 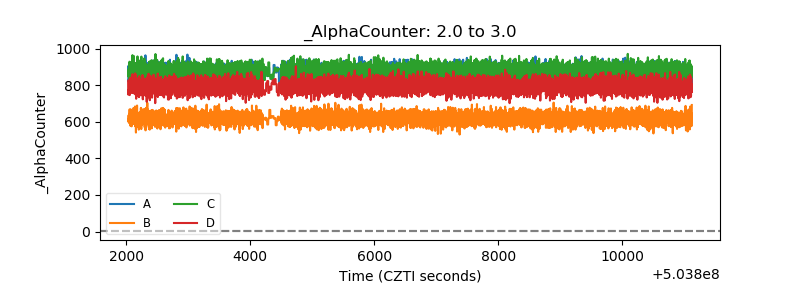 |
| _CPM_Rate | 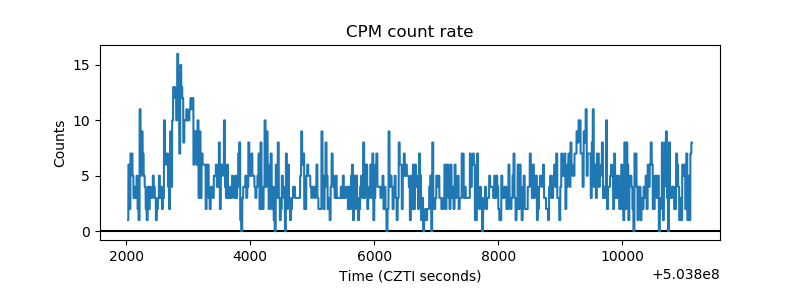 |
| CZT Counter | 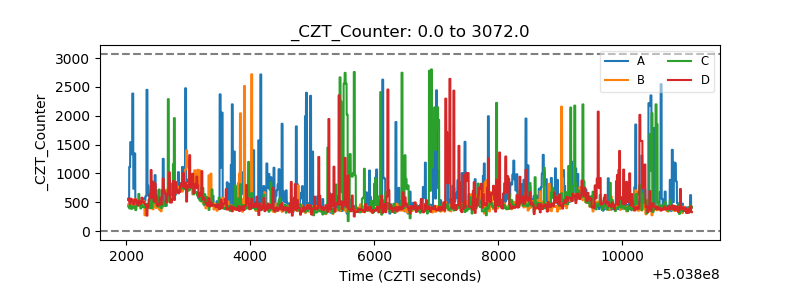 |
| +2.5 Volts monitor |  |
| +5 Volts monitor |  |
| _ROLL_ROT | 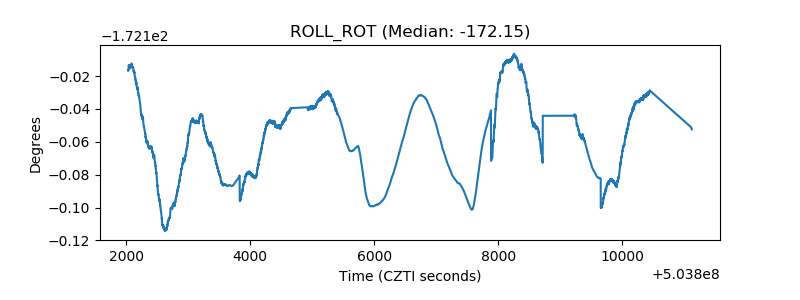 |
| _Roll_DEC | 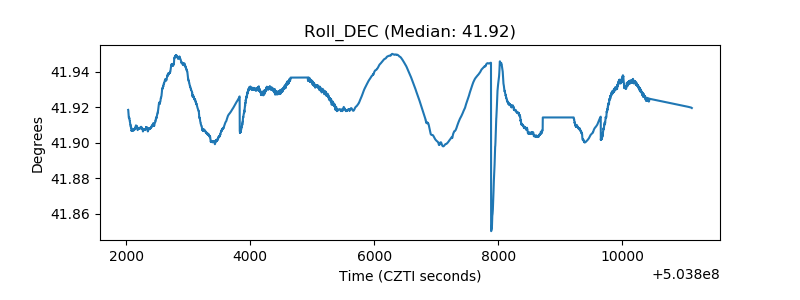 |
| _Roll_RA | 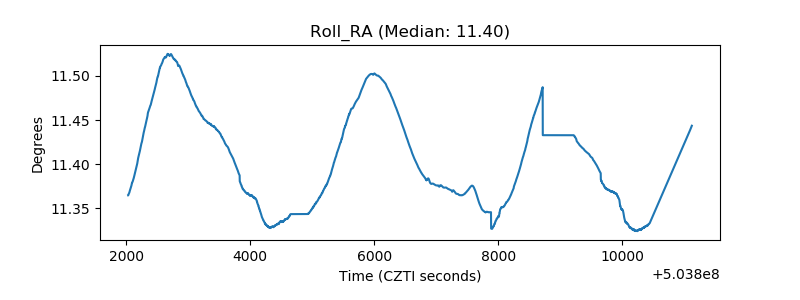 |
| Veto Counter | 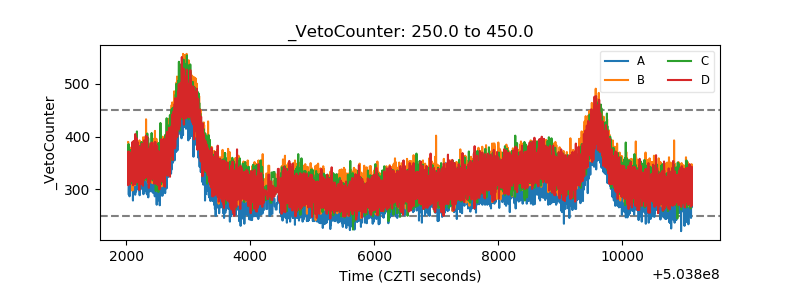 |