| Param | Original file | Final file |
|---|---|---|
| Filename | modeM0/AS1A14_009T01_9000006534_55321cztM0_level2.fits | modeM0/AS1A14_009T01_9000006534_55321cztM0_level2_quad_clean.evt |
| Size (bytes) | 487,808,640 | 105,431,040 |
| Size | 465.2 MB | 100.5 MB |
| Events in quadrant A | 5,148,643 | 653,253 |
| Events in quadrant B | 3,345,151 | 741,526 |
| Events in quadrant C | 3,909,919 | 661,312 |
| Events in quadrant D | 5,072,121 | 615,508 |
| Mode SS | |||
|---|---|---|---|
| Quadrant | BADHDUFLAG | Total packets | Discarded packets |
| A | 0 | 153 | 3 |
| B | 0 | 154 | 4 |
| C | 0 | 153 | 1 |
| D | 0 | 152 | 0 |
| Mode M0 | |||
|---|---|---|---|
| Quadrant | BADHDUFLAG | Total packets | Discarded packets |
| A | 0 | 21240 | 523 |
| B | 0 | 15995 | 302 |
| C | 0 | 17654 | 358 |
| D | 0 | 20749 | 265 |
| Quadrant | Total seconds | Saturated seconds | Saturation percentage |
|---|---|---|---|
| A | 7471 | 492 | 6.585464% |
| B | 7473 | 50 | 0.669075% |
| C | 7476 | 108 | 1.444623% |
| D | 7487 | 250 | 3.339121% |
Noise dominated data is calculated using 1-second bins in cleaned event files. If a bin has >2000 counts, and if more than 50% of those come from <1% of pixels, then it is considered to be noise-dominated and hence unusable.
| Quadrant | # 1 sec bins | Bins with >0 counts | Bins with >2000 counts | High rate bins dominated by noise | Noise dominated (total time) | Noise dominated (detector-on time) | Marked lightcurve |
|---|---|---|---|---|---|---|---|
| A | 8295 | 7512 | 456 | 456 | 5.50% | 6.07% | 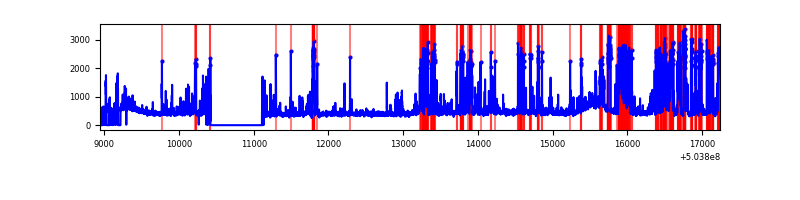 |
| B | 8297 | 7516 | 14 | 14 | 0.17% | 0.19% | 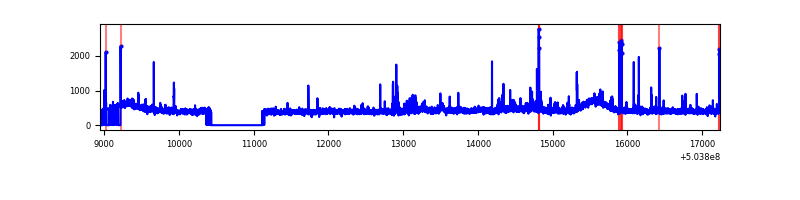 |
| C | 8285 | 7523 | 110 | 110 | 1.33% | 1.46% | 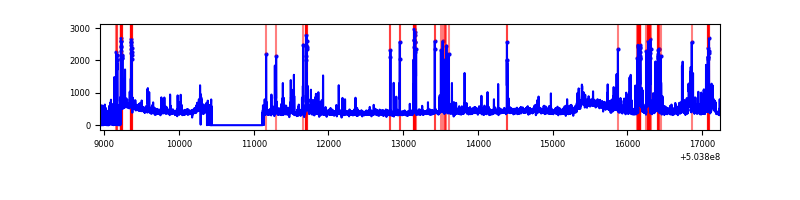 |
| D | 8282 | 7530 | 260 | 260 | 3.14% | 3.45% | 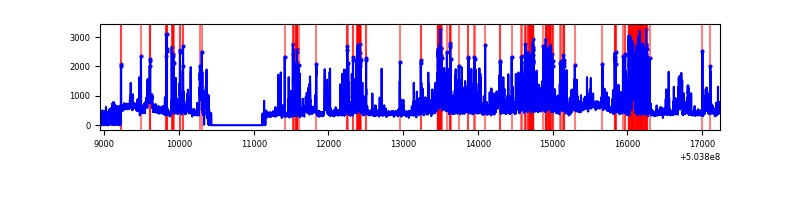 |
Top three noisy pixels from each quadrant. If the there are fewer than three noisy pixels in the level2.evt file, extra rows are filled as -1
| Pixel properties | Quadrant properties | ||||||
|---|---|---|---|---|---|---|---|
| Quadrant | DetID | PixID | Counts | Sigma | Mean | Median | Sigma |
| A | 3 | 78 | 997902 | 5247.18 | 775 | 754 | 190.0 |
| A | 0 | 8 | 920817 | 4841.55 | 775 | 754 | 190.0 |
| A | 4 | 44 | 71872 | 374.24 | 775 | 754 | 190.0 |
| B | 0 | 199 | 93616 | 542.61 | 791 | 760 | 171.1 |
| B | 7 | 252 | 36621 | 209.56 | 791 | 760 | 171.1 |
| B | 2 | 249 | 25737 | 145.96 | 791 | 760 | 171.1 |
| C | 15 | 147 | 454392 | 2140.22 | 781 | 775 | 211.9 |
| C | 15 | 131 | 127458 | 597.7 | 781 | 775 | 211.9 |
| C | 12 | 252 | 87887 | 411.0 | 781 | 775 | 211.9 |
| D | 6 | 239 | 722889 | 3312.3 | 770 | 737 | 218.0 |
| D | 3 | 12 | 420366 | 1924.72 | 770 | 737 | 218.0 |
| D | 15 | 42 | 369834 | 1692.94 | 770 | 737 | 218.0 |
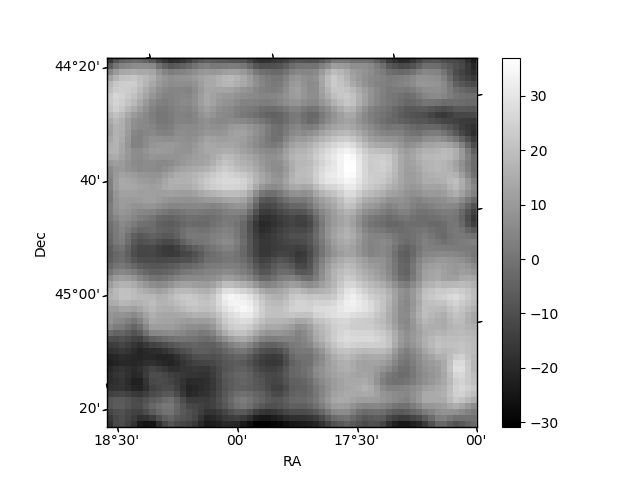
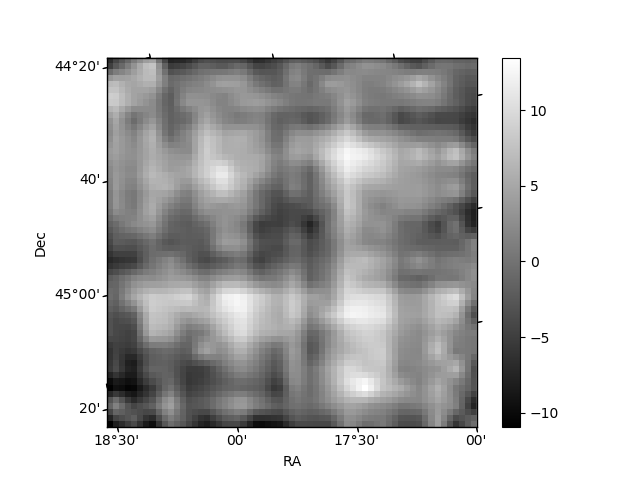
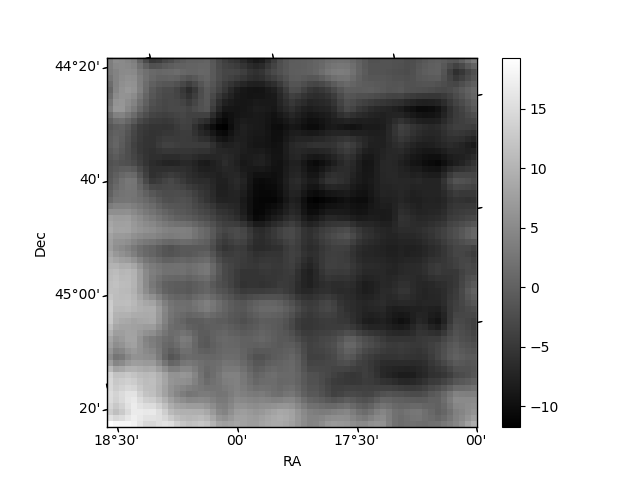
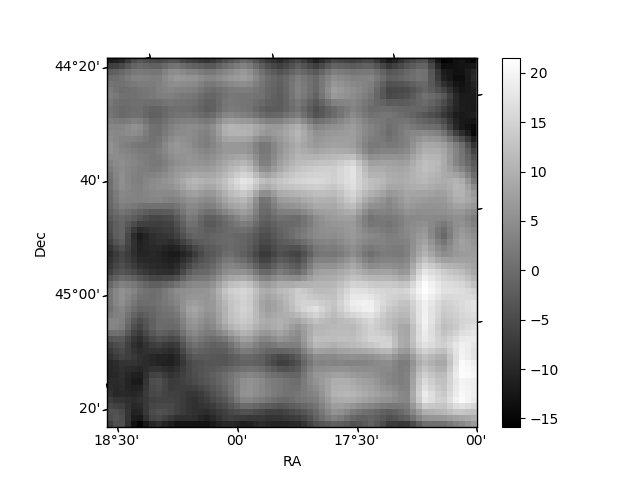
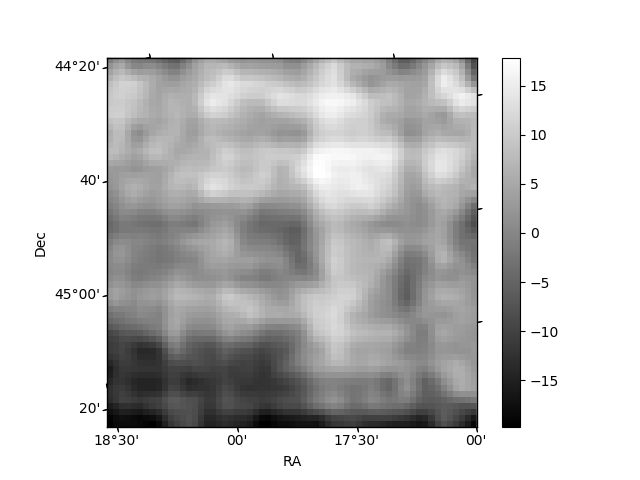
Histogram calculated using DETX and DETY for each event in the final _common_clean file
| Quadrant A | 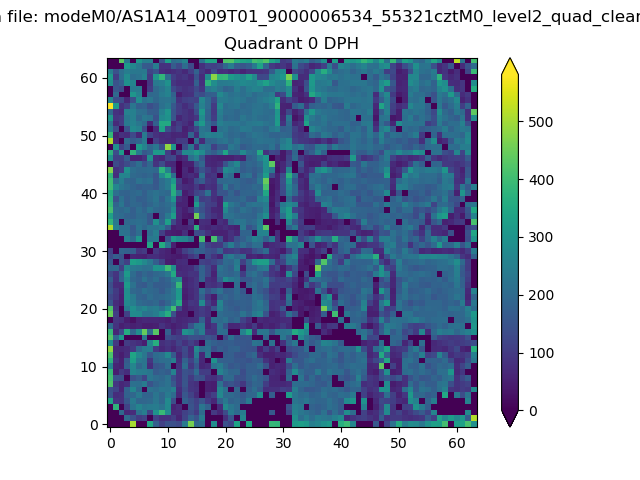 |
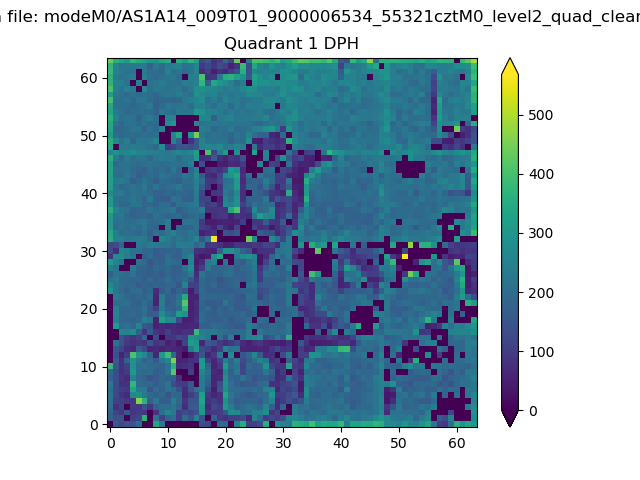 |
Quadrant B |
|---|---|---|---|
| Quadrant D | 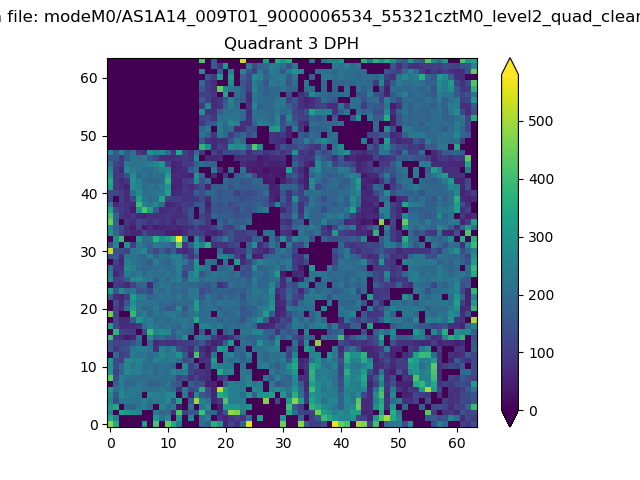 |
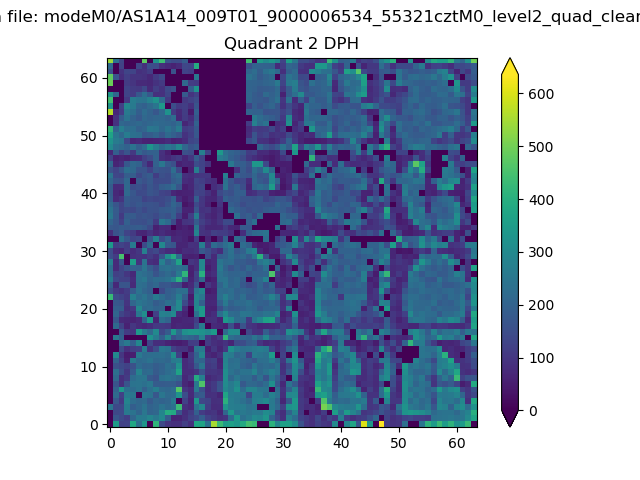 |
Quadrant C |
| Plot type | Count rate plots | Images |
|---|---|---|
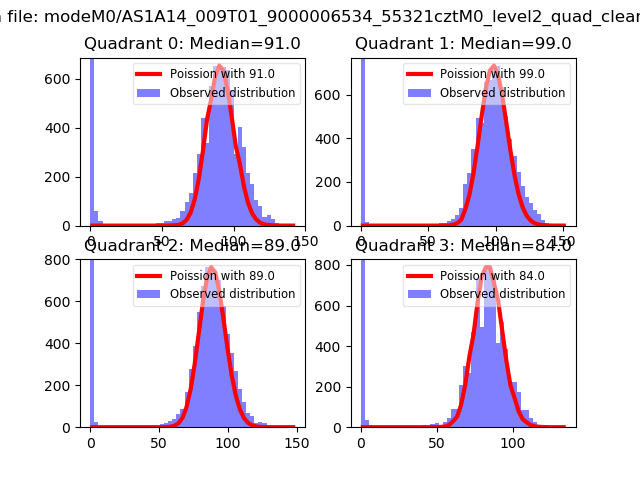
| Comparison with Poisson distribution Blue bars denote a histogram of data divided into 1 sec bins. Red curve is a Poisson curve with rate = median count rate of data. |
 |
 |
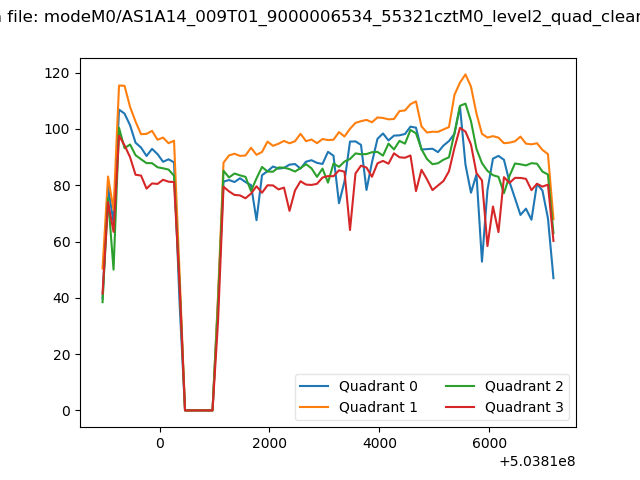
| Quadrant-wise count rates Data is divided into 100 sec bins |
 |
|
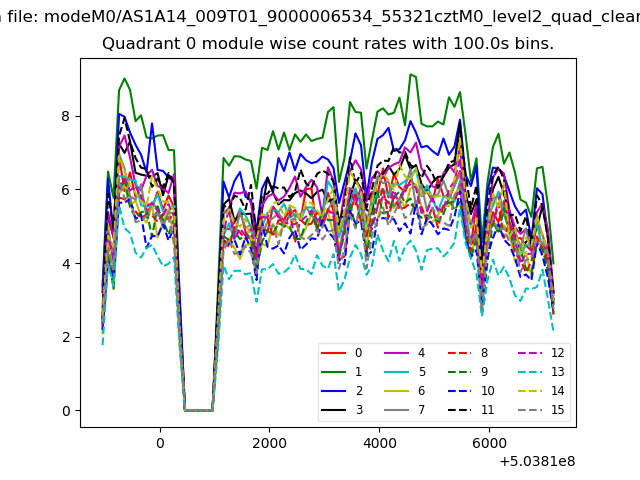
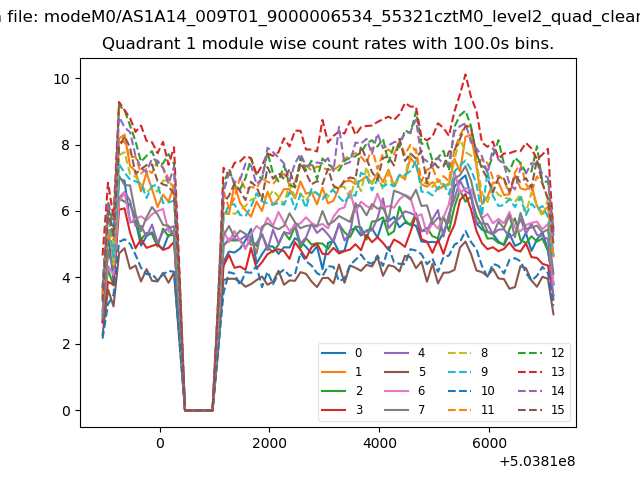
| Module-wise count rates for Quadrant A Data is divided into 100 sec bins |
 |
 |
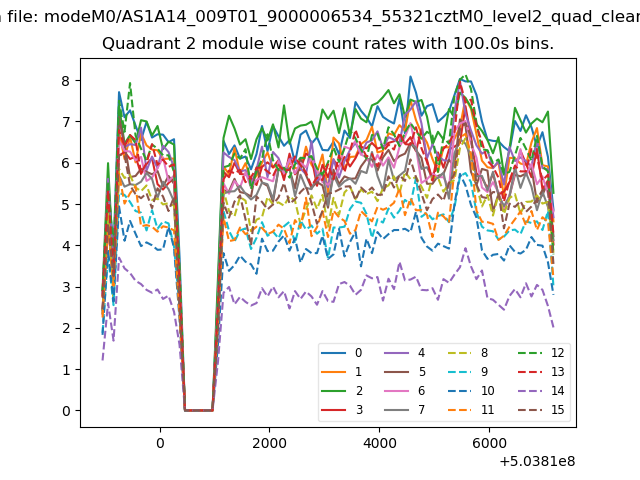
| Module-wise count rates for Quadrant B Data is divided into 100 sec bins |
 |
 |
| Module-wise count rates for Quadrant C Data is divided into 100 sec bins |
 |
 |
| Module-wise count rates for Quadrant D Data is divided into 100 sec bins |
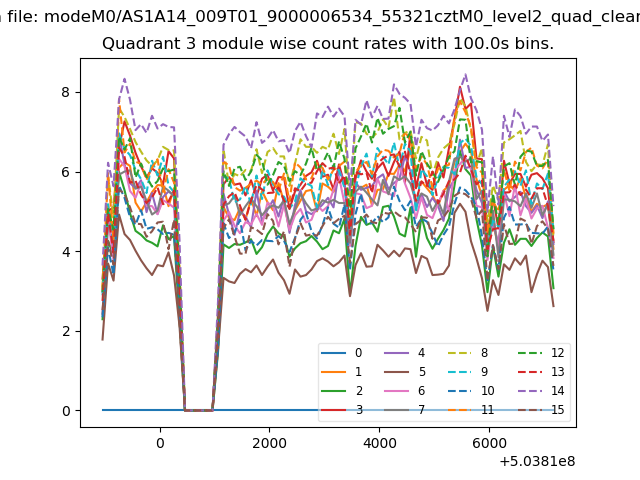 |
 |
| Parameter | Plot |
|---|---|
| CZT HV Monitor | 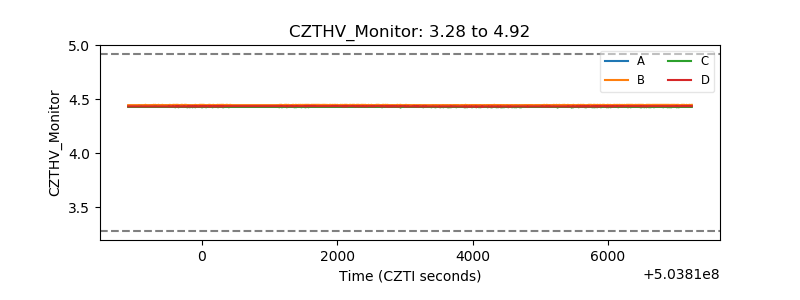 |
| D_VDD | 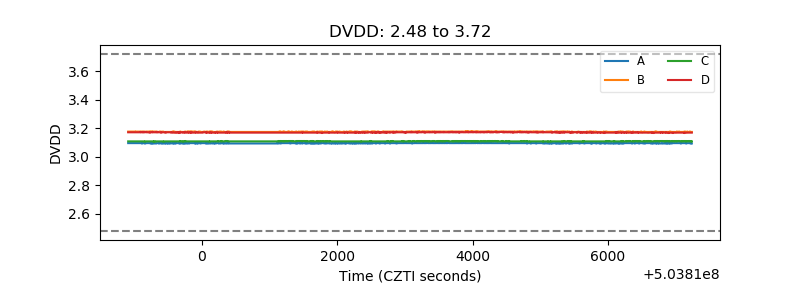 |
| Temperature 1 | 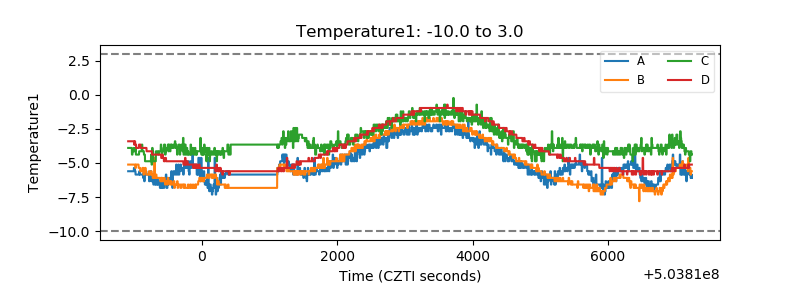 |
| Veto HV Monitor | 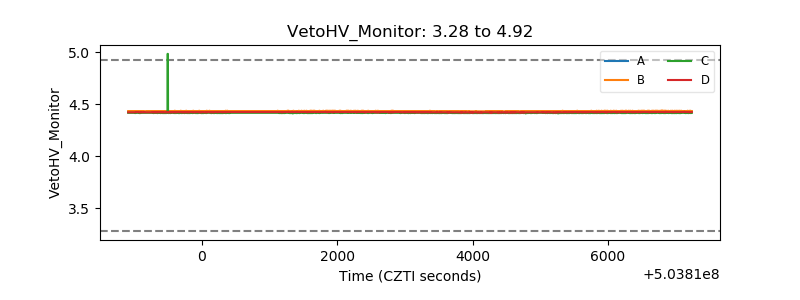 |
| Veto LLD | 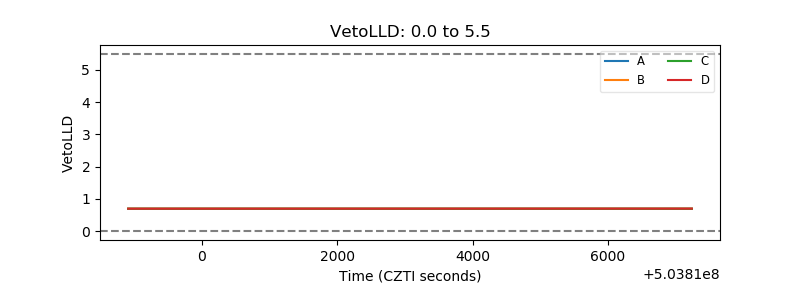 |
| Alpha Counter | 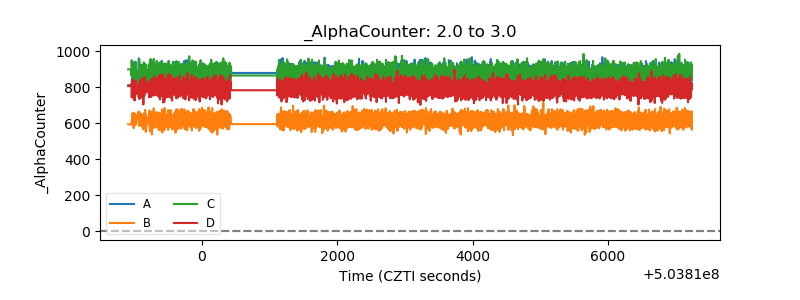 |
| _CPM_Rate | 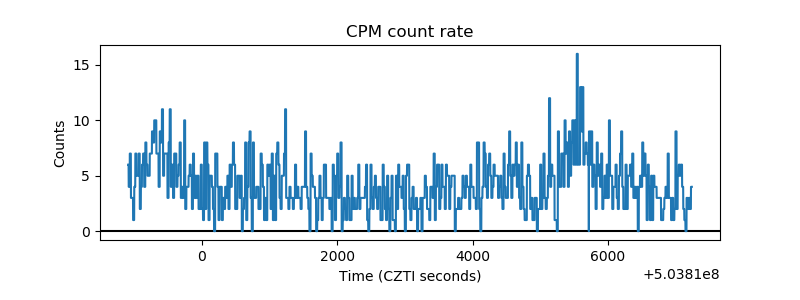 |
| CZT Counter | 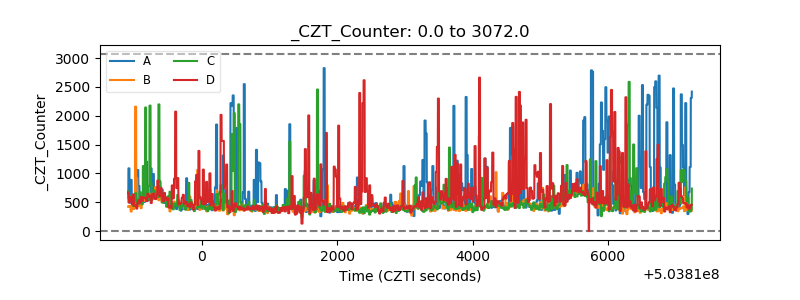 |
| +2.5 Volts monitor |  |
| +5 Volts monitor |  |
| _ROLL_ROT | 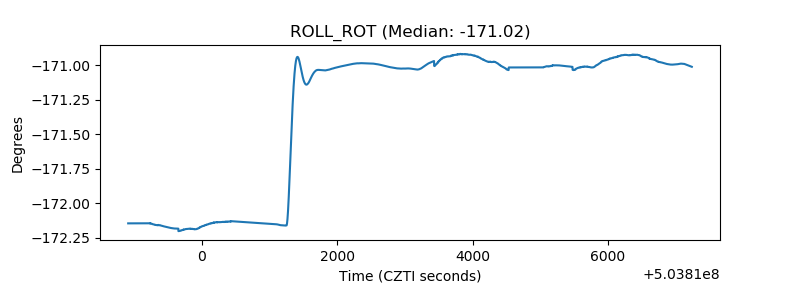 |
| _Roll_DEC | 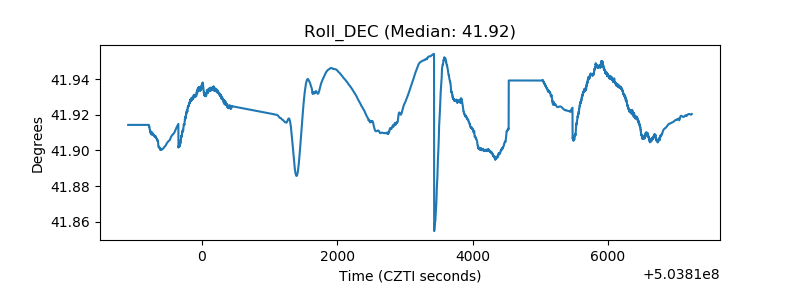 |
| _Roll_RA | 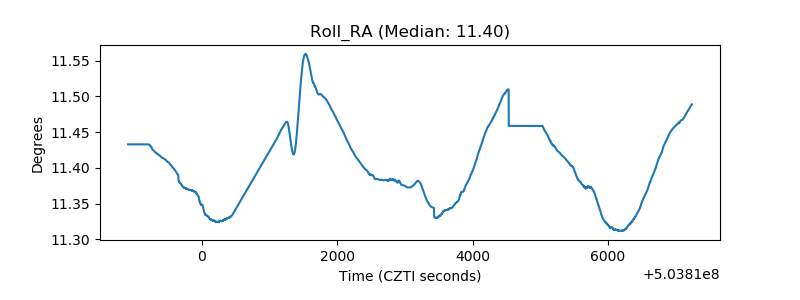 |
| Veto Counter | 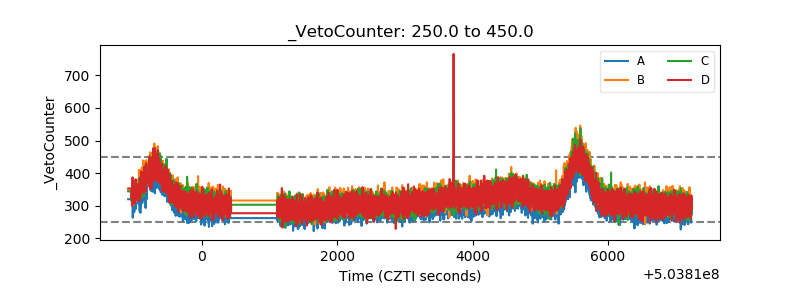 |