| Param | Original file | Final file |
|---|---|---|
| Filename | modeM0/AS1A14_009T01_9000006534_55328cztM0_level2.fits | modeM0/AS1A14_009T01_9000006534_55328cztM0_level2_quad_clean.evt |
| Size (bytes) | 439,882,560 | 100,373,760 |
| Size | 419.5 MB | 95.7 MB |
| Events in quadrant A | 4,636,490 | 640,123 |
| Events in quadrant B | 3,398,988 | 701,929 |
| Events in quadrant C | 3,393,852 | 630,469 |
| Events in quadrant D | 4,327,121 | 594,844 |
| Mode SS | |||
|---|---|---|---|
| Quadrant | BADHDUFLAG | Total packets | Discarded packets |
| A | 0 | 138 | 0 |
| B | 0 | 138 | 0 |
| C | 0 | 138 | 0 |
| D | 0 | 138 | 0 |
| Mode M0 | |||
|---|---|---|---|
| Quadrant | BADHDUFLAG | Total packets | Discarded packets |
| A | 0 | 18561 | 2 |
| B | 0 | 15129 | 2 |
| C | 0 | 15192 | 2 |
| D | 0 | 17555 | 2 |
| Mode M9 | |||
|---|---|---|---|
| Quadrant | BADHDUFLAG | Total packets | Discarded packets |
| A | 0 | 11 | 0 |
| B | 0 | 11 | 0 |
| C | 0 | 11 | 0 |
| D | 0 | 12 | 0 |
| Quadrant | Total seconds | Saturated seconds | Saturation percentage |
|---|---|---|---|
| A | 6771 | 386 | 5.700783% |
| B | 6771 | 163 | 2.407325% |
| C | 6771 | 87 | 1.284891% |
| D | 6771 | 194 | 2.865160% |
Noise dominated data is calculated using 1-second bins in cleaned event files. If a bin has >2000 counts, and if more than 50% of those come from <1% of pixels, then it is considered to be noise-dominated and hence unusable.
| Quadrant | # 1 sec bins | Bins with >0 counts | Bins with >2000 counts | High rate bins dominated by noise | Noise dominated (total time) | Noise dominated (detector-on time) | Marked lightcurve |
|---|---|---|---|---|---|---|---|
| A | 7866 | 6772 | 298 | 298 | 3.79% | 4.40% | 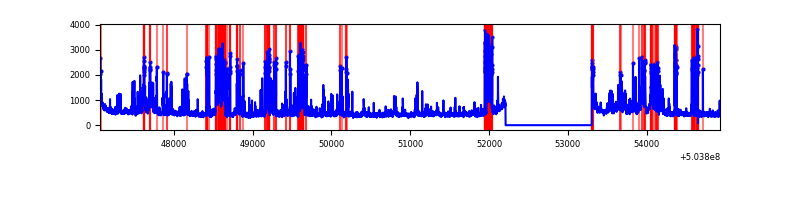 |
| B | 7866 | 6772 | 78 | 78 | 0.99% | 1.15% | 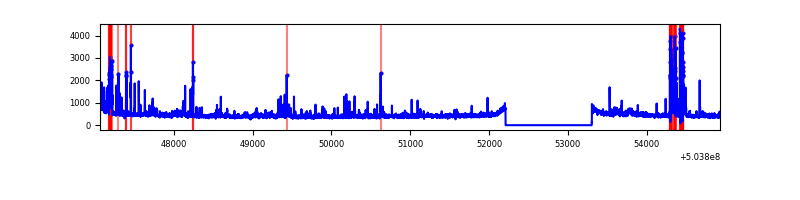 |
| C | 7866 | 6772 | 64 | 64 | 0.81% | 0.95% | 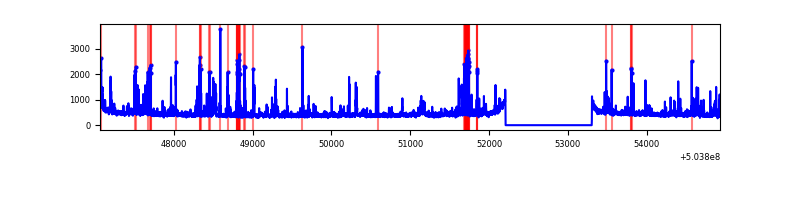 |
| D | 7866 | 6772 | 194 | 194 | 2.47% | 2.86% | 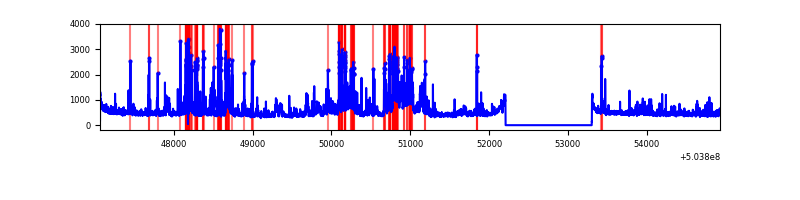 |
Top three noisy pixels from each quadrant. If the there are fewer than three noisy pixels in the level2.evt file, extra rows are filled as -1
| Pixel properties | Quadrant properties | ||||||
|---|---|---|---|---|---|---|---|
| Quadrant | DetID | PixID | Counts | Sigma | Mean | Median | Sigma |
| A | 3 | 78 | 1035784 | 5940.14 | 714 | 699 | 174.3 |
| A | 0 | 8 | 492561 | 2822.69 | 714 | 699 | 174.3 |
| A | 3 | 14 | 123963 | 707.39 | 714 | 699 | 174.3 |
| B | 5 | 185 | 174153 | 1139.21 | 709 | 685 | 152.3 |
| B | 10 | 247 | 152635 | 997.89 | 709 | 685 | 152.3 |
| B | 0 | 199 | 141994 | 928.01 | 709 | 685 | 152.3 |
| C | 7 | 64 | 357905 | 1838.05 | 706 | 698 | 194.3 |
| C | 13 | 3 | 145157 | 743.33 | 706 | 698 | 194.3 |
| C | 14 | 254 | 26450 | 132.51 | 706 | 698 | 194.3 |
| D | 7 | 96 | 517521 | 2581.33 | 708 | 678 | 200.2 |
| D | 11 | 176 | 389238 | 1940.63 | 708 | 678 | 200.2 |
| D | 11 | 129 | 337185 | 1680.66 | 708 | 678 | 200.2 |
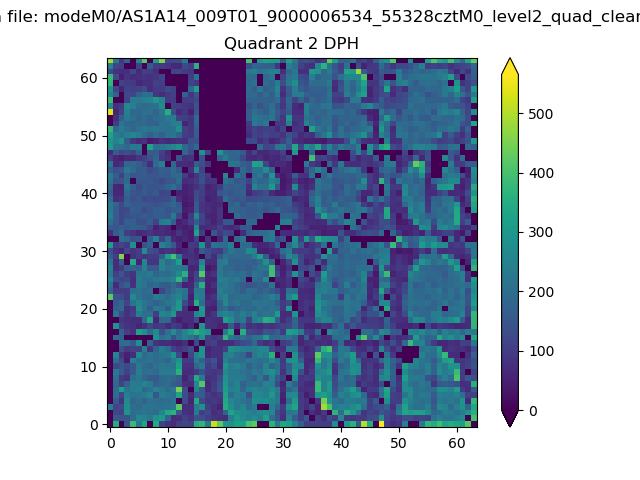
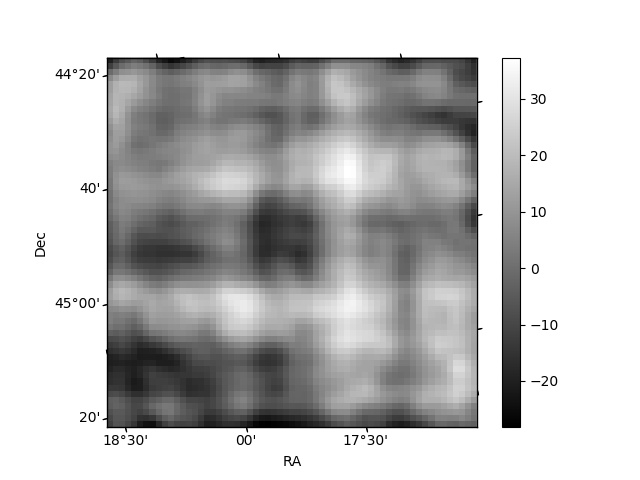
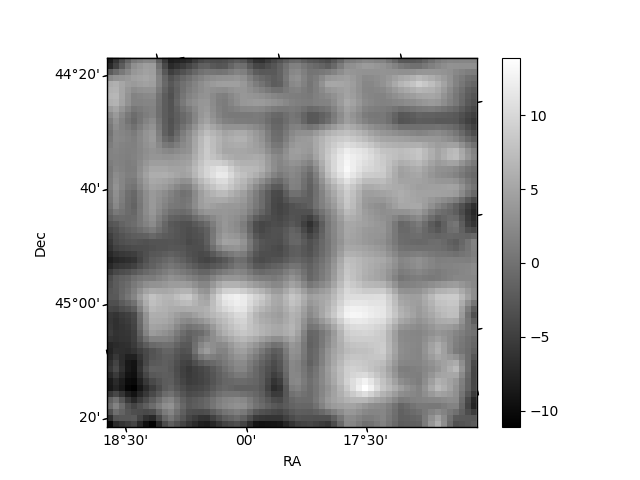
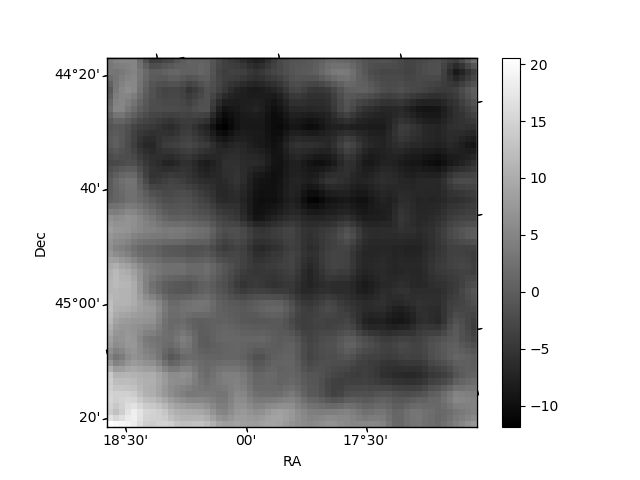
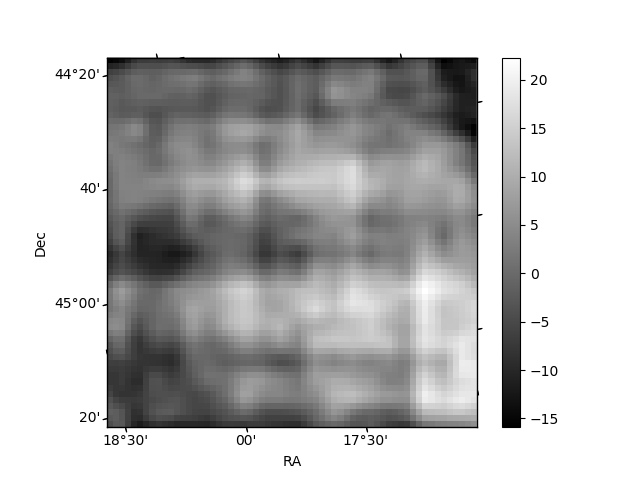
Histogram calculated using DETX and DETY for each event in the final _common_clean file
| Quadrant A | 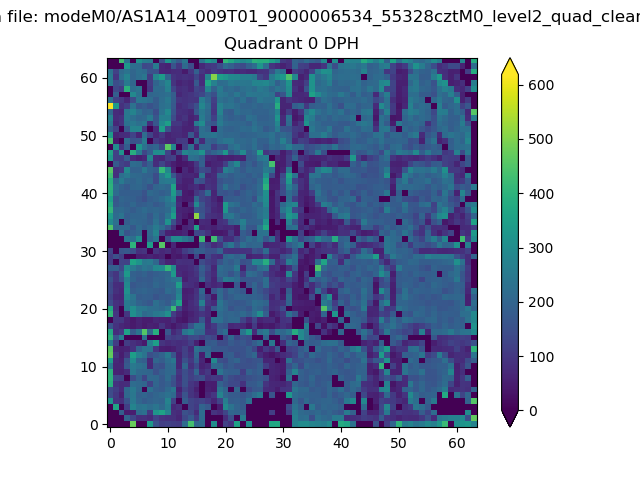 |
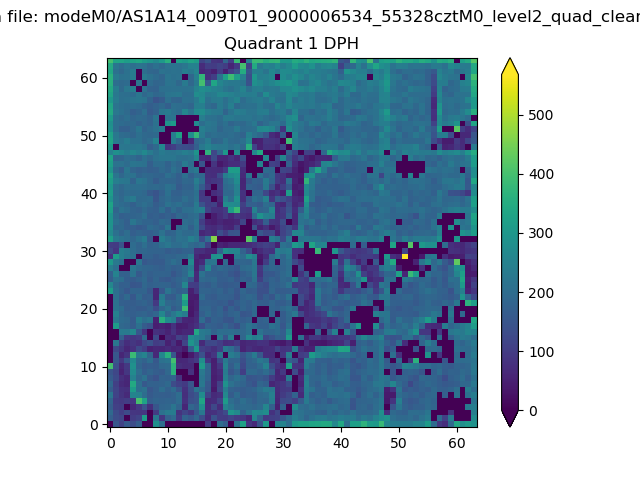 |
Quadrant B |
|---|---|---|---|
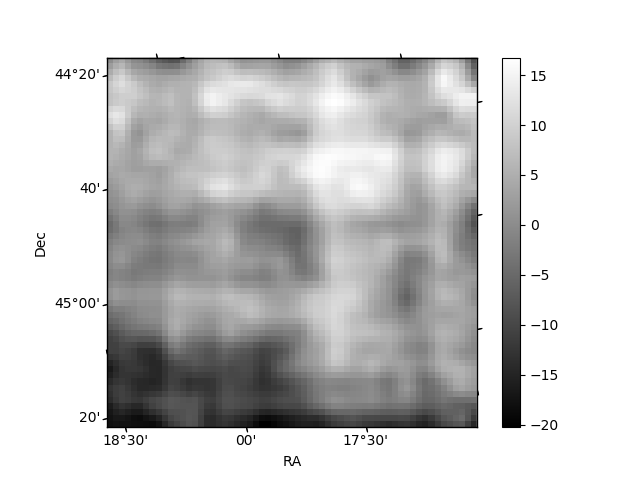
| Quadrant D | 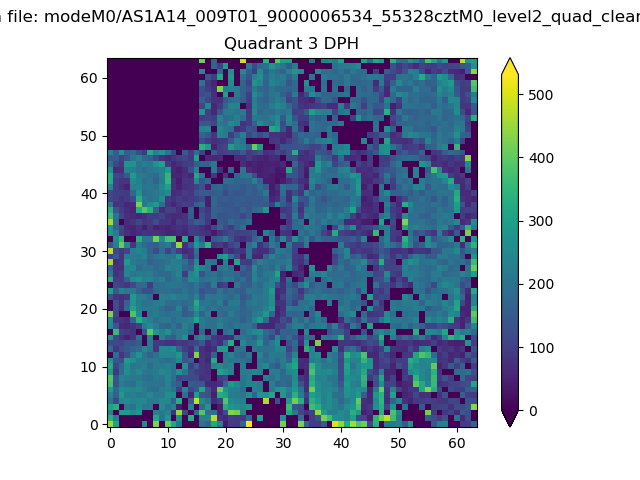 |
 |
Quadrant C |
| Plot type | Count rate plots | Images |
|---|---|---|
| Comparison with Poisson distribution Blue bars denote a histogram of data divided into 1 sec bins. Red curve is a Poisson curve with rate = median count rate of data. |
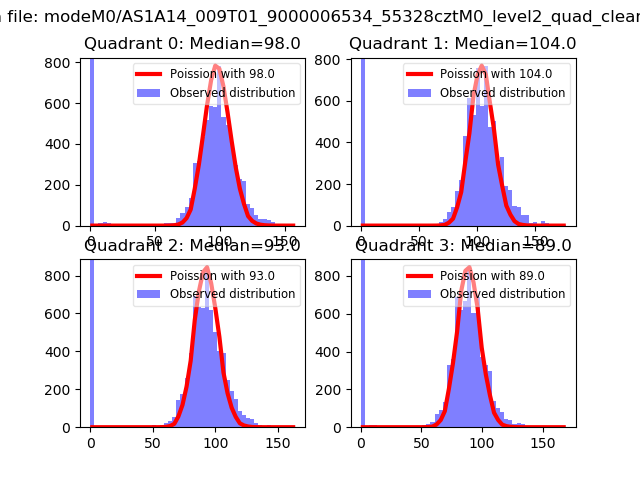 |
 |
| Quadrant-wise count rates Data is divided into 100 sec bins |
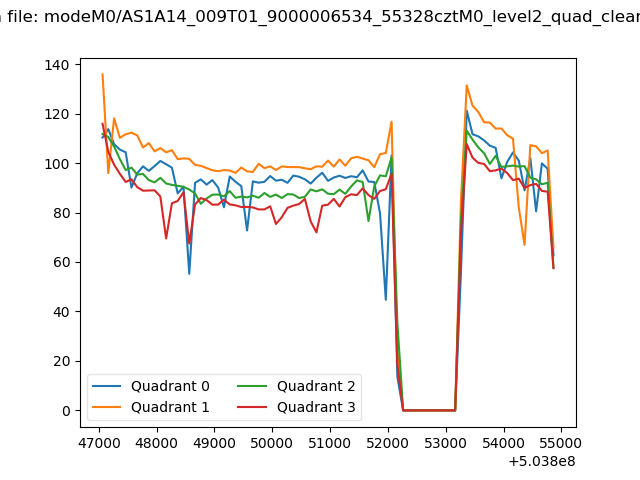 |
|
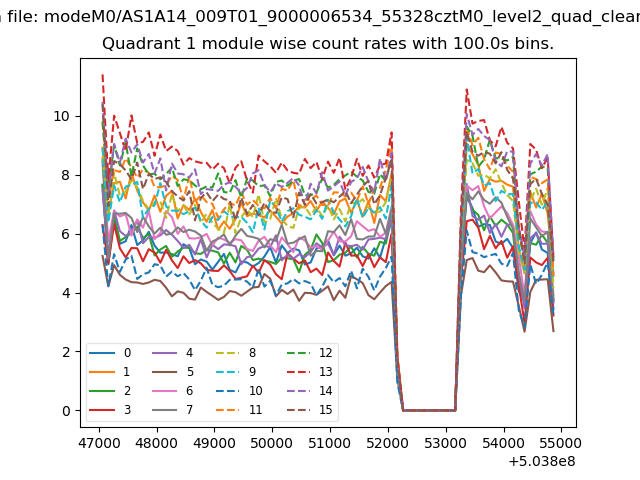
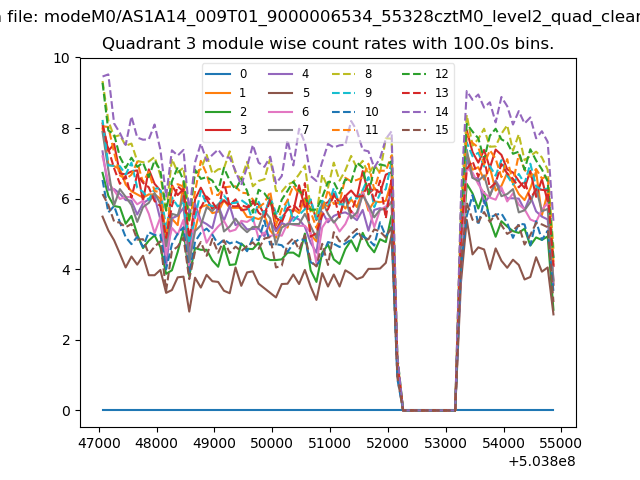
| Module-wise count rates for Quadrant A Data is divided into 100 sec bins |
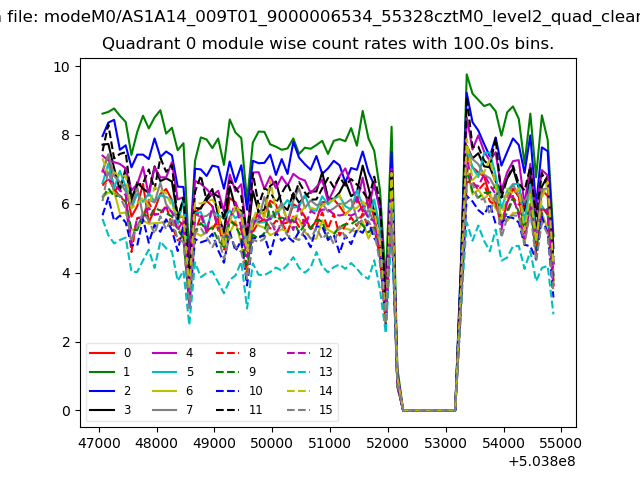 |
 |
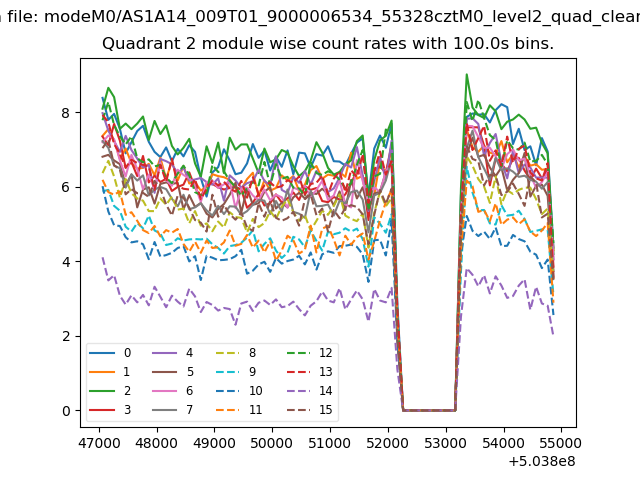
| Module-wise count rates for Quadrant B Data is divided into 100 sec bins |
 |
 |
| Module-wise count rates for Quadrant C Data is divided into 100 sec bins |
 |
 |
| Module-wise count rates for Quadrant D Data is divided into 100 sec bins |
 |
 |
| Parameter | Plot |
|---|---|
| CZT HV Monitor | 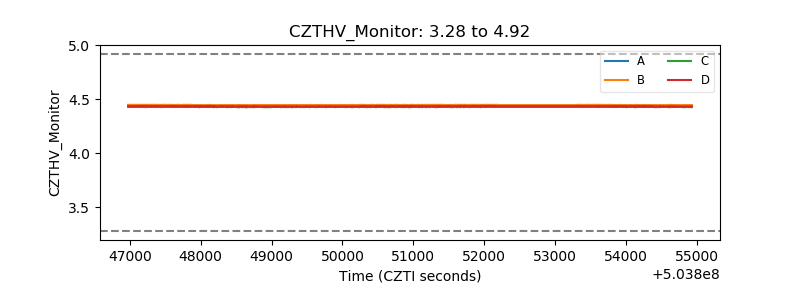 |
| D_VDD | 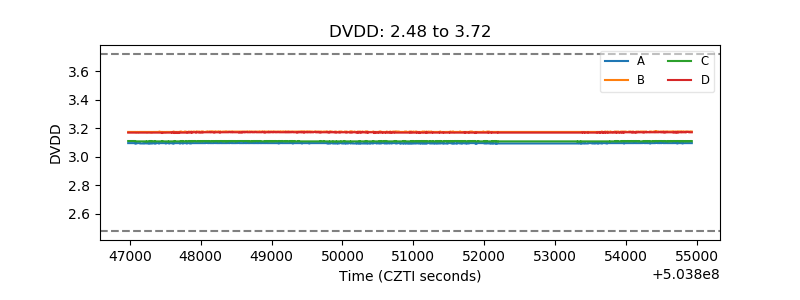 |
| Temperature 1 | 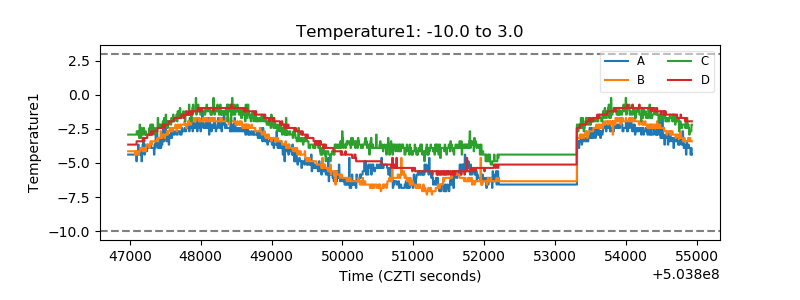 |
| Veto HV Monitor | 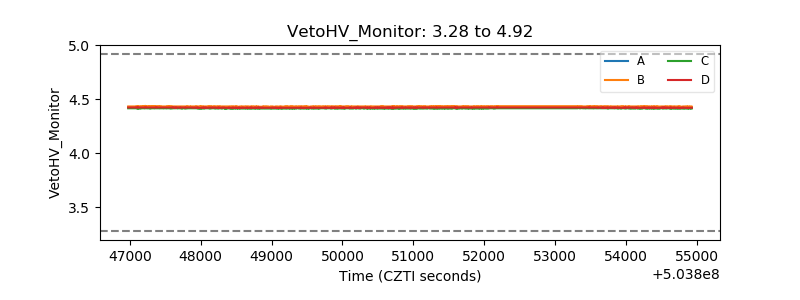 |
| Veto LLD | 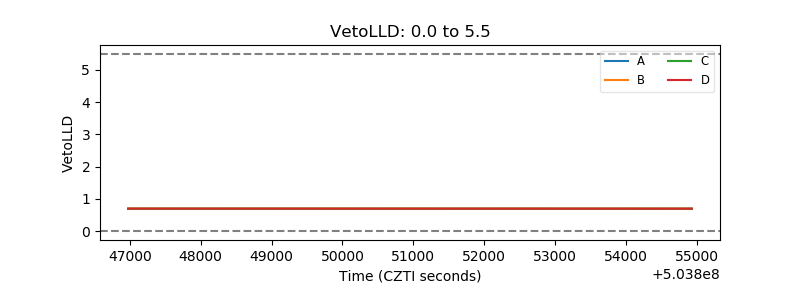 |
| Alpha Counter | 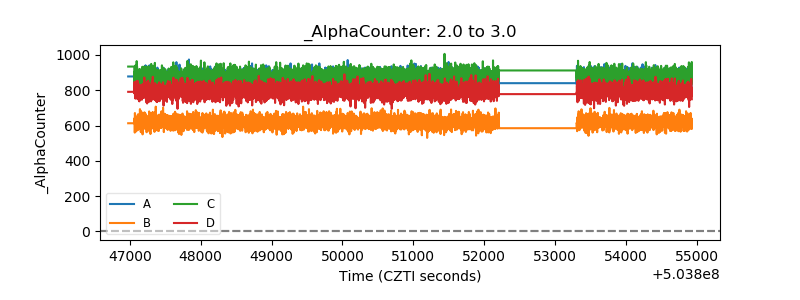 |
| _CPM_Rate | 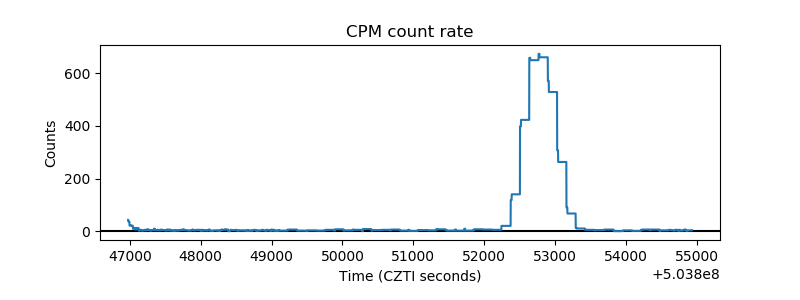 |
| CZT Counter | 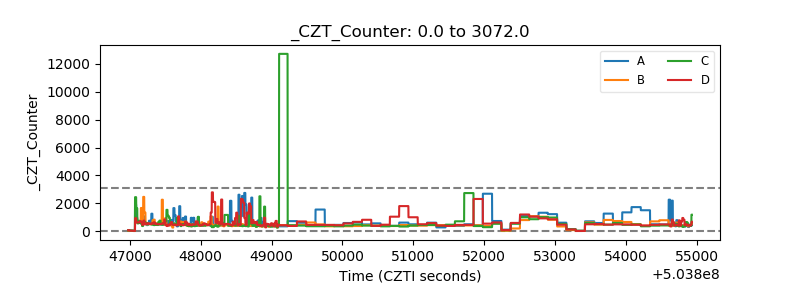 |
| +2.5 Volts monitor |  |
| +5 Volts monitor |  |
| _ROLL_ROT | 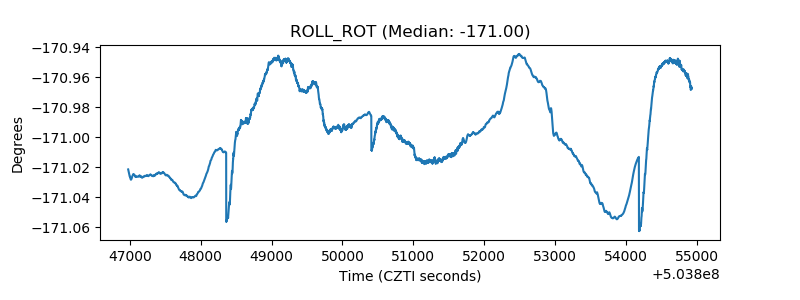 |
| _Roll_DEC | 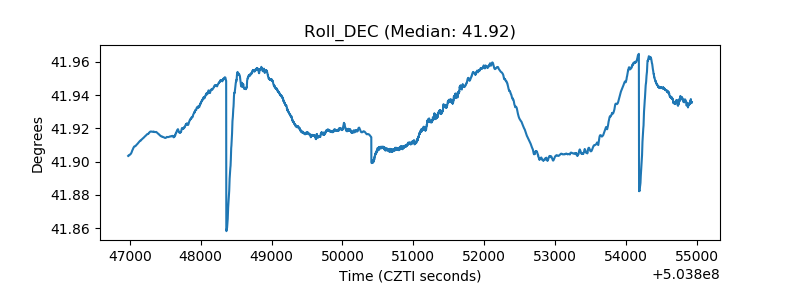 |
| _Roll_RA | 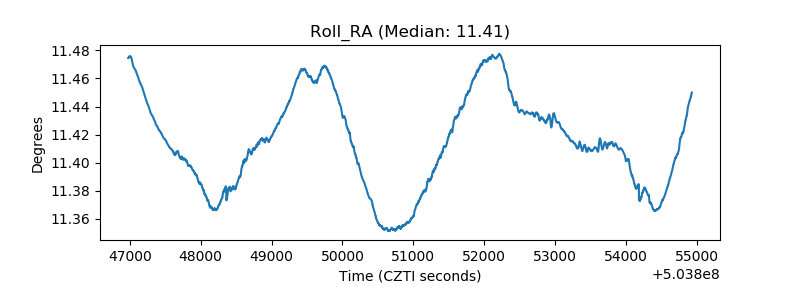 |
| Veto Counter | 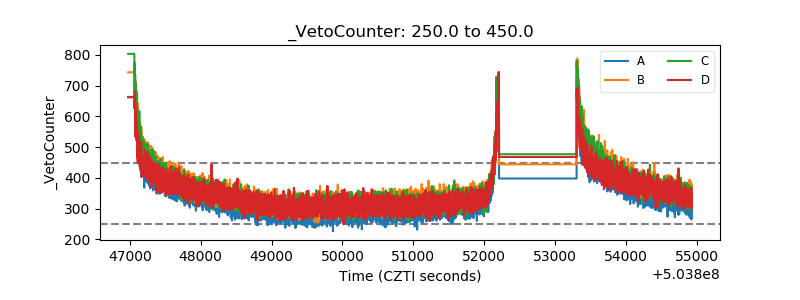 |