| Param | Original file | Final file |
|---|---|---|
| Filename | modeM0/AS1A14_009T01_9000006534_55330cztM0_level2.fits | modeM0/AS1A14_009T01_9000006534_55330cztM0_level2_quad_clean.evt |
| Size (bytes) | 466,536,960 | 96,693,120 |
| Size | 444.9 MB | 92.2 MB |
| Events in quadrant A | 4,794,331 | 617,744 |
| Events in quadrant B | 3,106,448 | 689,811 |
| Events in quadrant C | 4,324,544 | 599,044 |
| Events in quadrant D | 4,540,165 | 568,382 |
| Mode SS | |||
|---|---|---|---|
| Quadrant | BADHDUFLAG | Total packets | Discarded packets |
| A | 0 | 132 | 0 |
| B | 0 | 132 | 0 |
| C | 0 | 132 | 0 |
| D | 0 | 132 | 0 |
| Mode M0 | |||
|---|---|---|---|
| Quadrant | BADHDUFLAG | Total packets | Discarded packets |
| A | 0 | 18813 | 2 |
| B | 0 | 14042 | 2 |
| C | 0 | 17528 | 2 |
| D | 0 | 17980 | 2 |
| Mode M9 | |||
|---|---|---|---|
| Quadrant | BADHDUFLAG | Total packets | Discarded packets |
| A | 0 | 12 | 0 |
| B | 0 | 12 | 0 |
| C | 0 | 12 | 0 |
| D | 0 | 12 | 0 |
| Quadrant | Total seconds | Saturated seconds | Saturation percentage |
|---|---|---|---|
| A | 6490 | 413 | 6.363636% |
| B | 6490 | 65 | 1.001541% |
| C | 6490 | 248 | 3.821263% |
| D | 6490 | 316 | 4.869029% |
Noise dominated data is calculated using 1-second bins in cleaned event files. If a bin has >2000 counts, and if more than 50% of those come from <1% of pixels, then it is considered to be noise-dominated and hence unusable.
| Quadrant | # 1 sec bins | Bins with >0 counts | Bins with >2000 counts | High rate bins dominated by noise | Noise dominated (total time) | Noise dominated (detector-on time) | Marked lightcurve |
|---|---|---|---|---|---|---|---|
| A | 7655 | 6491 | 432 | 432 | 5.64% | 6.66% | 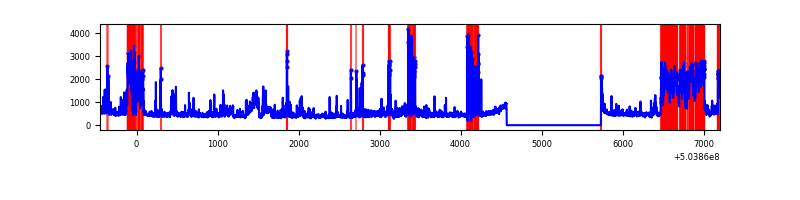 |
| B | 7655 | 6491 | 16 | 16 | 0.21% | 0.25% | 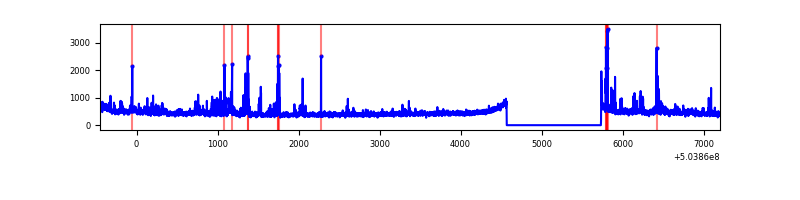 |
| C | 7655 | 6491 | 198 | 198 | 2.59% | 3.05% | 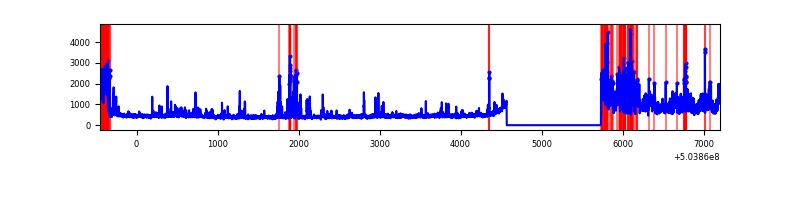 |
| D | 7655 | 6491 | 321 | 321 | 4.19% | 4.95% | 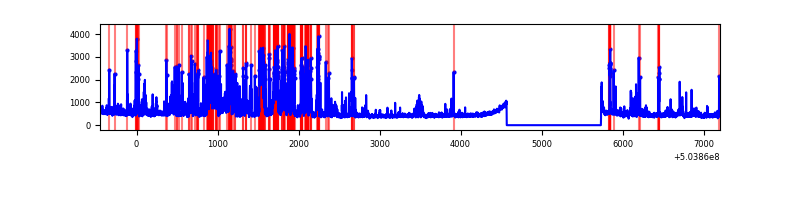 |
Top three noisy pixels from each quadrant. If the there are fewer than three noisy pixels in the level2.evt file, extra rows are filled as -1
| Pixel properties | Quadrant properties | ||||||
|---|---|---|---|---|---|---|---|
| Quadrant | DetID | PixID | Counts | Sigma | Mean | Median | Sigma |
| A | 12 | 115 | 884476 | 5232.5 | 682 | 664 | 168.9 |
| A | 3 | 14 | 581070 | 3436.22 | 682 | 664 | 168.9 |
| A | 0 | 8 | 390649 | 2308.86 | 682 | 664 | 168.9 |
| B | 0 | 199 | 156863 | 1066.0 | 686 | 662 | 146.5 |
| B | 2 | 249 | 60489 | 408.29 | 686 | 662 | 146.5 |
| B | 5 | 185 | 57542 | 388.18 | 686 | 662 | 146.5 |
| C | 9 | 38 | 1145466 | 6178.0 | 672 | 666 | 185.3 |
| C | 12 | 249 | 214137 | 1152.01 | 672 | 666 | 185.3 |
| C | 13 | 3 | 156209 | 839.4 | 672 | 666 | 185.3 |
| D | 11 | 129 | 810957 | 4259.01 | 673 | 644 | 190.3 |
| D | 3 | 12 | 321849 | 1688.25 | 673 | 644 | 190.3 |
| D | 11 | 176 | 285286 | 1496.08 | 673 | 644 | 190.3 |
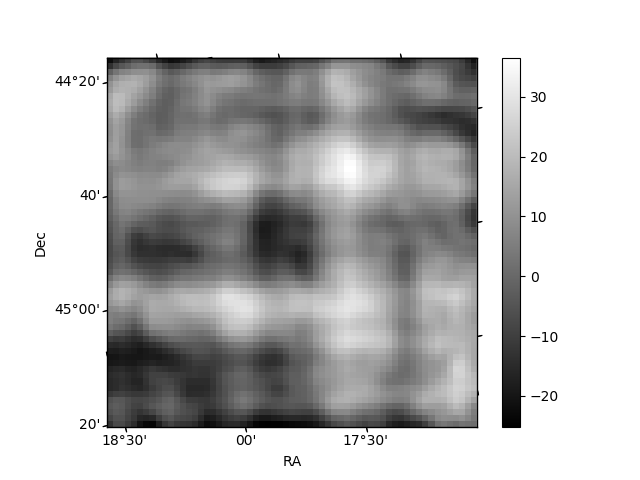
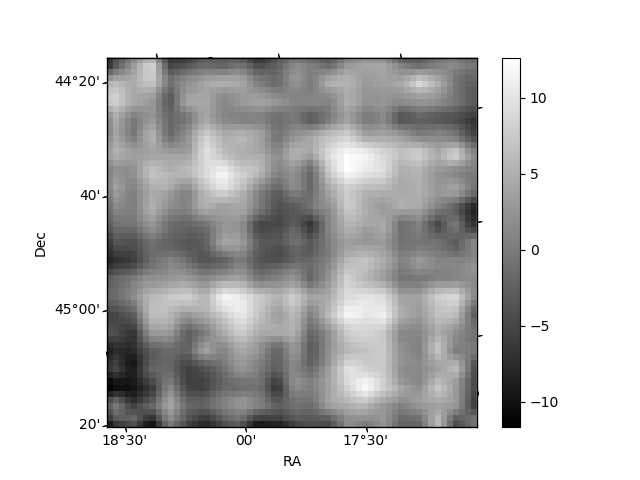
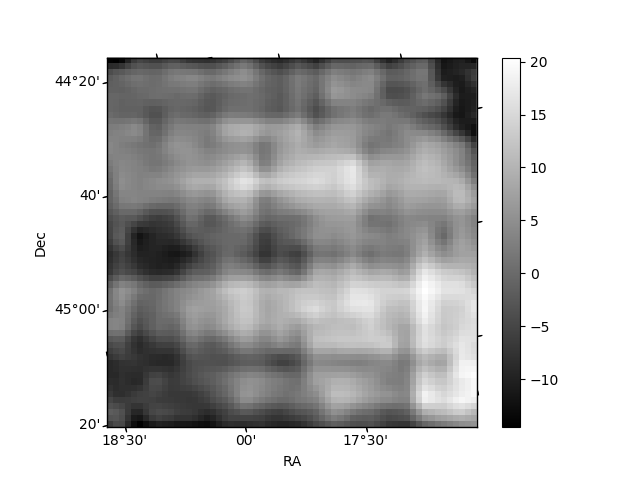
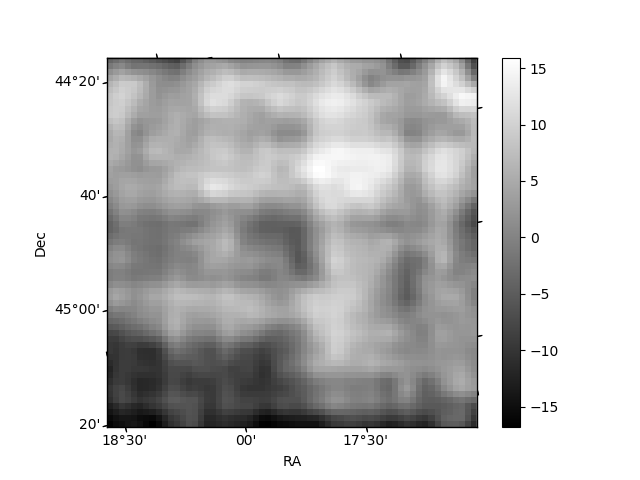
Histogram calculated using DETX and DETY for each event in the final _common_clean file
| Quadrant A | 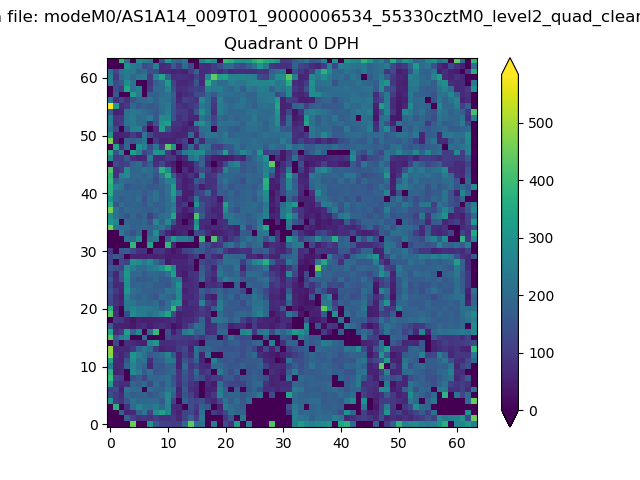 |
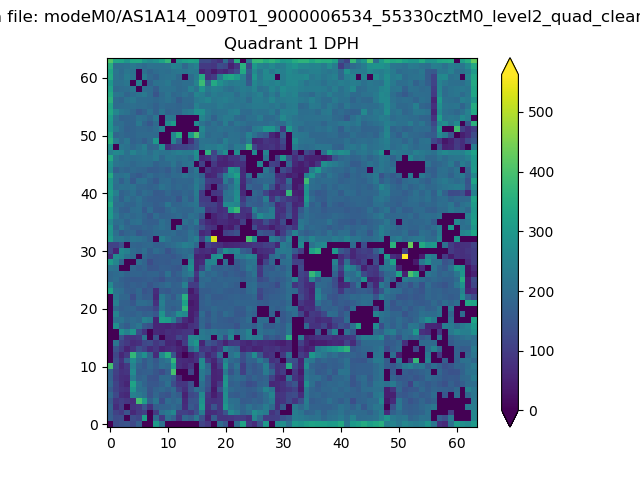 |
Quadrant B |
|---|---|---|---|
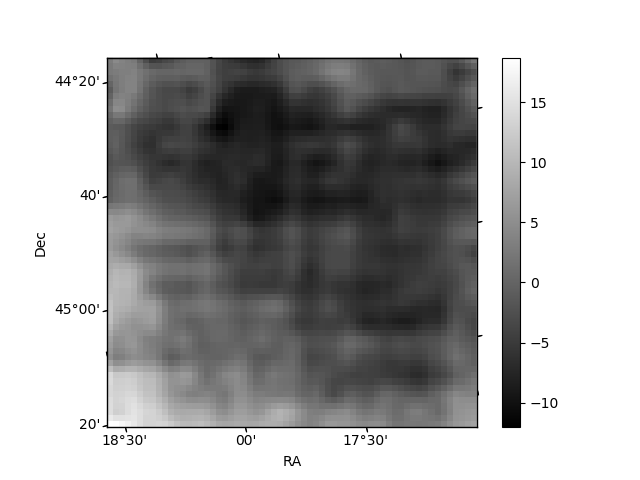
| Quadrant D | 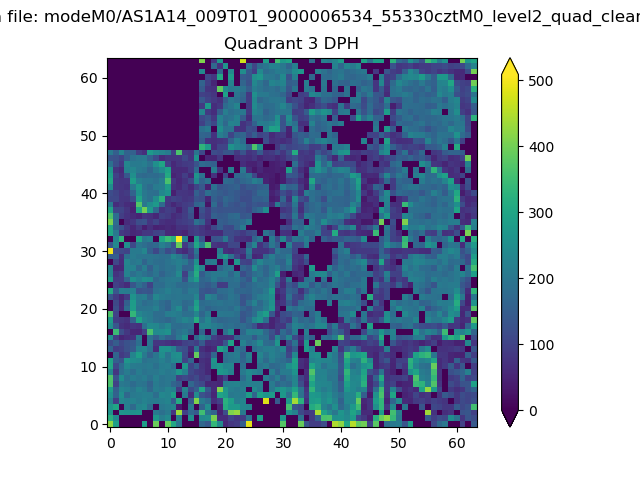 |
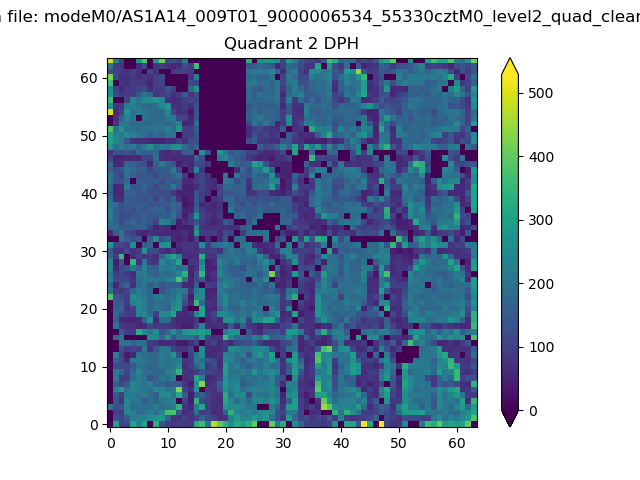 |
Quadrant C |
| Plot type | Count rate plots | Images |
|---|---|---|
| Comparison with Poisson distribution Blue bars denote a histogram of data divided into 1 sec bins. Red curve is a Poisson curve with rate = median count rate of data. |
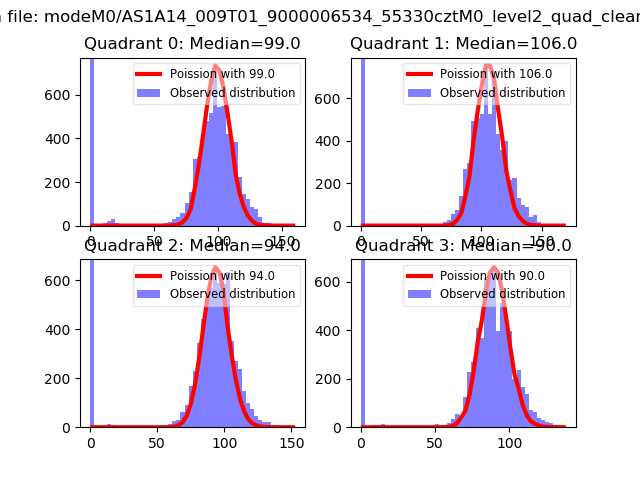 |
 |
| Quadrant-wise count rates Data is divided into 100 sec bins |
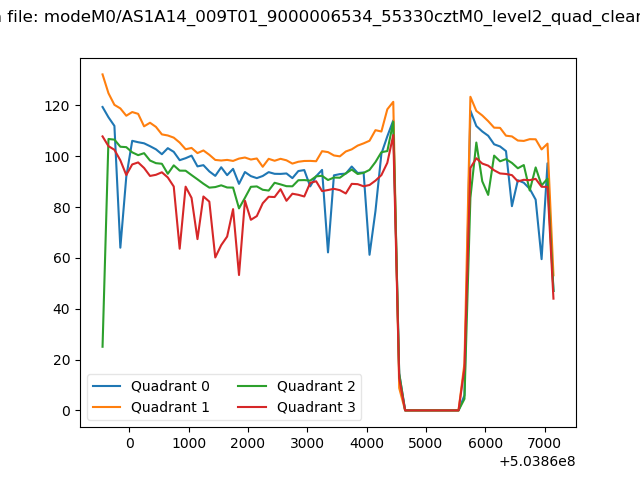 |
|
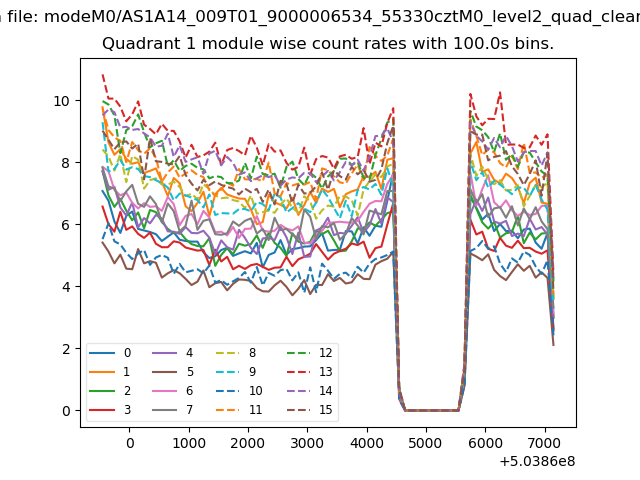
| Module-wise count rates for Quadrant A Data is divided into 100 sec bins |
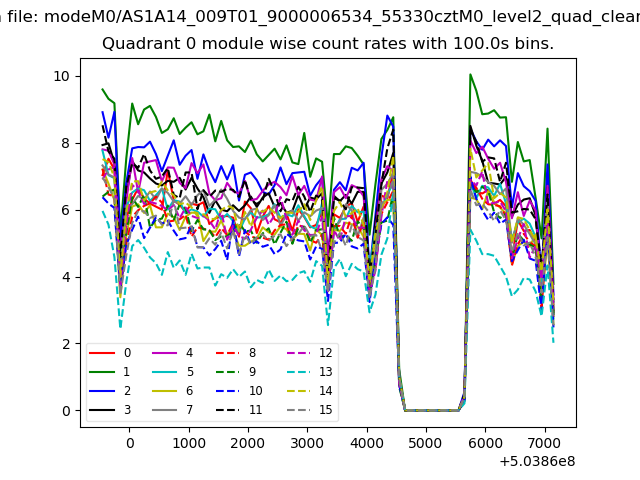 |
 |
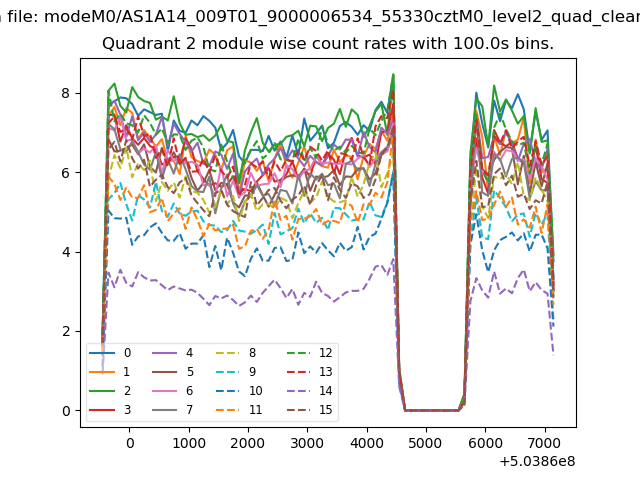
| Module-wise count rates for Quadrant B Data is divided into 100 sec bins |
 |
 |
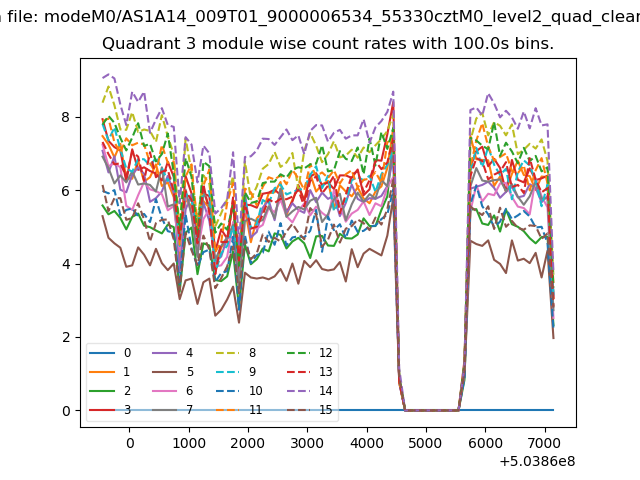
| Module-wise count rates for Quadrant C Data is divided into 100 sec bins |
 |
 |
| Module-wise count rates for Quadrant D Data is divided into 100 sec bins |
 |
 |
| Parameter | Plot |
|---|---|
| CZT HV Monitor | 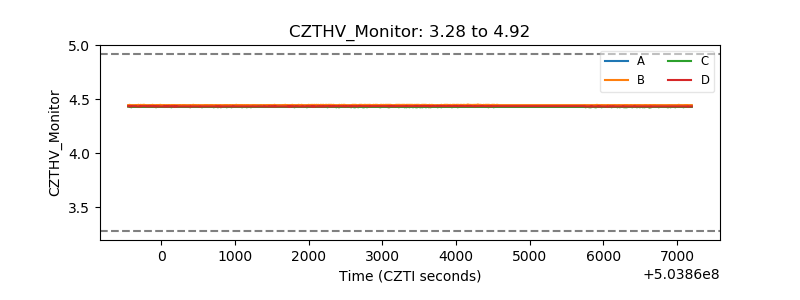 |
| D_VDD | 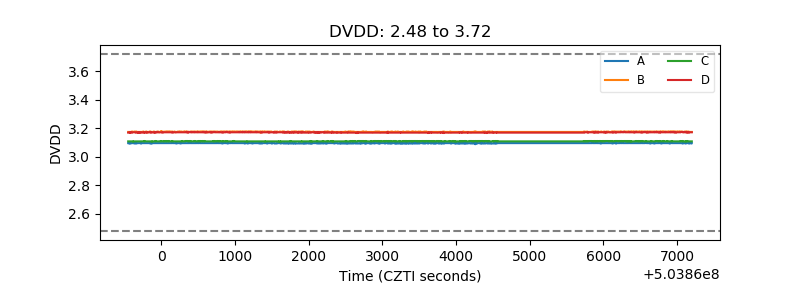 |
| Temperature 1 | 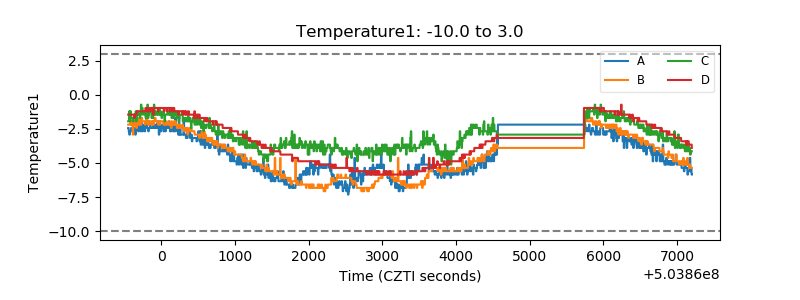 |
| Veto HV Monitor | 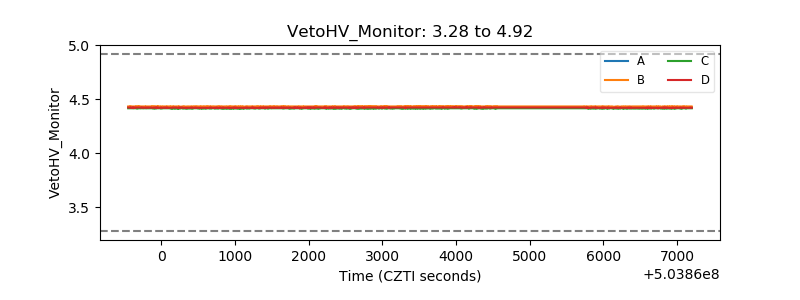 |
| Veto LLD | 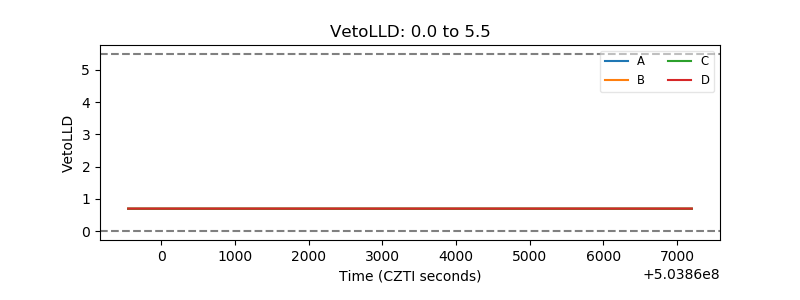 |
| Alpha Counter | 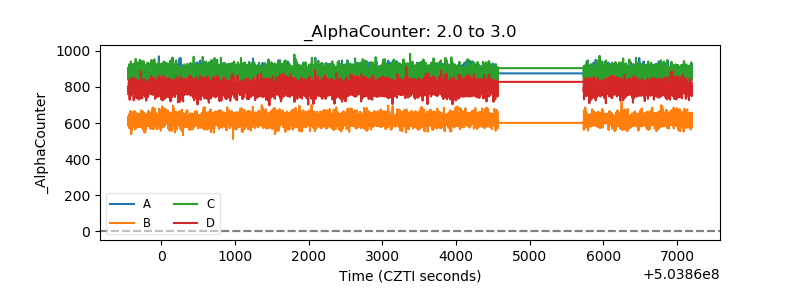 |
| _CPM_Rate | 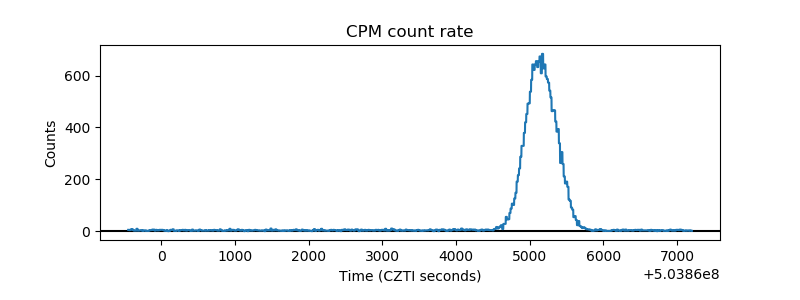 |
| CZT Counter | 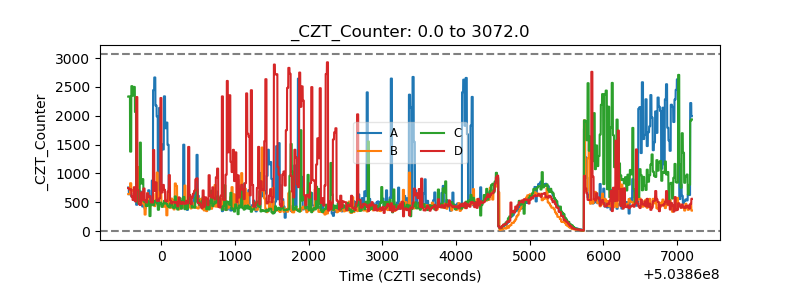 |
| +2.5 Volts monitor | 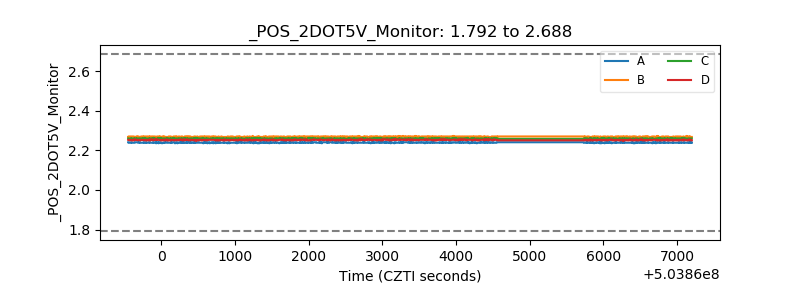 |
| +5 Volts monitor | 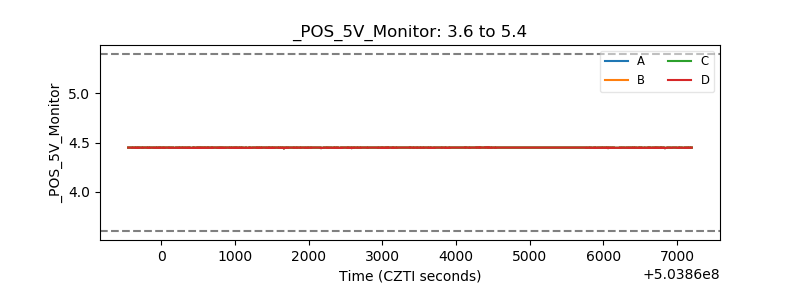 |
| _ROLL_ROT | 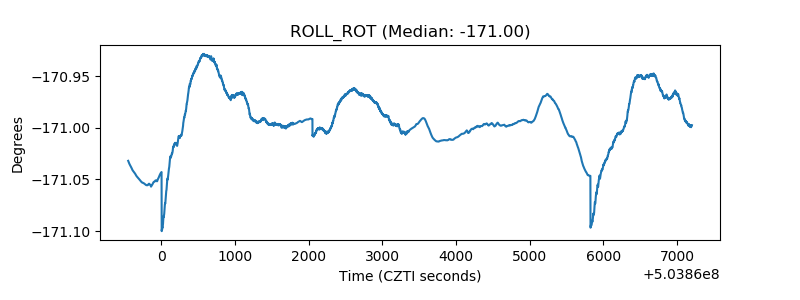 |
| _Roll_DEC | 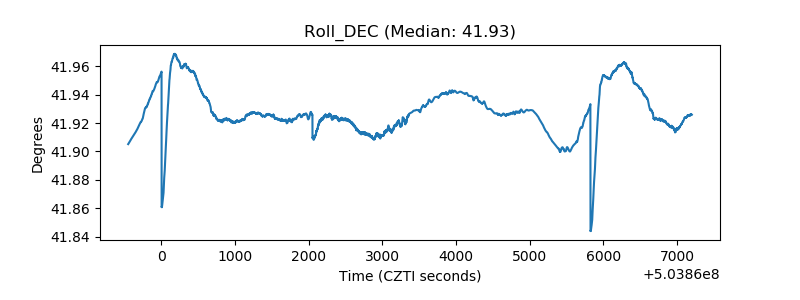 |
| _Roll_RA | 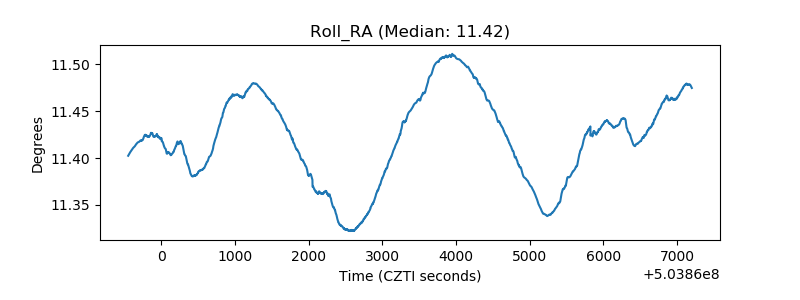 |
| Veto Counter | 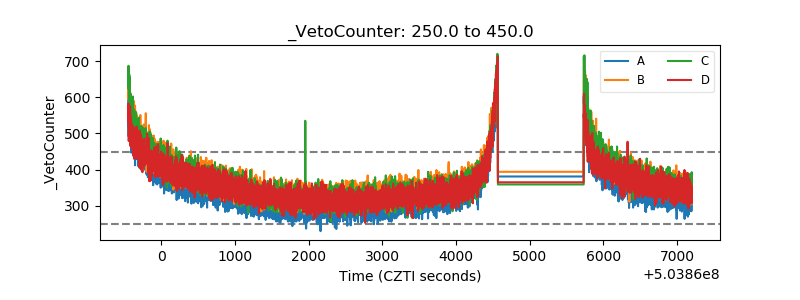 |