| Param | Original file | Final file |
|---|---|---|
| Filename | modeM0/AS1A14_009T01_9000006534_55331cztM0_level2.fits | modeM0/AS1A14_009T01_9000006534_55331cztM0_level2_quad_clean.evt |
| Size (bytes) | 476,746,560 | 94,204,800 |
| Size | 454.7 MB | 89.8 MB |
| Events in quadrant A | 5,016,445 | 594,416 |
| Events in quadrant B | 2,991,452 | 668,262 |
| Events in quadrant C | 5,506,738 | 590,700 |
| Events in quadrant D | 3,633,930 | 550,669 |
| Mode SS | |||
|---|---|---|---|
| Quadrant | BADHDUFLAG | Total packets | Discarded packets |
| A | 0 | 130 | 0 |
| B | 0 | 130 | 0 |
| C | 0 | 130 | 0 |
| D | 0 | 130 | 0 |
| Mode M0 | |||
|---|---|---|---|
| Quadrant | BADHDUFLAG | Total packets | Discarded packets |
| A | 0 | 19308 | 2 |
| B | 0 | 13689 | 2 |
| C | 0 | 20983 | 2 |
| D | 0 | 15602 | 2 |
| Mode M9 | |||
|---|---|---|---|
| Quadrant | BADHDUFLAG | Total packets | Discarded packets |
| A | 0 | 17 | 0 |
| B | 0 | 17 | 0 |
| C | 0 | 18 | 0 |
| D | 0 | 18 | 0 |
| Quadrant | Total seconds | Saturated seconds | Saturation percentage |
|---|---|---|---|
| A | 6427 | 427 | 6.643846% |
| B | 6427 | 61 | 0.949121% |
| C | 6427 | 229 | 3.563093% |
| D | 6427 | 242 | 3.765365% |
Noise dominated data is calculated using 1-second bins in cleaned event files. If a bin has >2000 counts, and if more than 50% of those come from <1% of pixels, then it is considered to be noise-dominated and hence unusable.
| Quadrant | # 1 sec bins | Bins with >0 counts | Bins with >2000 counts | High rate bins dominated by noise | Noise dominated (total time) | Noise dominated (detector-on time) | Marked lightcurve |
|---|---|---|---|---|---|---|---|
| A | 7512 | 6428 | 433 | 433 | 5.76% | 6.74% | 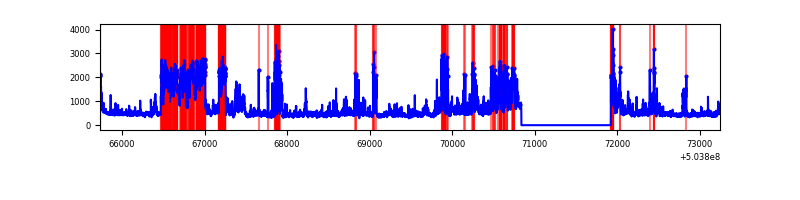 |
| B | 7512 | 6428 | 14 | 14 | 0.19% | 0.22% | 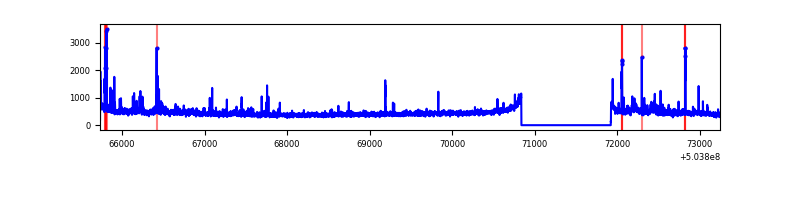 |
| C | 7512 | 6428 | 214 | 214 | 2.85% | 3.33% | 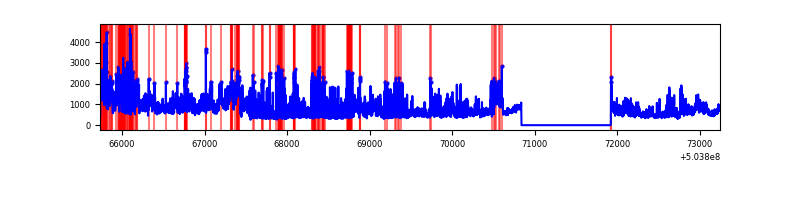 |
| D | 7512 | 6428 | 201 | 201 | 2.68% | 3.13% | 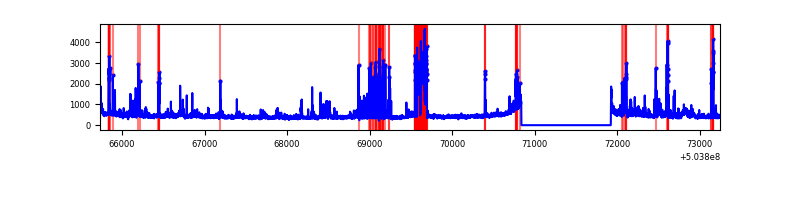 |
Top three noisy pixels from each quadrant. If the there are fewer than three noisy pixels in the level2.evt file, extra rows are filled as -1
| Pixel properties | Quadrant properties | ||||||
|---|---|---|---|---|---|---|---|
| Quadrant | DetID | PixID | Counts | Sigma | Mean | Median | Sigma |
| A | 12 | 115 | 1122903 | 6748.0 | 667 | 651 | 166.3 |
| A | 3 | 78 | 799598 | 4803.99 | 667 | 651 | 166.3 |
| A | 3 | 14 | 208587 | 1250.3 | 667 | 651 | 166.3 |
| B | 0 | 199 | 99018 | 687.77 | 673 | 649 | 143.0 |
| B | 10 | 247 | 70032 | 485.11 | 673 | 649 | 143.0 |
| B | 5 | 185 | 65420 | 452.86 | 673 | 649 | 143.0 |
| C | 9 | 38 | 2564516 | 14073.3 | 661 | 656 | 182.2 |
| C | 12 | 249 | 215140 | 1177.33 | 661 | 656 | 182.2 |
| C | 14 | 254 | 41063 | 221.8 | 661 | 656 | 182.2 |
| D | 11 | 176 | 607585 | 3263.51 | 655 | 626 | 186.0 |
| D | 2 | 62 | 81773 | 436.31 | 655 | 626 | 186.0 |
| D | 11 | 129 | 81553 | 435.13 | 655 | 626 | 186.0 |
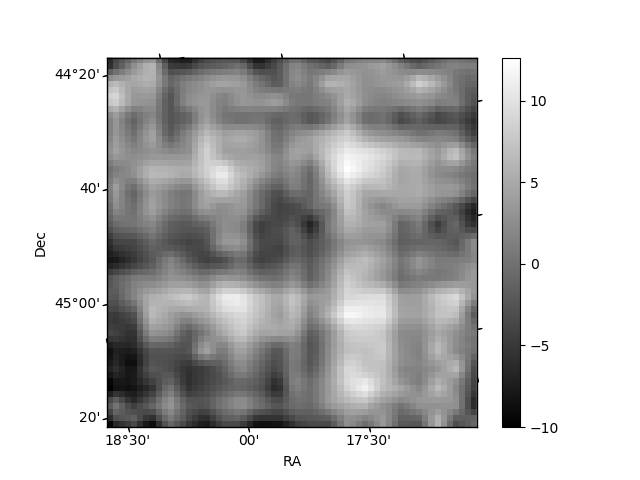
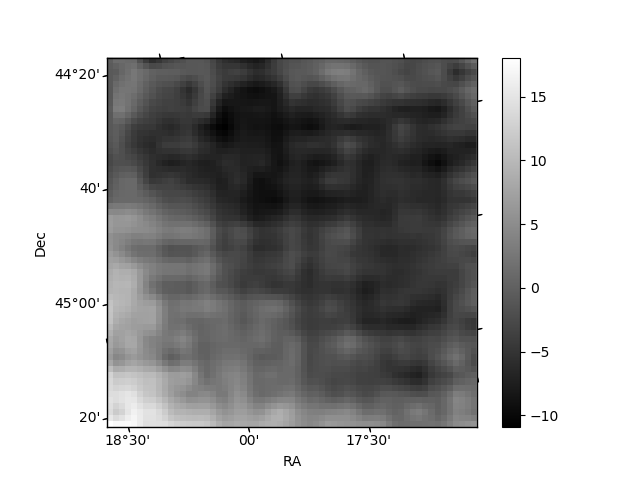
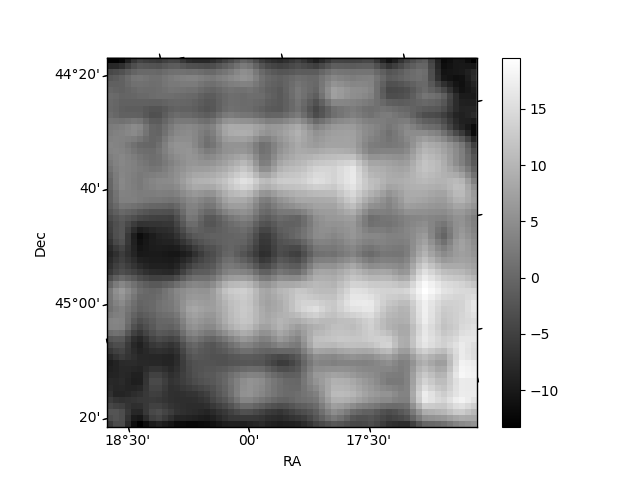
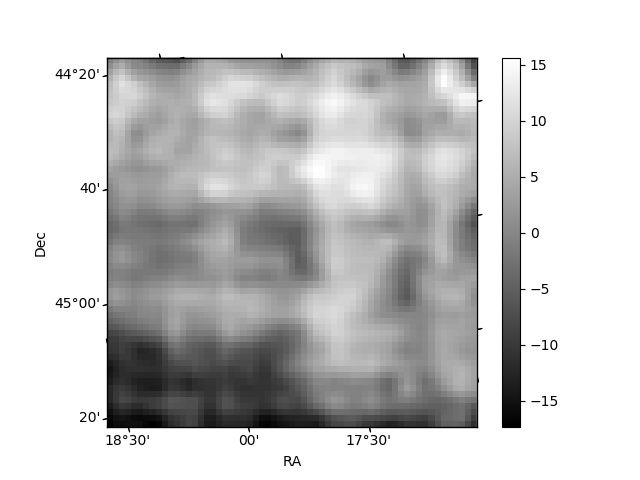
Histogram calculated using DETX and DETY for each event in the final _common_clean file
| Quadrant A | 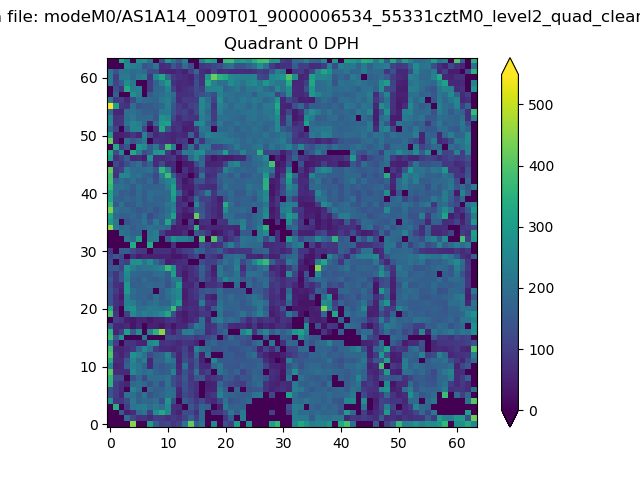 |
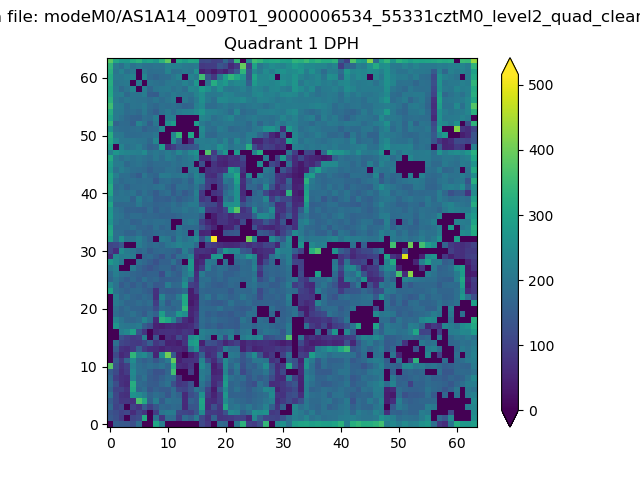 |
Quadrant B |
|---|---|---|---|
| Quadrant D | 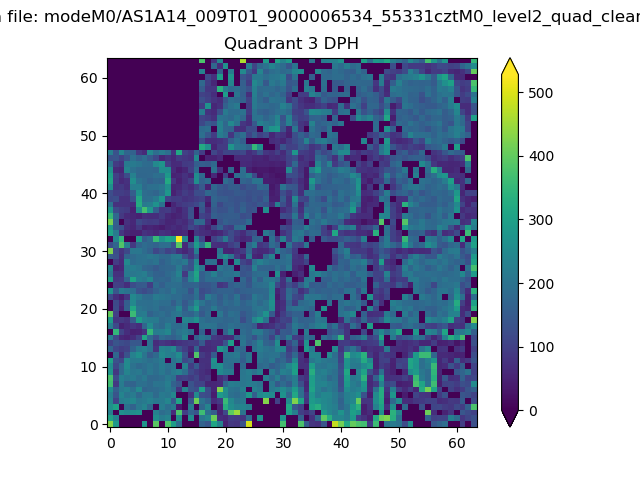 |
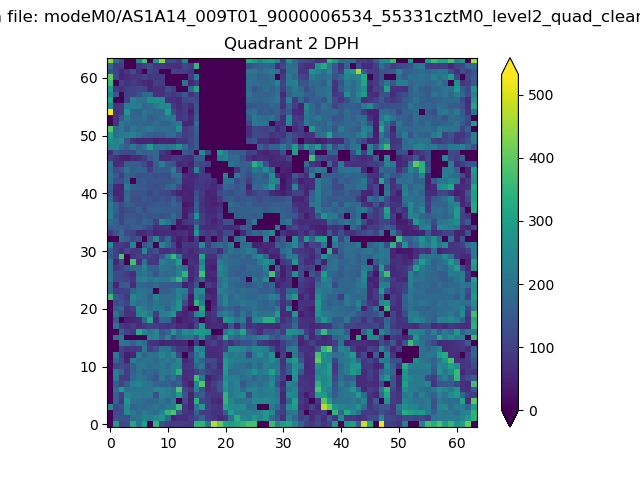 |
Quadrant C |
| Plot type | Count rate plots | Images |
|---|---|---|
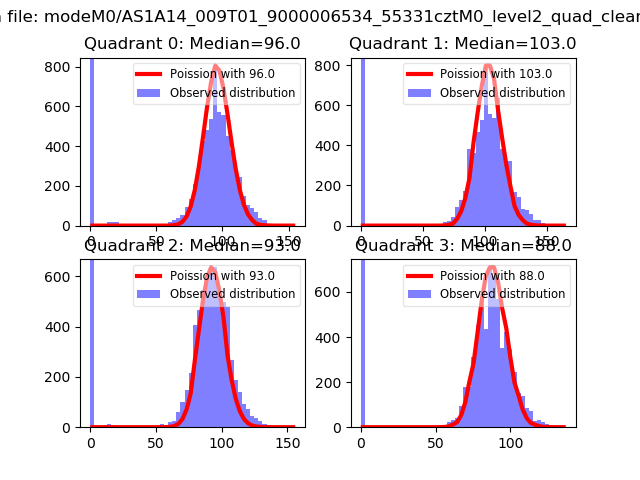
| Comparison with Poisson distribution Blue bars denote a histogram of data divided into 1 sec bins. Red curve is a Poisson curve with rate = median count rate of data. |
 |
 |
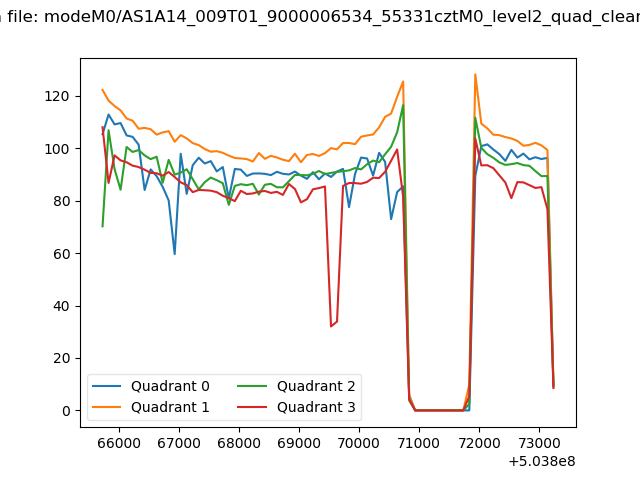
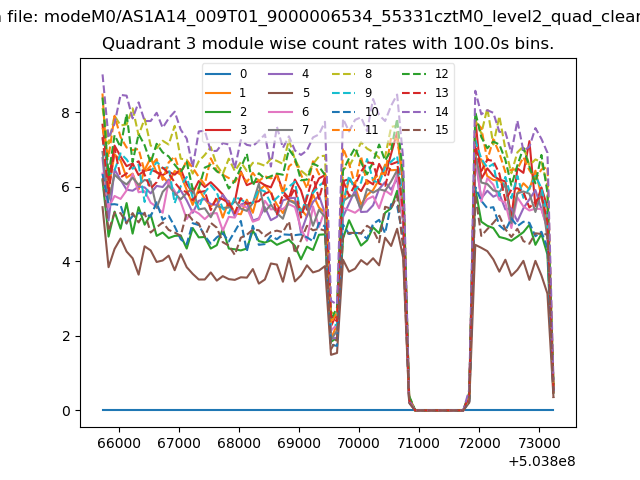
| Quadrant-wise count rates Data is divided into 100 sec bins |
 |
|
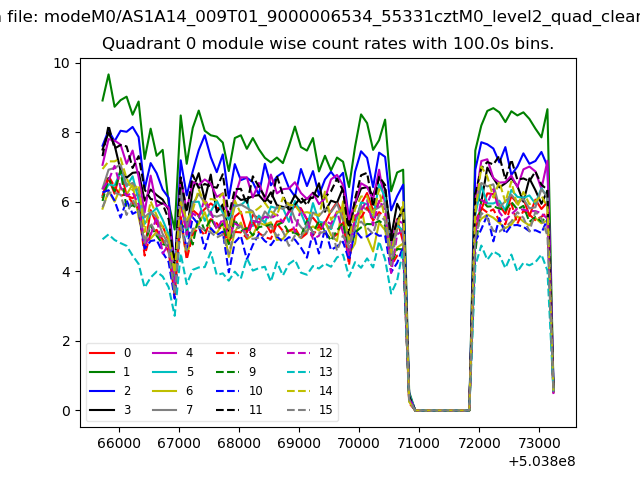
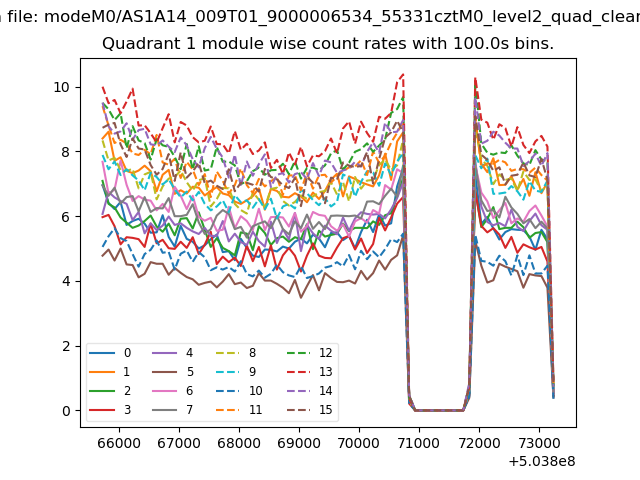
| Module-wise count rates for Quadrant A Data is divided into 100 sec bins |
 |
 |
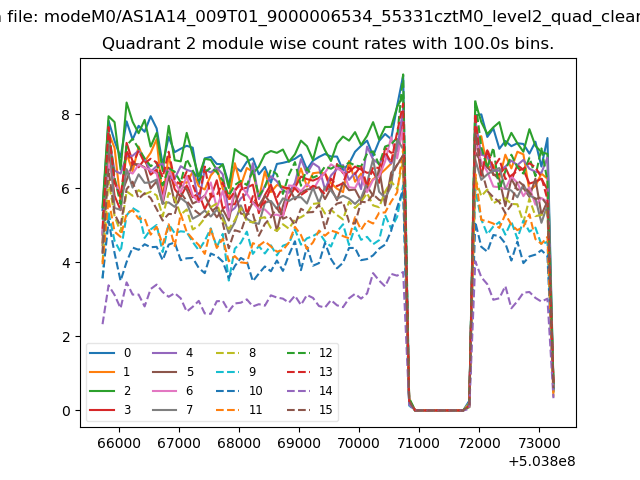
| Module-wise count rates for Quadrant B Data is divided into 100 sec bins |
 |
 |
| Module-wise count rates for Quadrant C Data is divided into 100 sec bins |
 |
 |
| Module-wise count rates for Quadrant D Data is divided into 100 sec bins |
 |
 |
| Parameter | Plot |
|---|---|
| CZT HV Monitor | 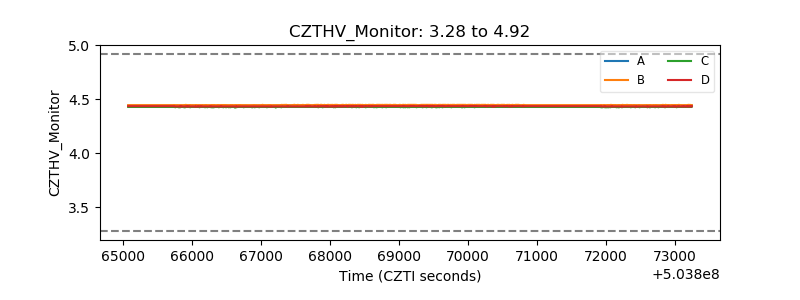 |
| D_VDD | 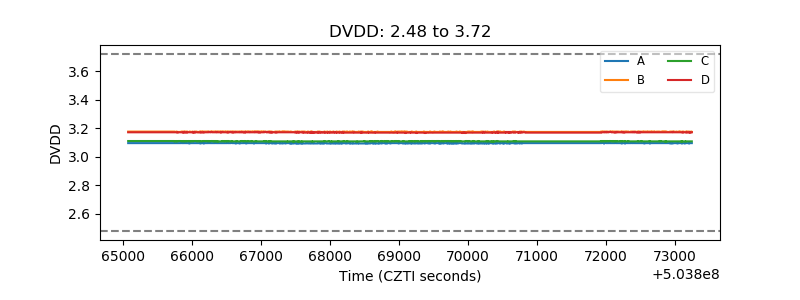 |
| Temperature 1 | 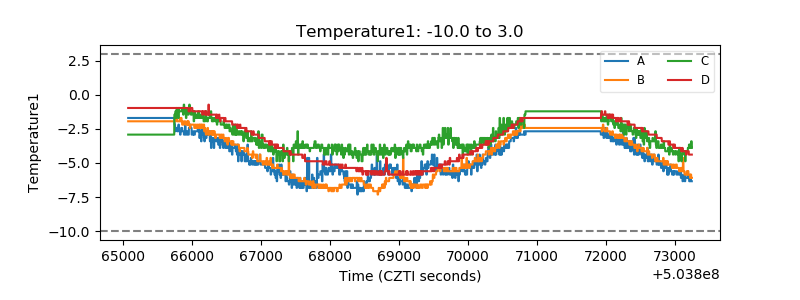 |
| Veto HV Monitor | 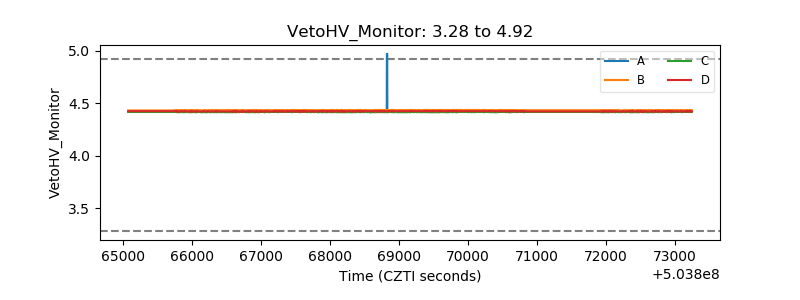 |
| Veto LLD | 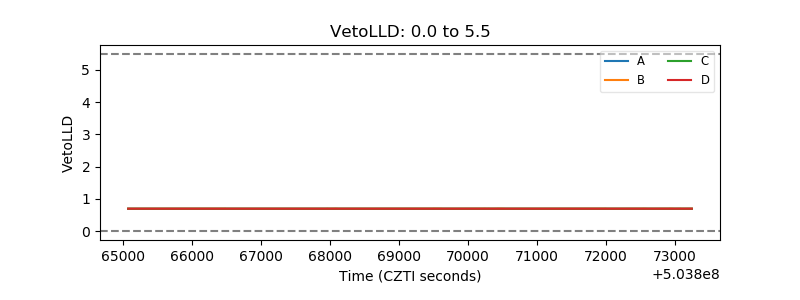 |
| Alpha Counter | 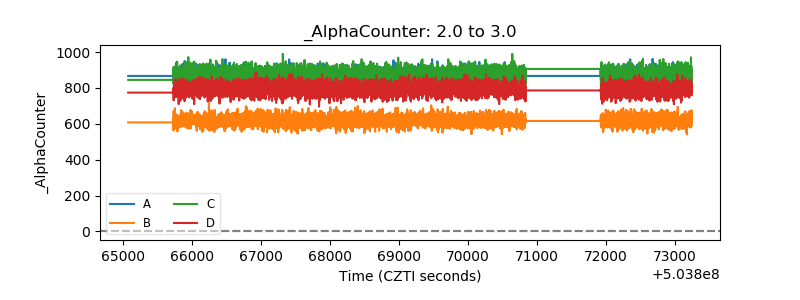 |
| _CPM_Rate | 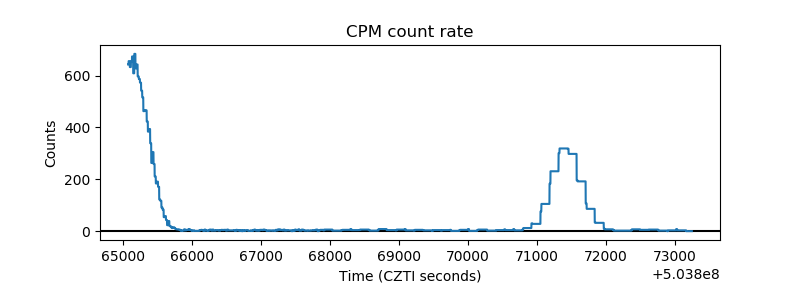 |
| CZT Counter | 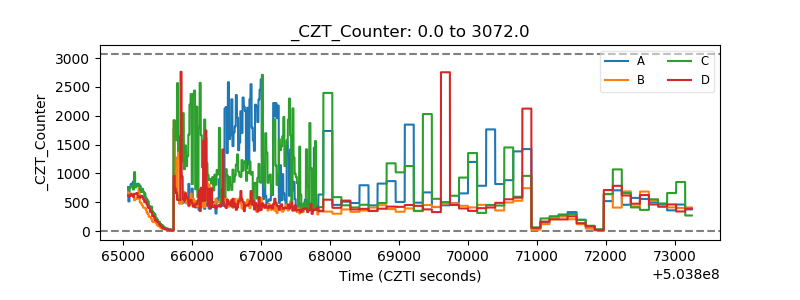 |
| +2.5 Volts monitor | 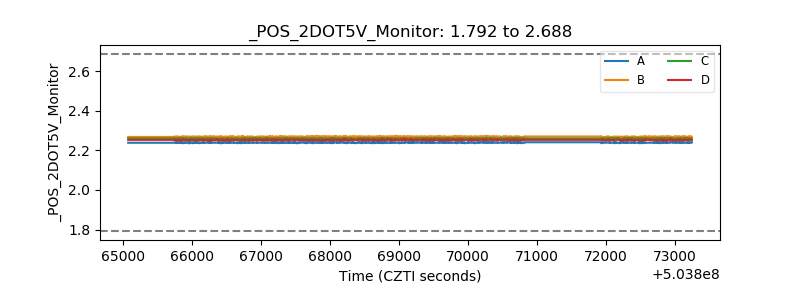 |
| +5 Volts monitor | 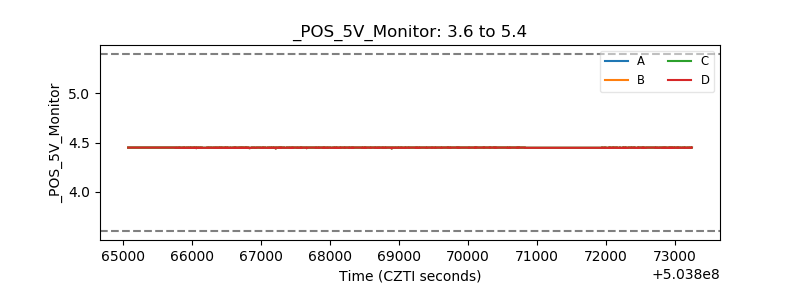 |
| _ROLL_ROT | 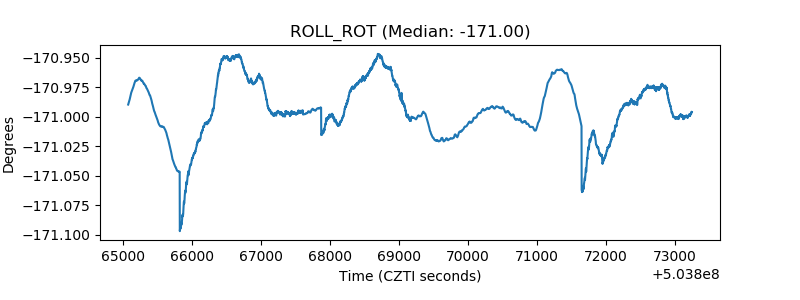 |
| _Roll_DEC | 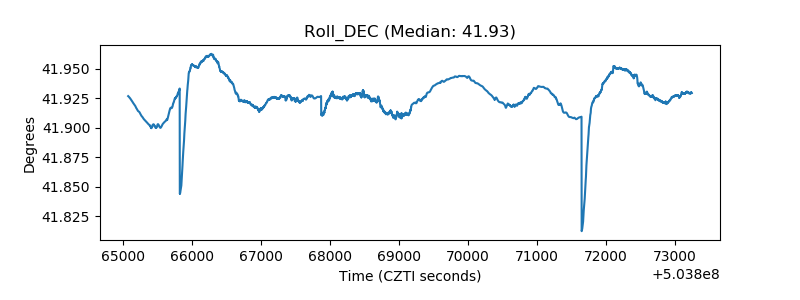 |
| _Roll_RA | 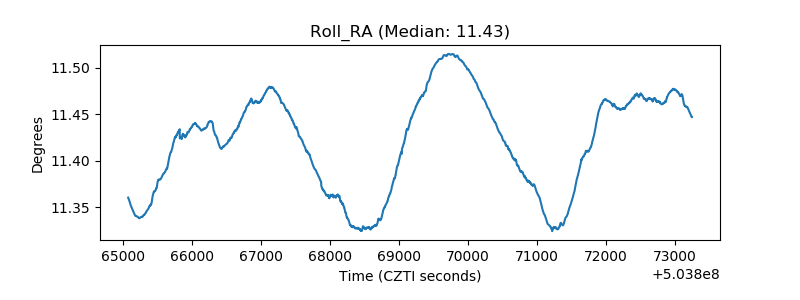 |
| Veto Counter | 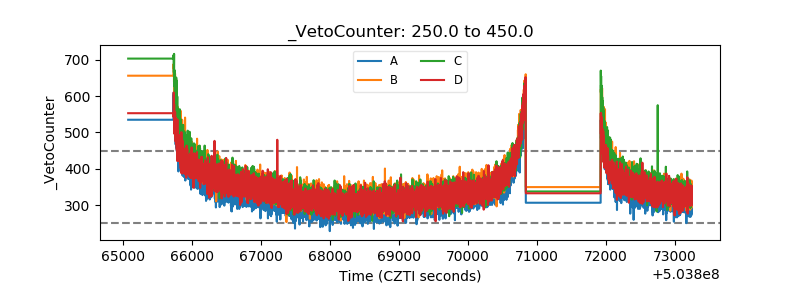 |