| Param | Original file | Final file |
|---|---|---|
| Filename | modeM0/AS1A14_009T01_9000006534_55332cztM0_level2.fits | modeM0/AS1A14_009T01_9000006534_55332cztM0_level2_quad_clean.evt |
| Size (bytes) | 527,293,440 | 94,659,840 |
| Size | 502.9 MB | 90.3 MB |
| Events in quadrant A | 3,882,212 | 624,900 |
| Events in quadrant B | 3,127,471 | 688,006 |
| Events in quadrant C | 7,990,142 | 502,943 |
| Events in quadrant D | 3,990,071 | 575,931 |
| Mode SS | |||
|---|---|---|---|
| Quadrant | BADHDUFLAG | Total packets | Discarded packets |
| A | 0 | 138 | 0 |
| B | 0 | 138 | 0 |
| C | 0 | 138 | 0 |
| D | 0 | 138 | 0 |
| Mode M0 | |||
|---|---|---|---|
| Quadrant | BADHDUFLAG | Total packets | Discarded packets |
| A | 0 | 16360 | 3 |
| B | 0 | 14555 | 2 |
| C | 0 | 28506 | 2 |
| D | 0 | 16893 | 2 |
| Mode M9 | |||
|---|---|---|---|
| Quadrant | BADHDUFLAG | Total packets | Discarded packets |
| A | 0 | 14 | 0 |
| B | 0 | 15 | 0 |
| C | 0 | 15 | 0 |
| D | 0 | 15 | 0 |
| Quadrant | Total seconds | Saturated seconds | Saturation percentage |
|---|---|---|---|
| A | 6808 | 194 | 2.849589% |
| B | 6808 | 37 | 0.543478% |
| C | 6808 | 1406 | 20.652174% |
| D | 6808 | 154 | 2.262045% |
Noise dominated data is calculated using 1-second bins in cleaned event files. If a bin has >2000 counts, and if more than 50% of those come from <1% of pixels, then it is considered to be noise-dominated and hence unusable.
| Quadrant | # 1 sec bins | Bins with >0 counts | Bins with >2000 counts | High rate bins dominated by noise | Noise dominated (total time) | Noise dominated (detector-on time) | Marked lightcurve |
|---|---|---|---|---|---|---|---|
| A | 7683 | 6809 | 138 | 138 | 1.80% | 2.03% | 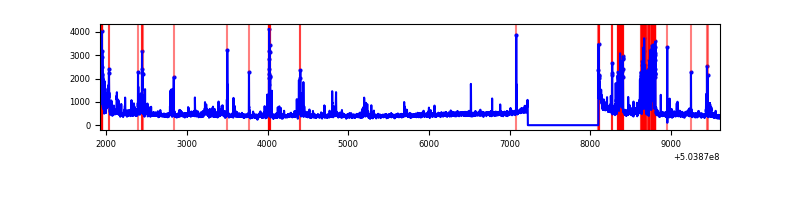 |
| B | 7683 | 6809 | 10 | 10 | 0.13% | 0.15% | 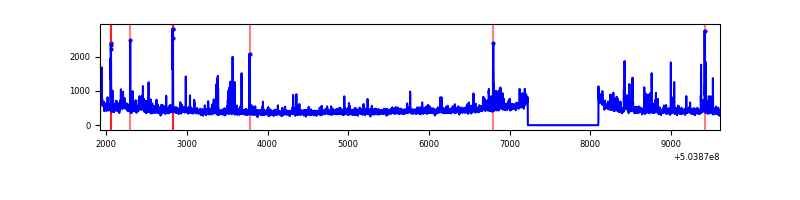 |
| C | 7683 | 6809 | 1307 | 1307 | 17.01% | 19.20% | 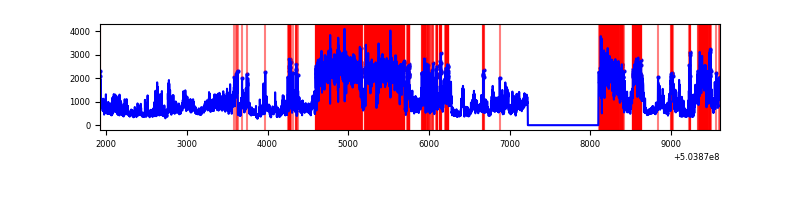 |
| D | 7683 | 6809 | 135 | 135 | 1.76% | 1.98% | 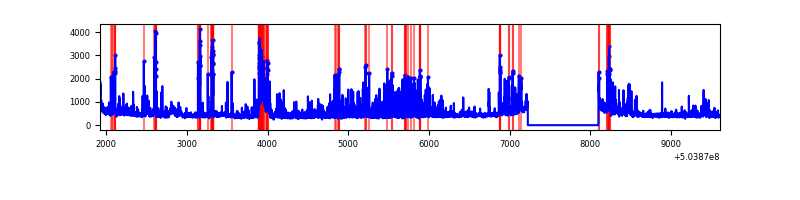 |
Top three noisy pixels from each quadrant. If the there are fewer than three noisy pixels in the level2.evt file, extra rows are filled as -1
| Pixel properties | Quadrant properties | ||||||
|---|---|---|---|---|---|---|---|
| Quadrant | DetID | PixID | Counts | Sigma | Mean | Median | Sigma |
| A | 0 | 8 | 475673 | 2758.47 | 697 | 680 | 172.2 |
| A | 3 | 14 | 318899 | 1848.02 | 697 | 680 | 172.2 |
| A | 3 | 78 | 287774 | 1667.27 | 697 | 680 | 172.2 |
| B | 0 | 199 | 132861 | 882.72 | 702 | 677 | 149.7 |
| B | 10 | 247 | 62948 | 415.84 | 702 | 677 | 149.7 |
| B | 7 | 252 | 54557 | 359.81 | 702 | 677 | 149.7 |
| C | 9 | 38 | 5190504 | 29359.69 | 637 | 628 | 176.8 |
| C | 13 | 3 | 192943 | 1087.95 | 637 | 628 | 176.8 |
| C | 5 | 10 | 33624 | 186.66 | 637 | 628 | 176.8 |
| D | 7 | 70 | 362280 | 1863.49 | 686 | 658 | 194.1 |
| D | 2 | 62 | 184961 | 949.74 | 686 | 658 | 194.1 |
| D | 7 | 96 | 180354 | 926.0 | 686 | 658 | 194.1 |
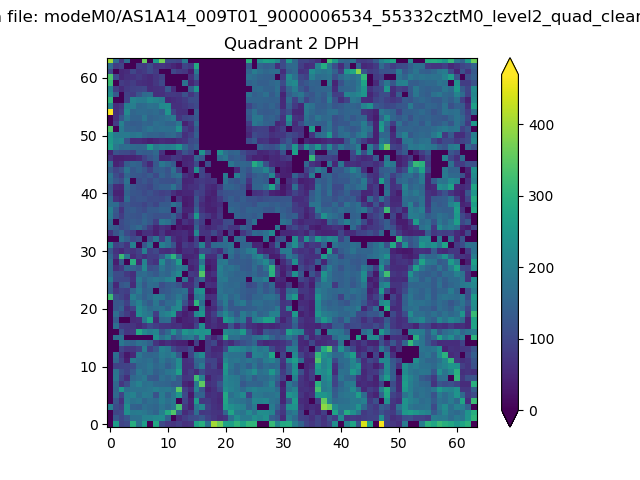
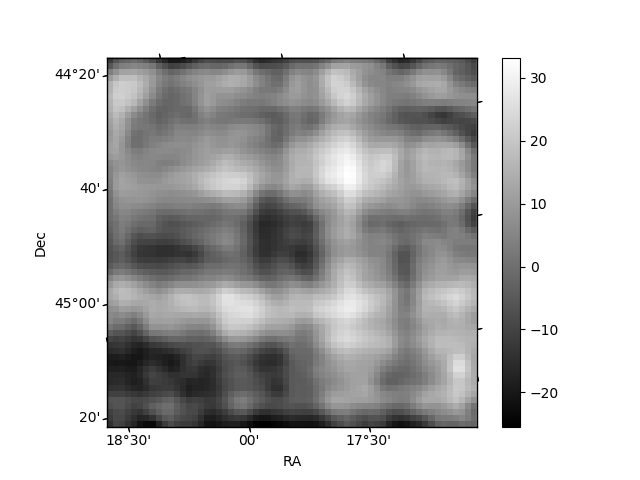
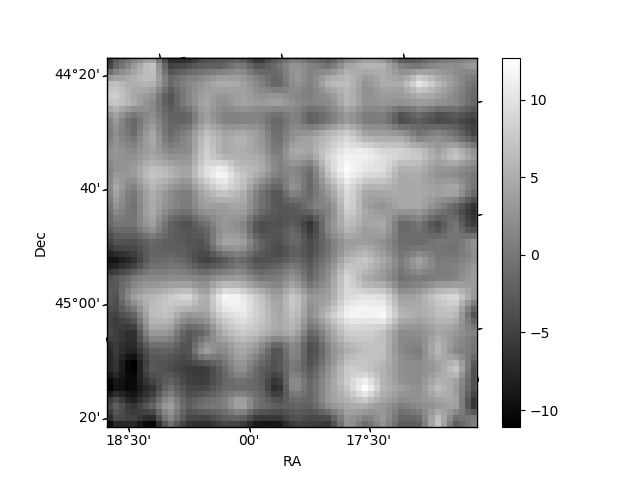
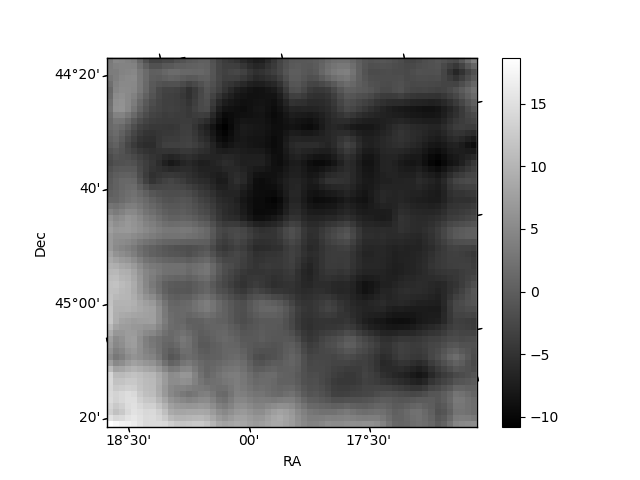
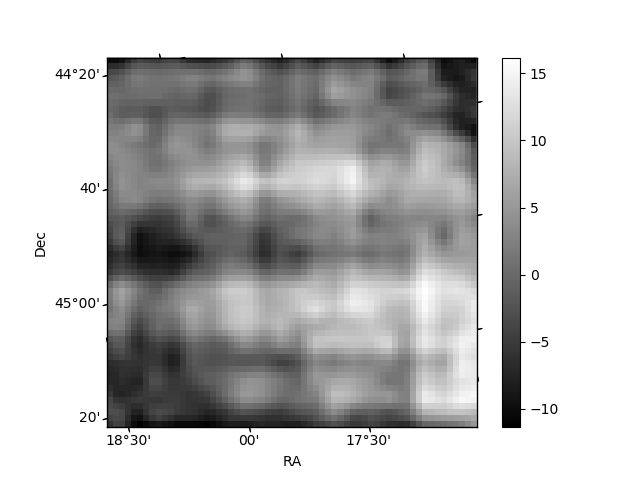
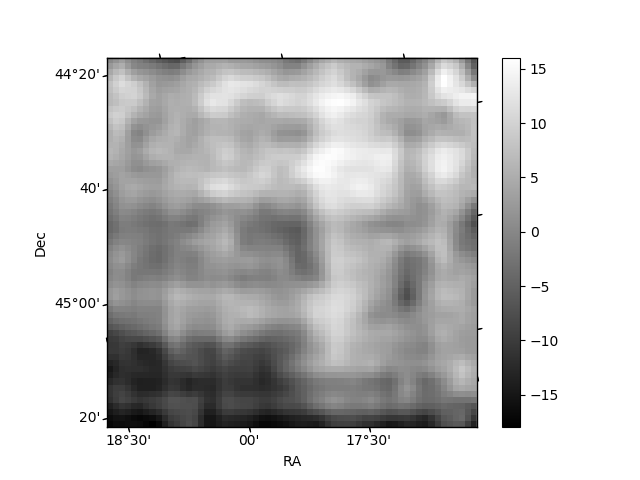
Histogram calculated using DETX and DETY for each event in the final _common_clean file
| Quadrant A | 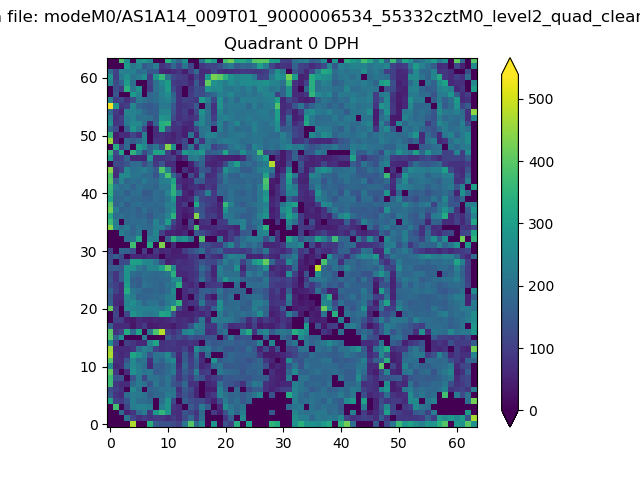 |
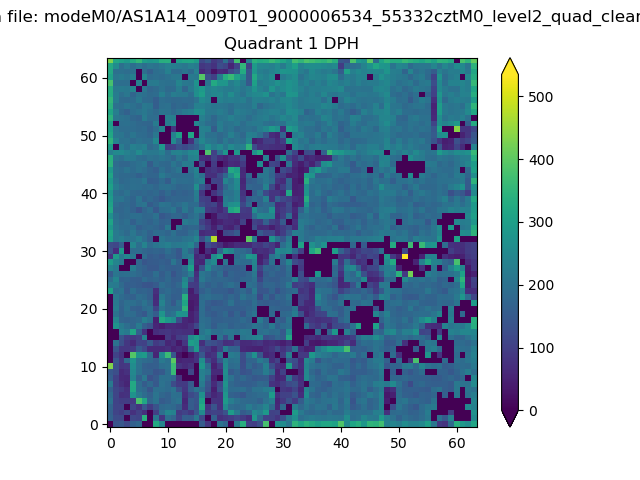 |
Quadrant B |
|---|---|---|---|
| Quadrant D | 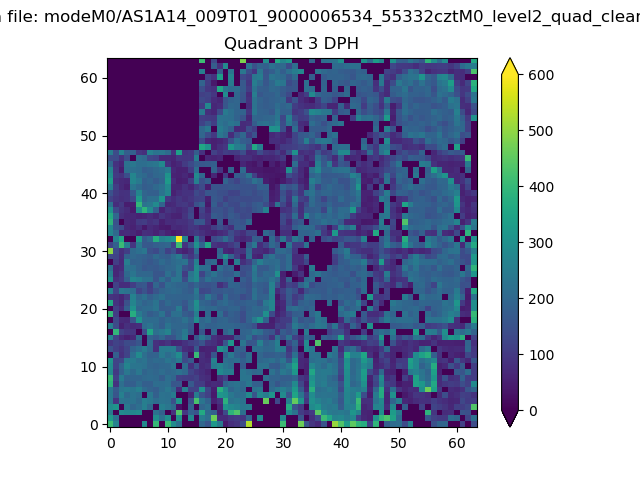 |
 |
Quadrant C |
| Plot type | Count rate plots | Images |
|---|---|---|
| Comparison with Poisson distribution Blue bars denote a histogram of data divided into 1 sec bins. Red curve is a Poisson curve with rate = median count rate of data. |
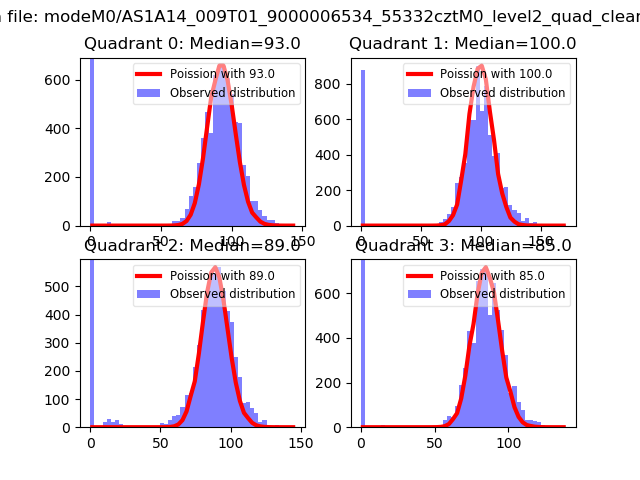 |
 |
| Quadrant-wise count rates Data is divided into 100 sec bins |
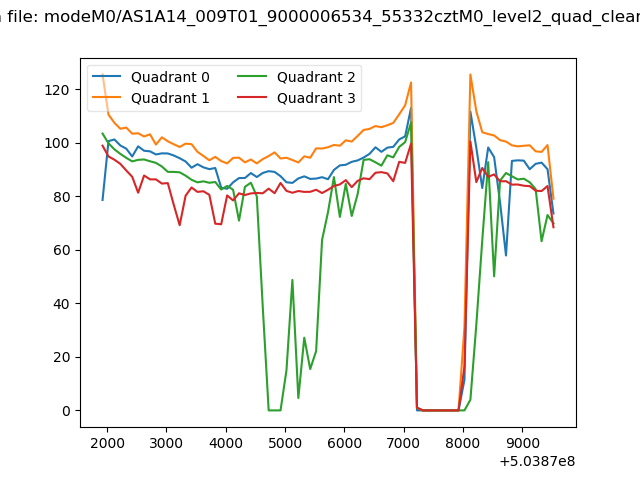 |
|
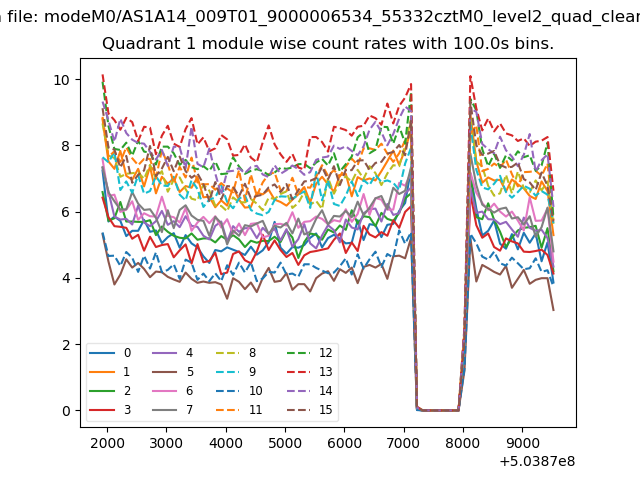
| Module-wise count rates for Quadrant A Data is divided into 100 sec bins |
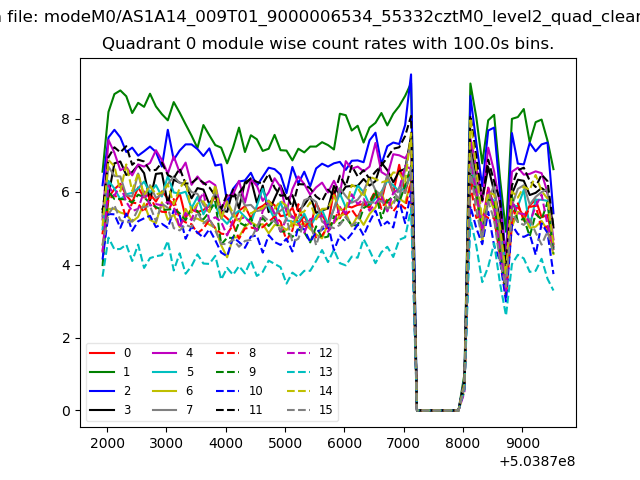 |
 |
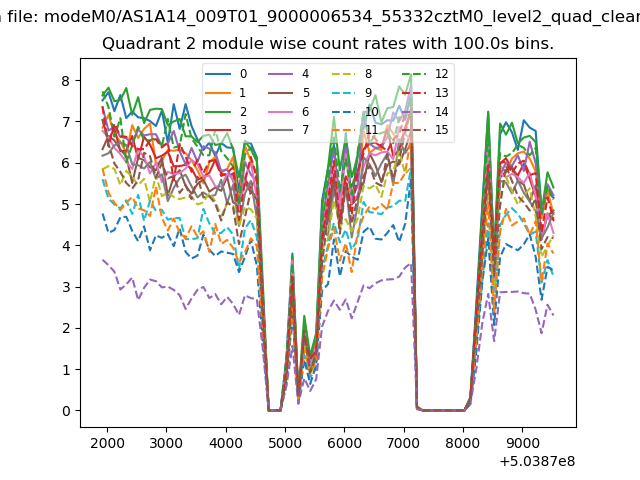
| Module-wise count rates for Quadrant B Data is divided into 100 sec bins |
 |
 |
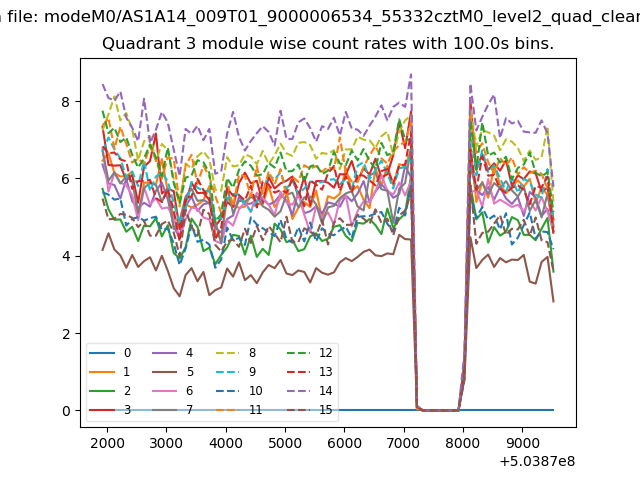
| Module-wise count rates for Quadrant C Data is divided into 100 sec bins |
 |
 |
| Module-wise count rates for Quadrant D Data is divided into 100 sec bins |
 |
 |
| Parameter | Plot |
|---|---|
| CZT HV Monitor | 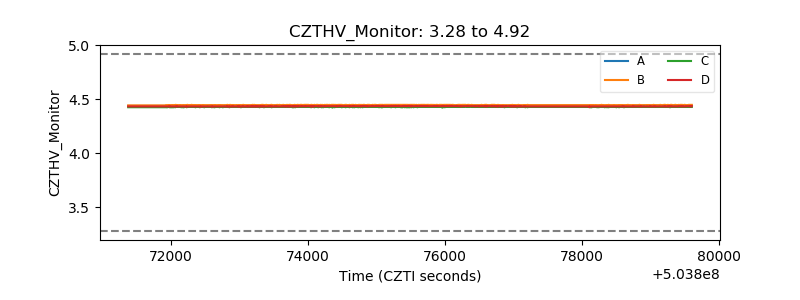 |
| D_VDD | 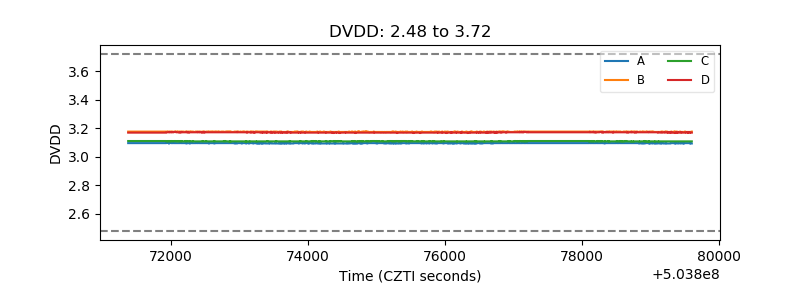 |
| Temperature 1 | 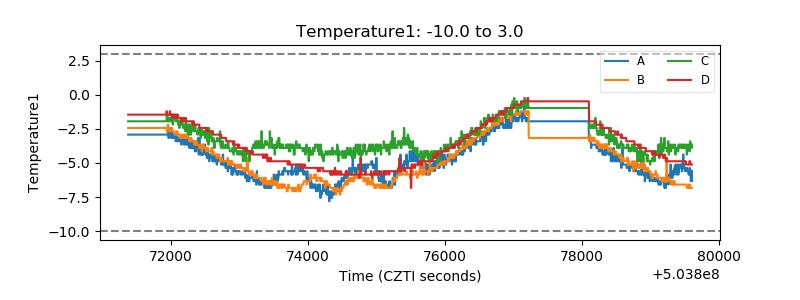 |
| Veto HV Monitor |  |
| Veto LLD | 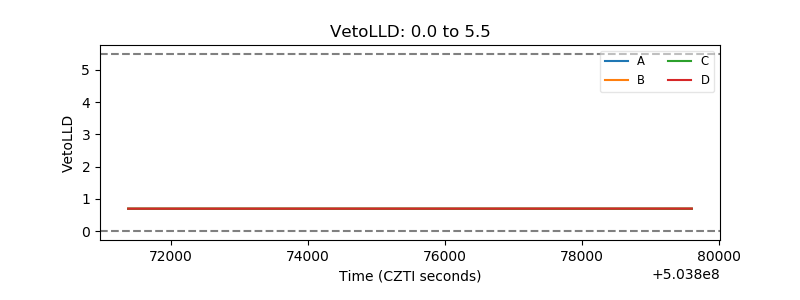 |
| Alpha Counter | 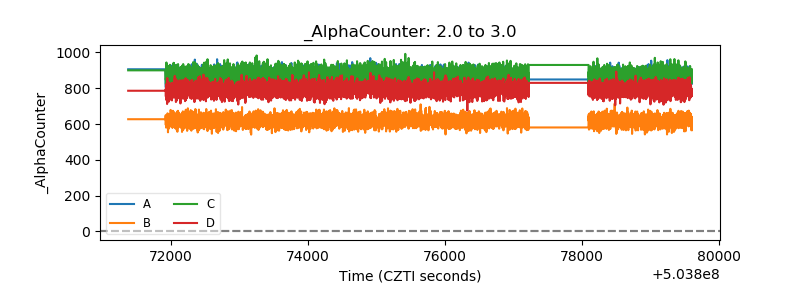 |
| _CPM_Rate | 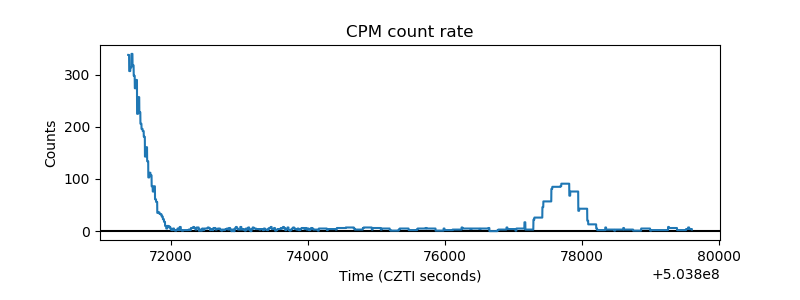 |
| CZT Counter | 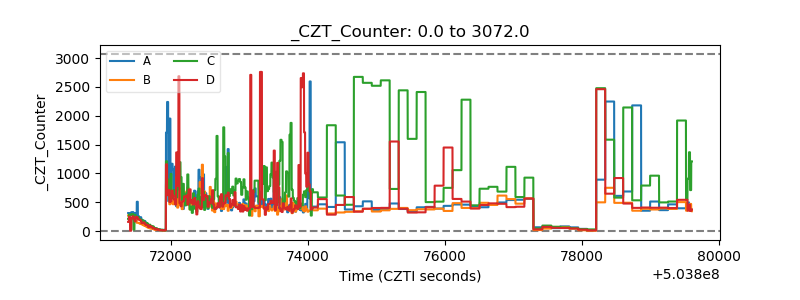 |
| +2.5 Volts monitor |  |
| +5 Volts monitor | 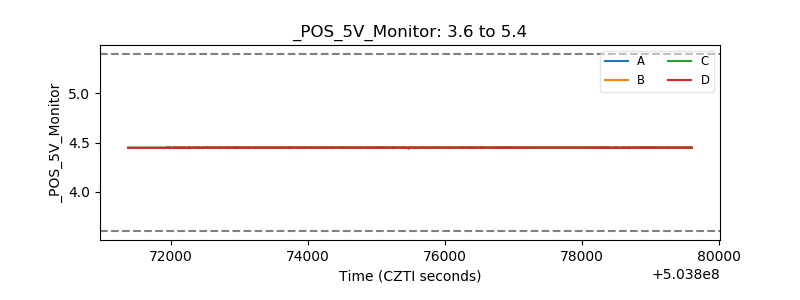 |
| _ROLL_ROT | 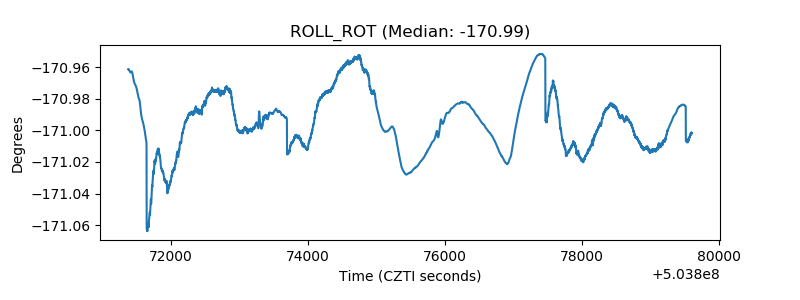 |
| _Roll_DEC | 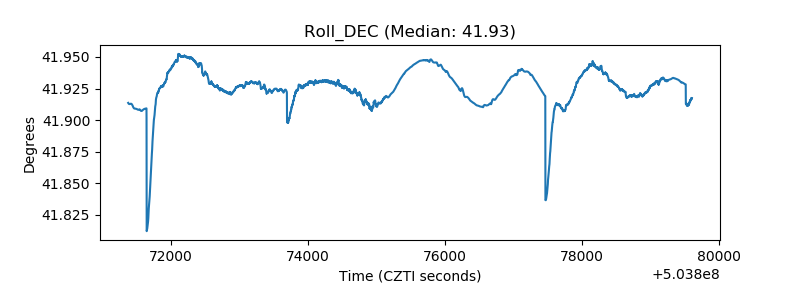 |
| _Roll_RA | 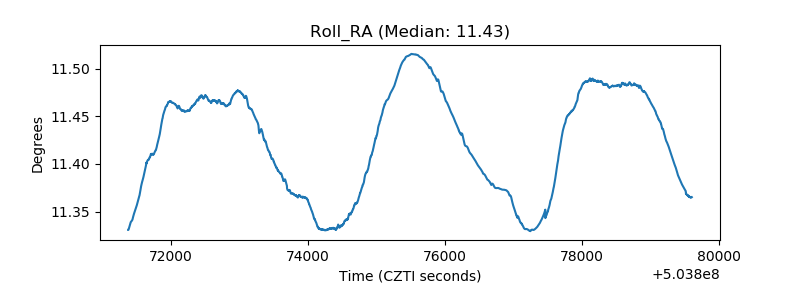 |
| Veto Counter | 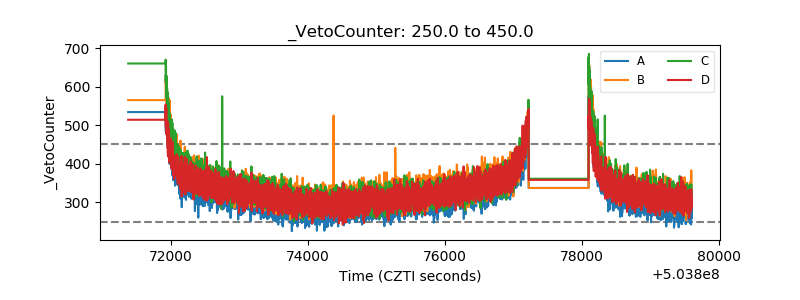 |