| Param | Original file | Final file |
|---|---|---|
| Filename | modeM0/AS1A14_009T01_9000006534_55333cztM0_level2.fits | modeM0/AS1A14_009T01_9000006534_55333cztM0_level2_quad_clean.evt |
| Size (bytes) | 507,006,720 | 102,003,840 |
| Size | 483.5 MB | 97.3 MB |
| Events in quadrant A | 4,651,858 | 652,166 |
| Events in quadrant B | 3,392,612 | 720,177 |
| Events in quadrant C | 6,063,149 | 603,792 |
| Events in quadrant D | 4,099,357 | 609,691 |
| Mode SS | |||
|---|---|---|---|
| Quadrant | BADHDUFLAG | Total packets | Discarded packets |
| A | 0 | 146 | 0 |
| B | 0 | 146 | 0 |
| C | 0 | 146 | 0 |
| D | 0 | 146 | 0 |
| Mode M0 | |||
|---|---|---|---|
| Quadrant | BADHDUFLAG | Total packets | Discarded packets |
| A | 0 | 19077 | 2 |
| B | 0 | 15681 | 2 |
| C | 0 | 23152 | 2 |
| D | 0 | 17344 | 2 |
| Mode M9 | |||
|---|---|---|---|
| Quadrant | BADHDUFLAG | Total packets | Discarded packets |
| A | 0 | 4 | 0 |
| B | 0 | 4 | 0 |
| C | 0 | 4 | 0 |
| D | 0 | 4 | 0 |
| Quadrant | Total seconds | Saturated seconds | Saturation percentage |
|---|---|---|---|
| A | 7220 | 336 | 4.653740% |
| B | 7220 | 70 | 0.969529% |
| C | 7221 | 589 | 8.156765% |
| D | 7221 | 102 | 1.412547% |
Noise dominated data is calculated using 1-second bins in cleaned event files. If a bin has >2000 counts, and if more than 50% of those come from <1% of pixels, then it is considered to be noise-dominated and hence unusable.
| Quadrant | # 1 sec bins | Bins with >0 counts | Bins with >2000 counts | High rate bins dominated by noise | Noise dominated (total time) | Noise dominated (detector-on time) | Marked lightcurve |
|---|---|---|---|---|---|---|---|
| A | 7650 | 7221 | 275 | 275 | 3.59% | 3.81% | 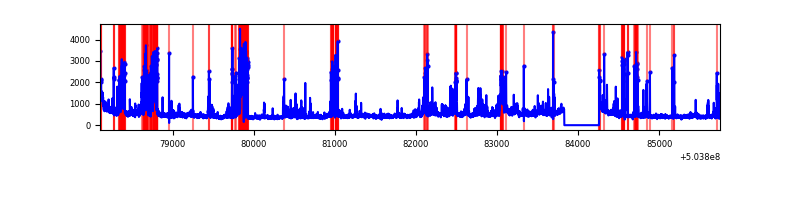 |
| B | 7650 | 7221 | 18 | 18 | 0.24% | 0.25% | 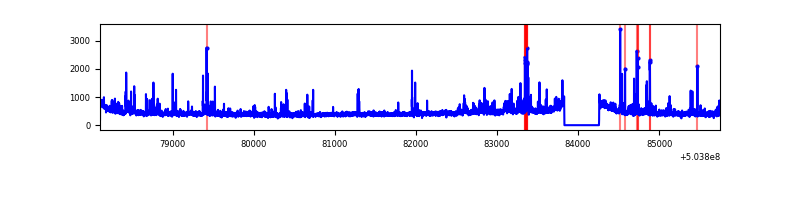 |
| C | 7651 | 7222 | 505 | 505 | 6.60% | 6.99% | 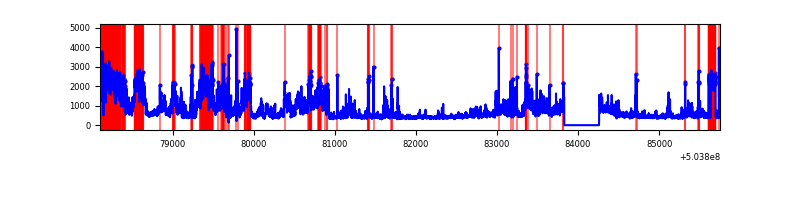 |
| D | 7651 | 7222 | 60 | 60 | 0.78% | 0.83% | 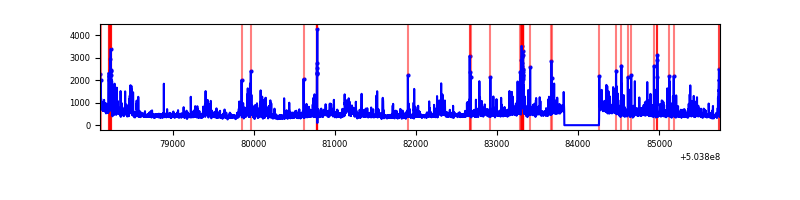 |
Top three noisy pixels from each quadrant. If the there are fewer than three noisy pixels in the level2.evt file, extra rows are filled as -1
| Pixel properties | Quadrant properties | ||||||
|---|---|---|---|---|---|---|---|
| Quadrant | DetID | PixID | Counts | Sigma | Mean | Median | Sigma |
| A | 0 | 8 | 958900 | 5258.22 | 739 | 721 | 182.2 |
| A | 3 | 78 | 426182 | 2334.81 | 739 | 721 | 182.2 |
| A | 3 | 14 | 296541 | 1623.38 | 739 | 721 | 182.2 |
| B | 0 | 199 | 177227 | 1090.79 | 751 | 723 | 161.8 |
| B | 7 | 252 | 105641 | 648.39 | 751 | 723 | 161.8 |
| B | 10 | 247 | 49117 | 299.07 | 751 | 723 | 161.8 |
| C | 9 | 38 | 2707640 | 13645.58 | 718 | 711 | 198.4 |
| C | 13 | 3 | 285239 | 1434.3 | 718 | 711 | 198.4 |
| C | 12 | 249 | 70173 | 350.16 | 718 | 711 | 198.4 |
| D | 11 | 129 | 272801 | 1311.15 | 735 | 702 | 207.5 |
| D | 6 | 239 | 172493 | 827.8 | 735 | 702 | 207.5 |
| D | 3 | 13 | 157725 | 756.64 | 735 | 702 | 207.5 |
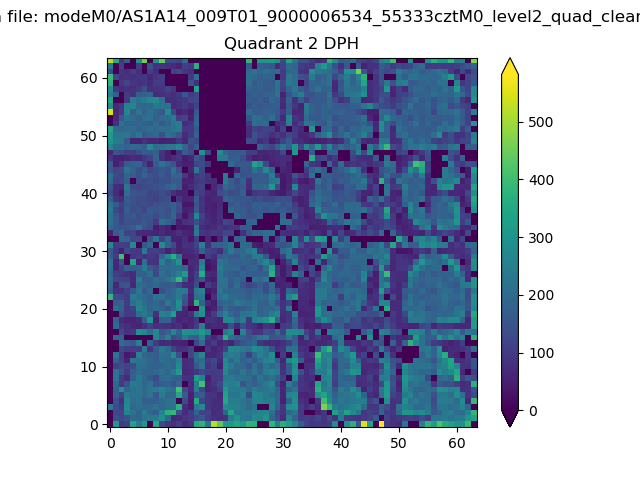
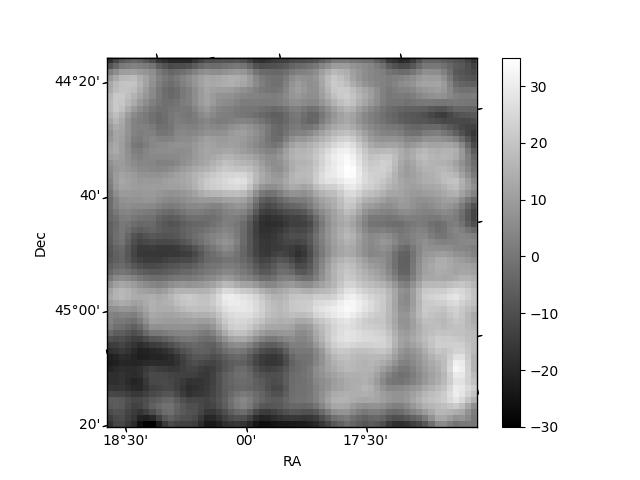
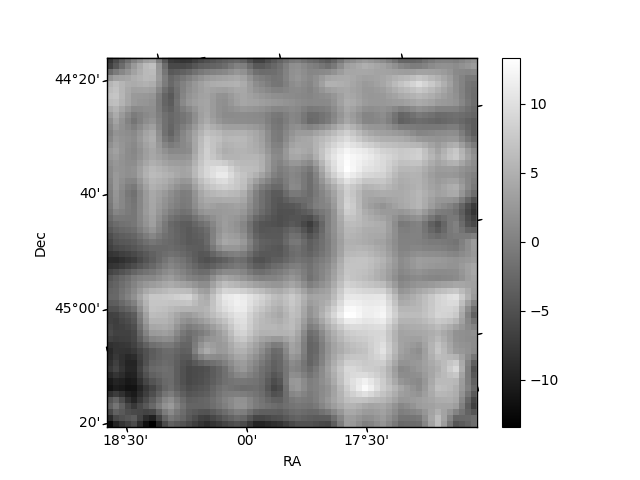
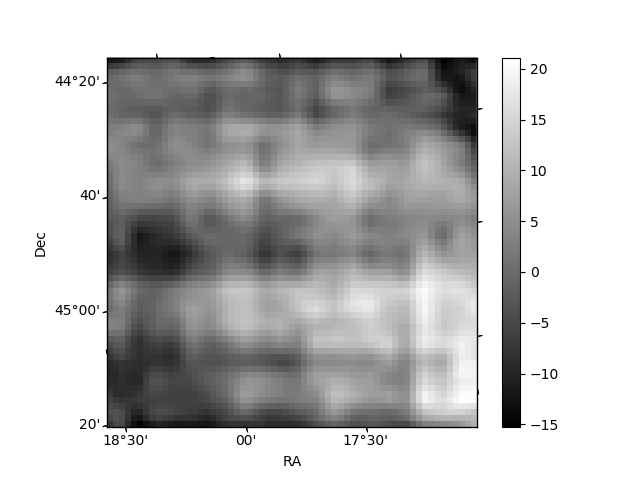
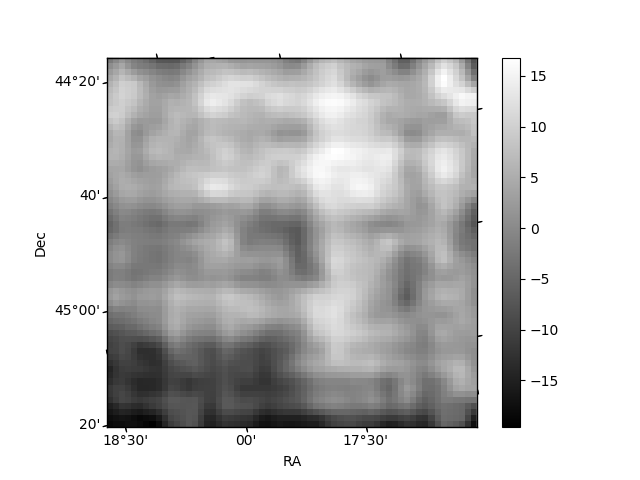
Histogram calculated using DETX and DETY for each event in the final _common_clean file
| Quadrant A | 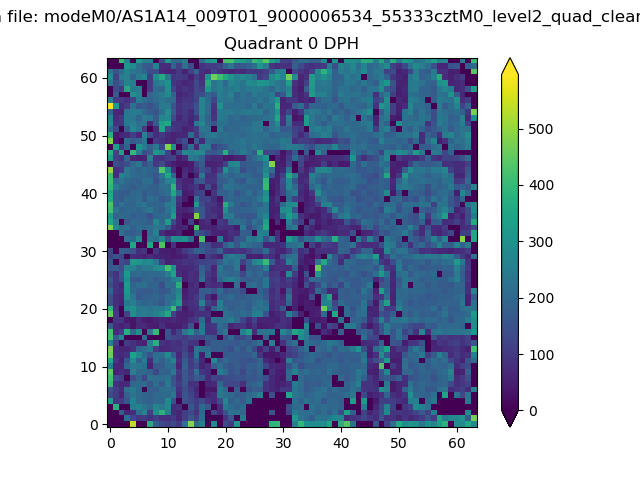 |
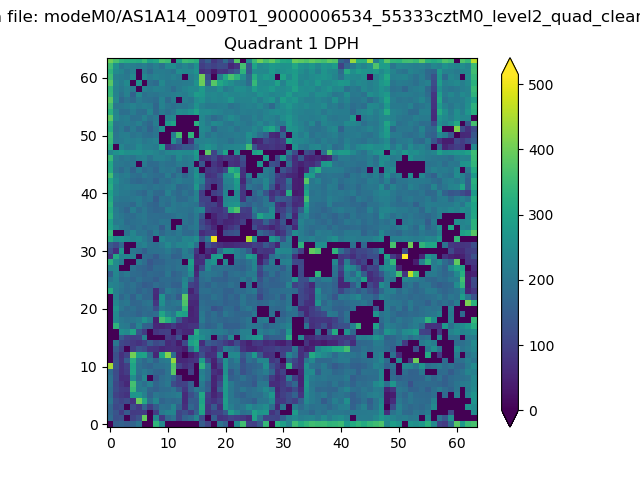 |
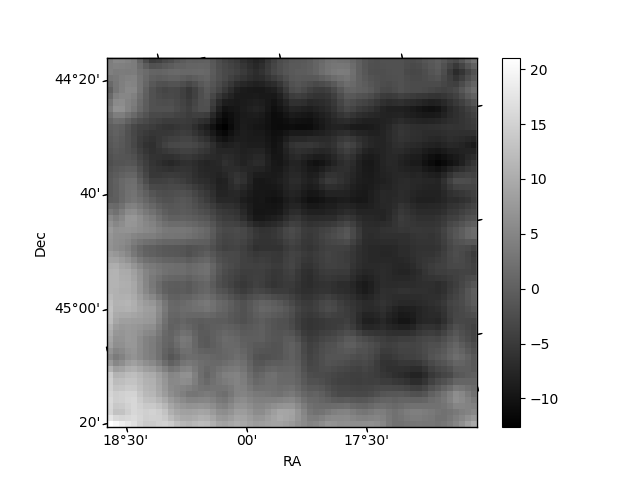
Quadrant B |
|---|---|---|---|
| Quadrant D | 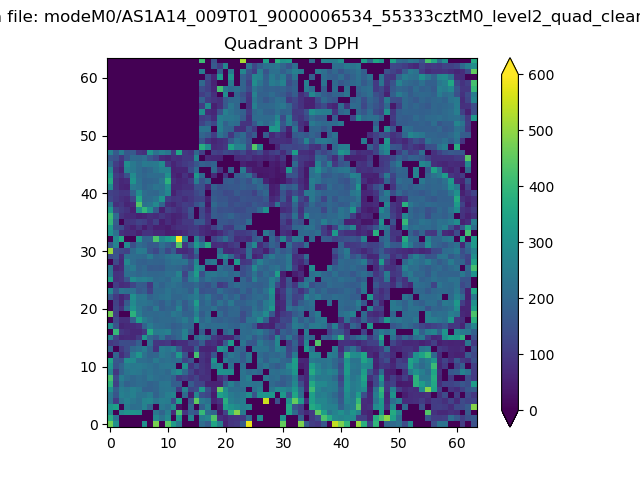 |
 |
Quadrant C |
| Plot type | Count rate plots | Images |
|---|---|---|
| Comparison with Poisson distribution Blue bars denote a histogram of data divided into 1 sec bins. Red curve is a Poisson curve with rate = median count rate of data. |
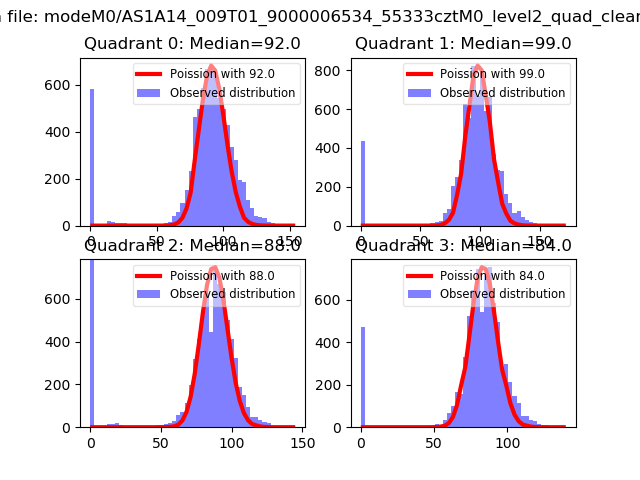 |
 |
| Quadrant-wise count rates Data is divided into 100 sec bins |
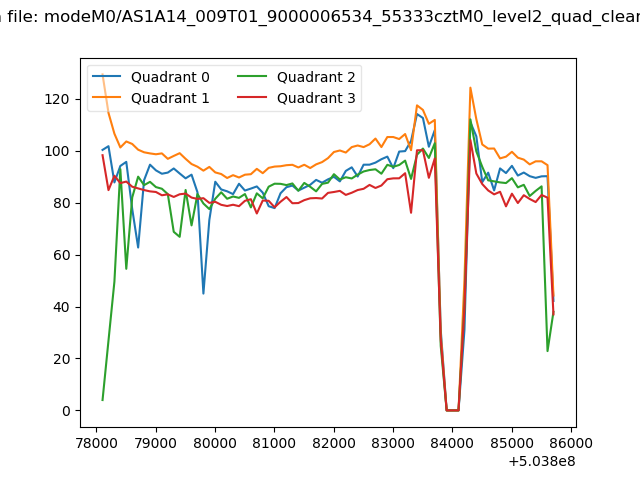 |
|
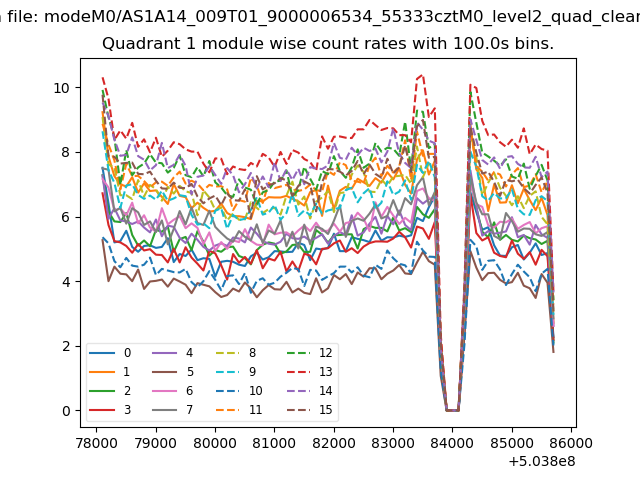
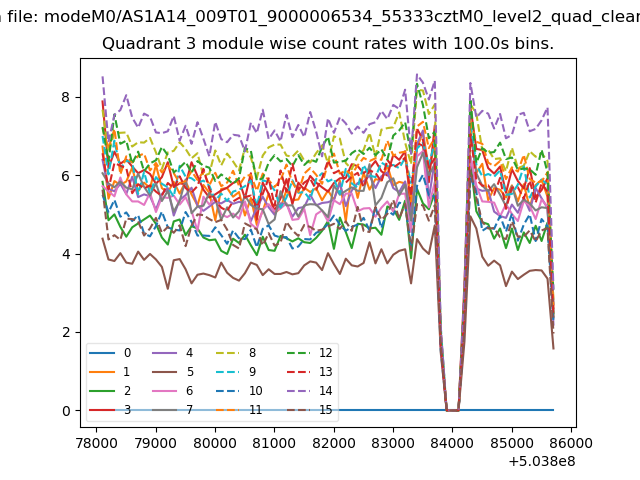
| Module-wise count rates for Quadrant A Data is divided into 100 sec bins |
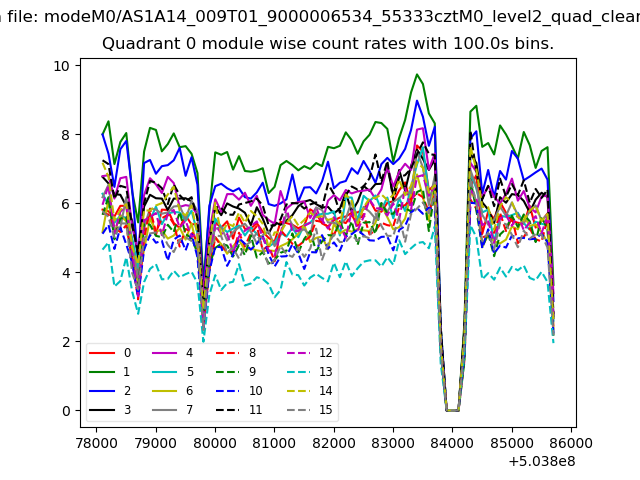 |
 |
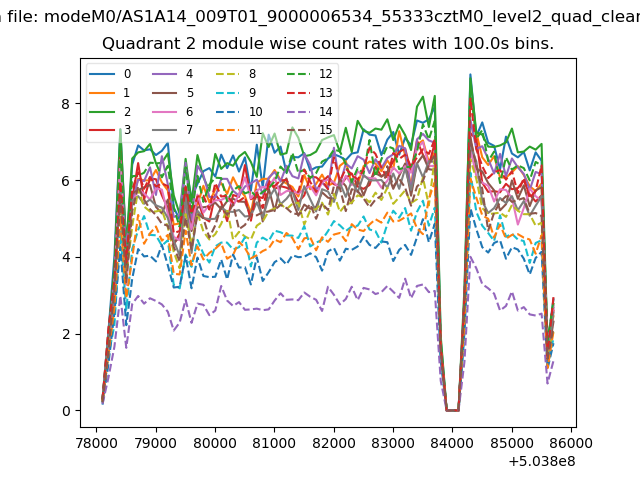
| Module-wise count rates for Quadrant B Data is divided into 100 sec bins |
 |
 |
| Module-wise count rates for Quadrant C Data is divided into 100 sec bins |
 |
 |
| Module-wise count rates for Quadrant D Data is divided into 100 sec bins |
 |
 |
| Parameter | Plot |
|---|---|
| CZT HV Monitor | 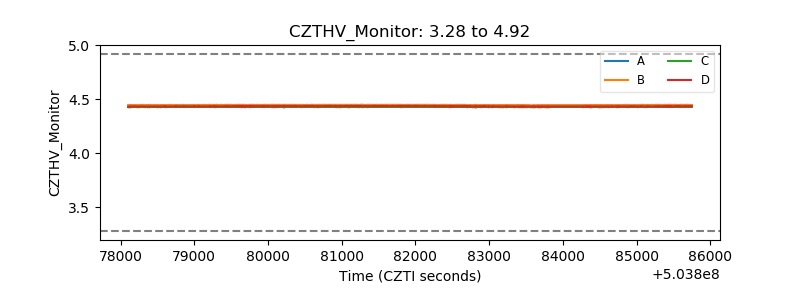 |
| D_VDD | 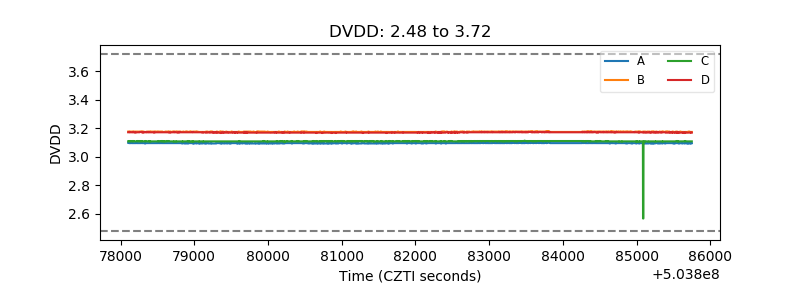 |
| Temperature 1 | 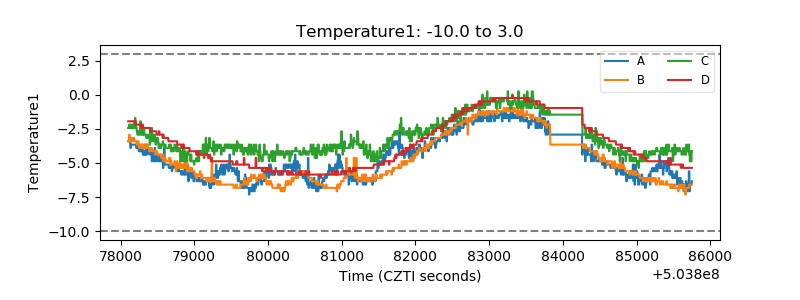 |
| Veto HV Monitor | 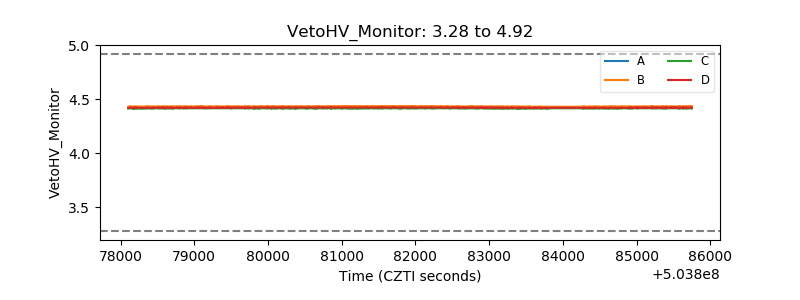 |
| Veto LLD | 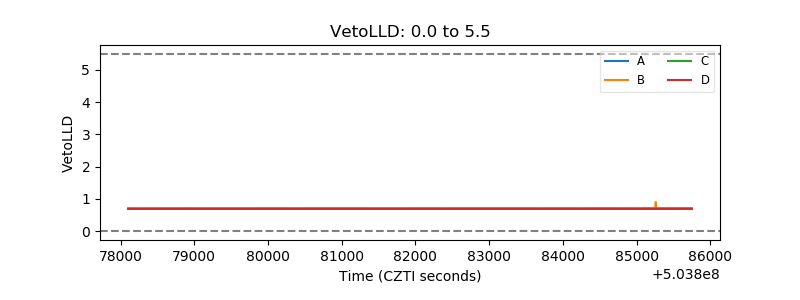 |
| Alpha Counter | 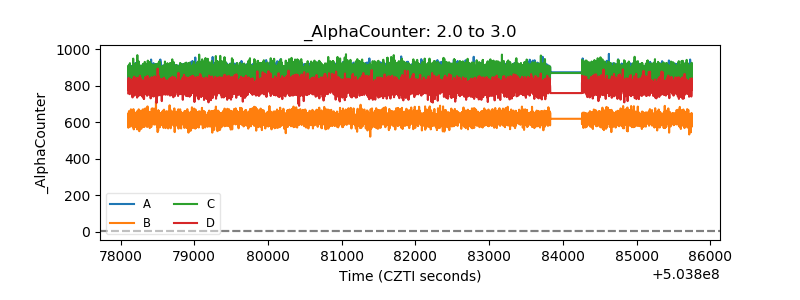 |
| _CPM_Rate | 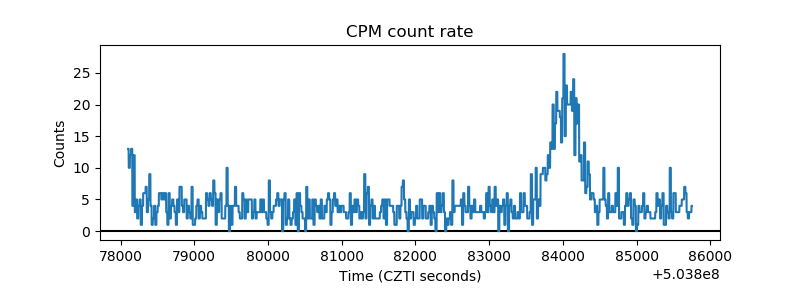 |
| CZT Counter | 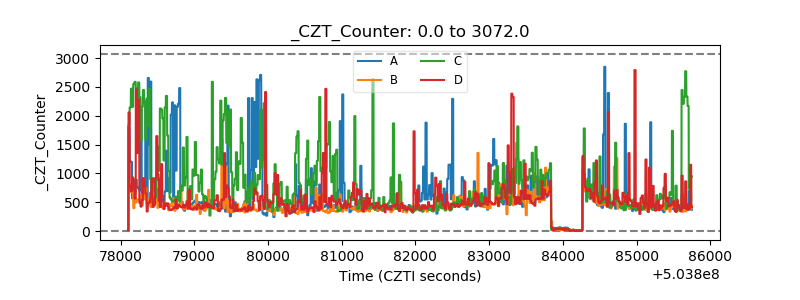 |
| +2.5 Volts monitor | 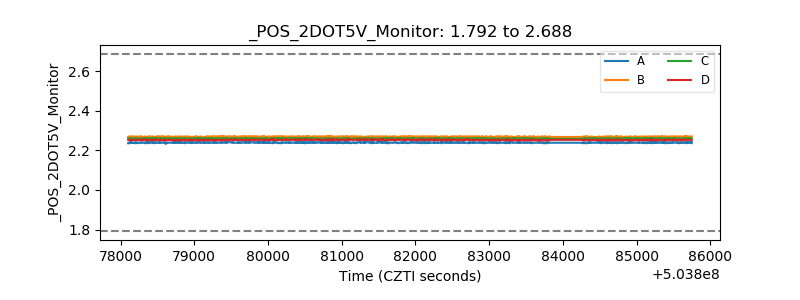 |
| +5 Volts monitor | 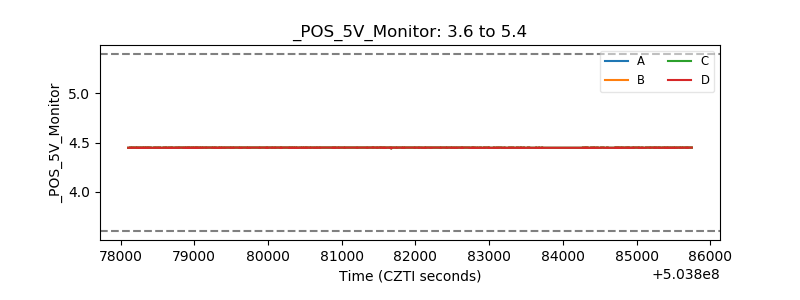 |
| _ROLL_ROT | 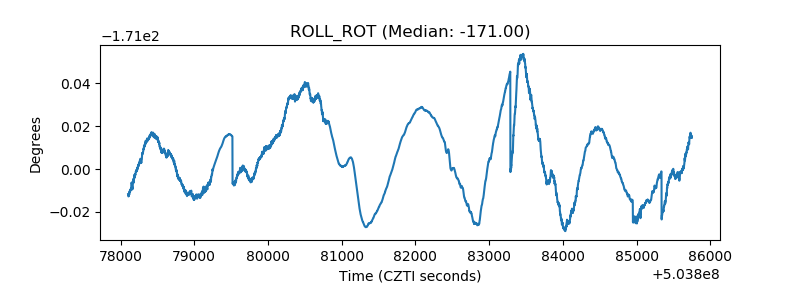 |
| _Roll_DEC | 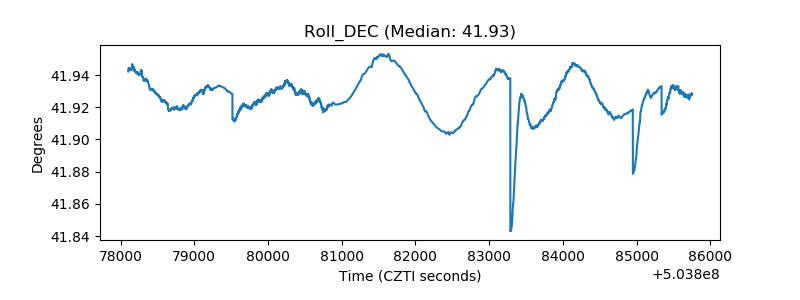 |
| _Roll_RA | 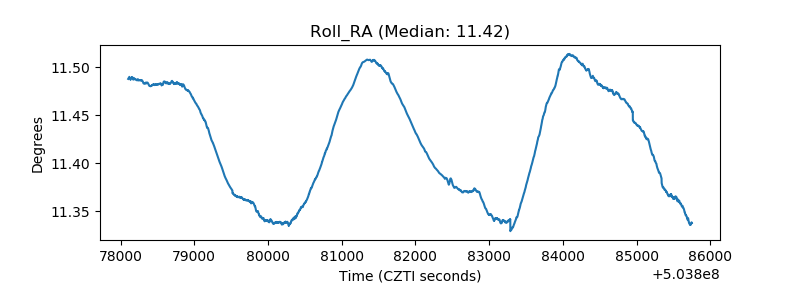 |
| Veto Counter | 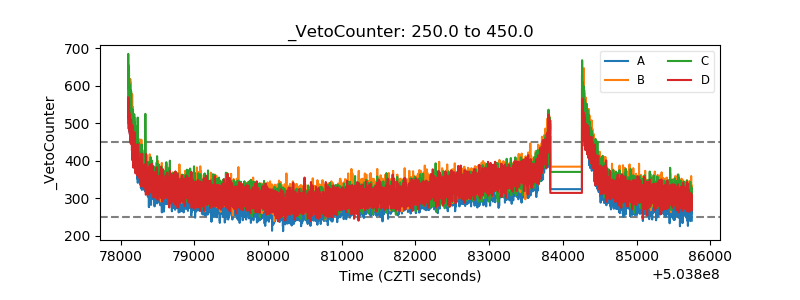 |