| Param | Original file | Final file |
|---|---|---|
| Filename | modeM0/AS1A14_009T01_9000006534_55335cztM0_level2.fits | modeM0/AS1A14_009T01_9000006534_55335cztM0_level2_quad_clean.evt |
| Size (bytes) | 517,190,400 | 126,046,080 |
| Size | 493.2 MB | 120.2 MB |
| Events in quadrant A | 4,433,380 | 813,671 |
| Events in quadrant B | 4,038,227 | 871,226 |
| Events in quadrant C | 5,033,696 | 781,312 |
| Events in quadrant D | 4,957,094 | 740,399 |
| Mode SS | |||
|---|---|---|---|
| Quadrant | BADHDUFLAG | Total packets | Discarded packets |
| A | 0 | 176 | 0 |
| B | 0 | 176 | 0 |
| C | 0 | 176 | 0 |
| D | 0 | 176 | 0 |
| Mode M0 | |||
|---|---|---|---|
| Quadrant | BADHDUFLAG | Total packets | Discarded packets |
| A | 0 | 19789 | 0 |
| B | 0 | 18769 | 0 |
| C | 0 | 21181 | 0 |
| D | 0 | 20982 | 0 |
| Quadrant | Total seconds | Saturated seconds | Saturation percentage |
|---|---|---|---|
| A | 8787 | 31 | 0.352794% |
| B | 8787 | 48 | 0.546262% |
| C | 8788 | 117 | 1.331361% |
| D | 8788 | 82 | 0.933091% |
Noise dominated data is calculated using 1-second bins in cleaned event files. If a bin has >2000 counts, and if more than 50% of those come from <1% of pixels, then it is considered to be noise-dominated and hence unusable.
| Quadrant | # 1 sec bins | Bins with >0 counts | Bins with >2000 counts | High rate bins dominated by noise | Noise dominated (total time) | Noise dominated (detector-on time) | Marked lightcurve |
|---|---|---|---|---|---|---|---|
| A | 8787 | 8787 | 12 | 12 | 0.14% | 0.14% | 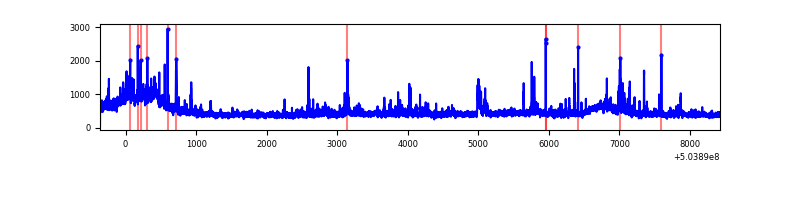 |
| B | 8787 | 8787 | 16 | 16 | 0.18% | 0.18% | 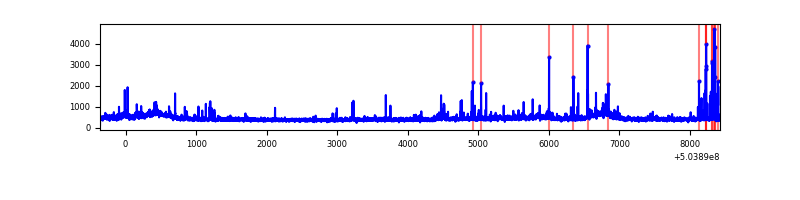 |
| C | 8788 | 8788 | 63 | 63 | 0.72% | 0.72% | 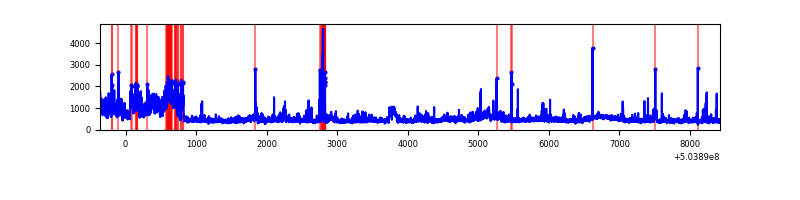 |
| D | 8788 | 8788 | 65 | 65 | 0.74% | 0.74% | 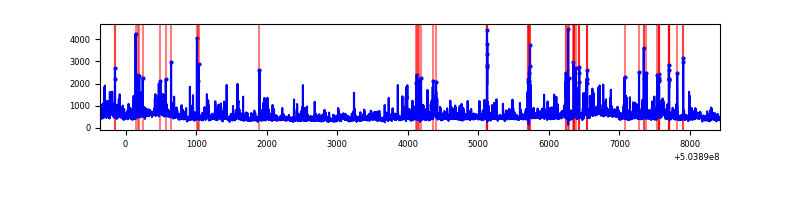 |
Top three noisy pixels from each quadrant. If the there are fewer than three noisy pixels in the level2.evt file, extra rows are filled as -1
| Pixel properties | Quadrant properties | ||||||
|---|---|---|---|---|---|---|---|
| Quadrant | DetID | PixID | Counts | Sigma | Mean | Median | Sigma |
| A | 12 | 115 | 337880 | 1465.57 | 932 | 907 | 229.9 |
| A | 3 | 78 | 233446 | 1011.36 | 932 | 907 | 229.9 |
| A | 3 | 14 | 73065 | 313.83 | 932 | 907 | 229.9 |
| B | 0 | 199 | 155142 | 773.15 | 927 | 893 | 199.5 |
| B | 10 | 247 | 140367 | 699.09 | 927 | 893 | 199.5 |
| B | 5 | 185 | 37785 | 184.91 | 927 | 893 | 199.5 |
| C | 9 | 38 | 1042455 | 4140.27 | 918 | 909 | 251.6 |
| C | 13 | 3 | 159766 | 631.48 | 918 | 909 | 251.6 |
| C | 12 | 252 | 70161 | 275.29 | 918 | 909 | 251.6 |
| D | 11 | 129 | 308054 | 1197.55 | 911 | 871 | 256.5 |
| D | 3 | 12 | 196559 | 762.89 | 911 | 871 | 256.5 |
| D | 7 | 96 | 188624 | 731.96 | 911 | 871 | 256.5 |
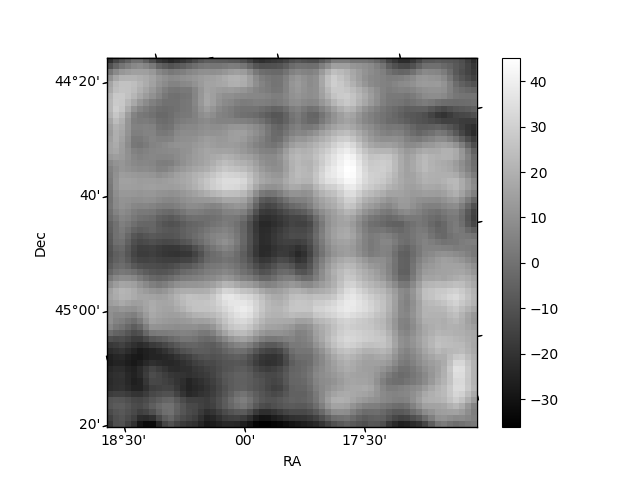
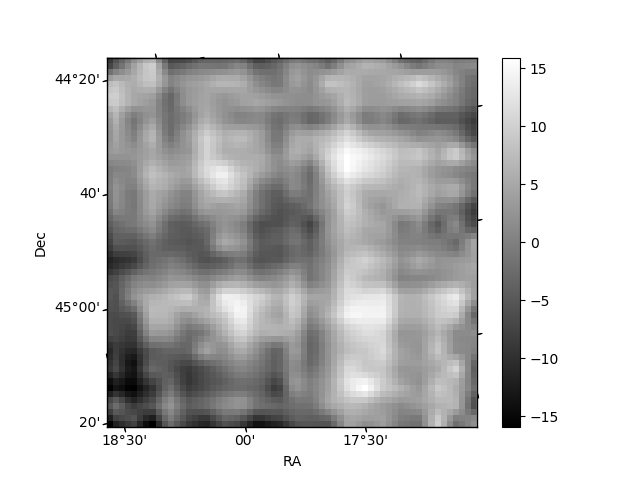
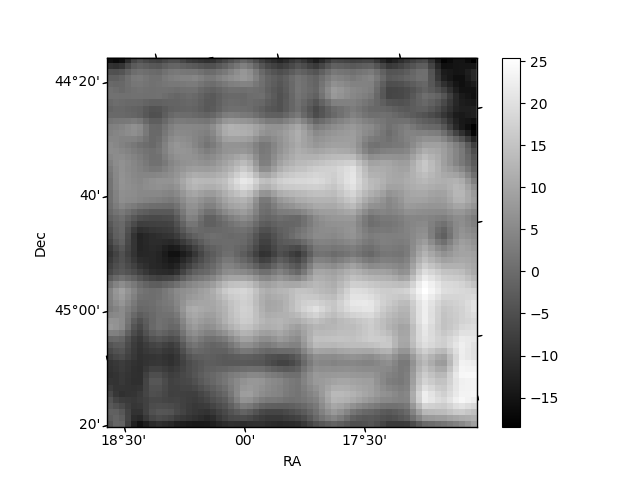
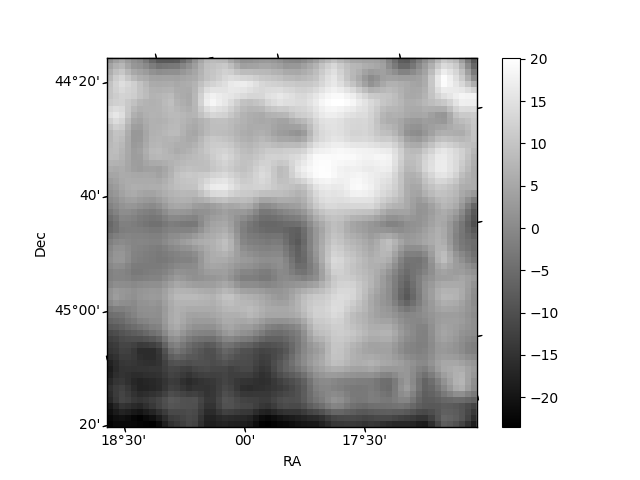
Histogram calculated using DETX and DETY for each event in the final _common_clean file
| Quadrant A | 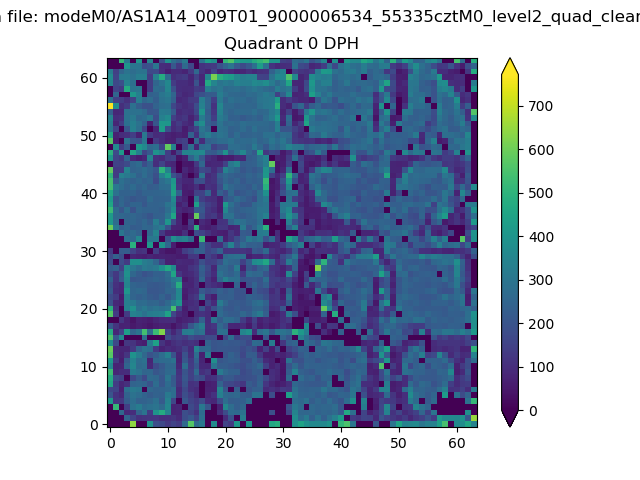 |
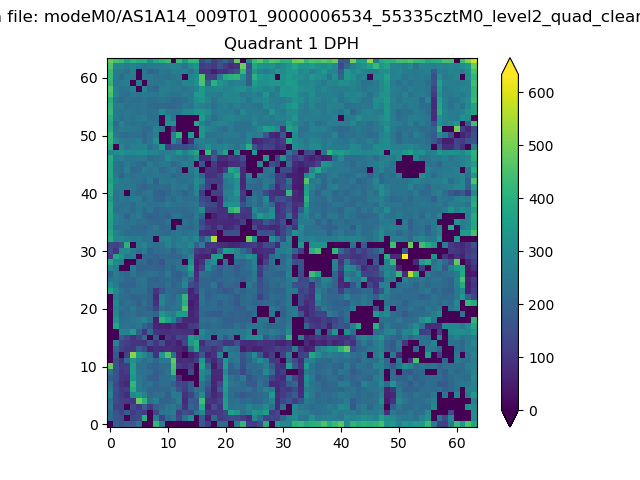 |
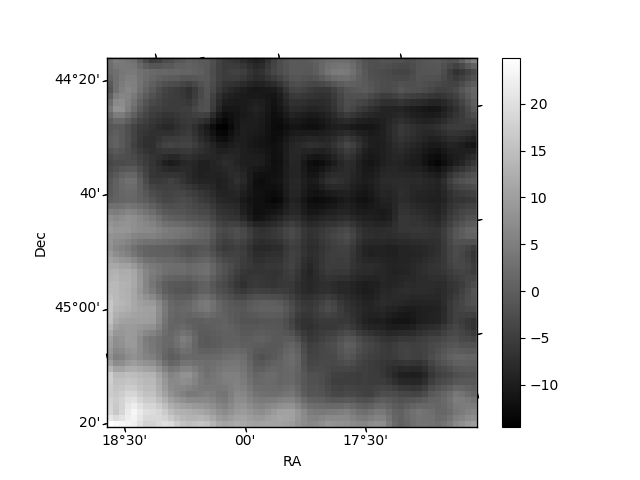
Quadrant B |
|---|---|---|---|
| Quadrant D | 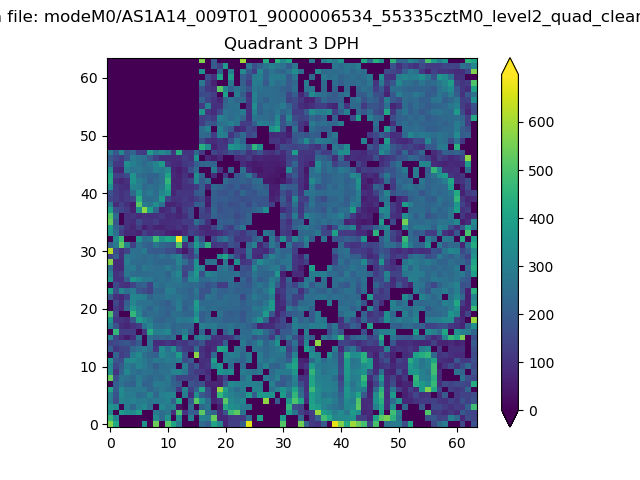 |
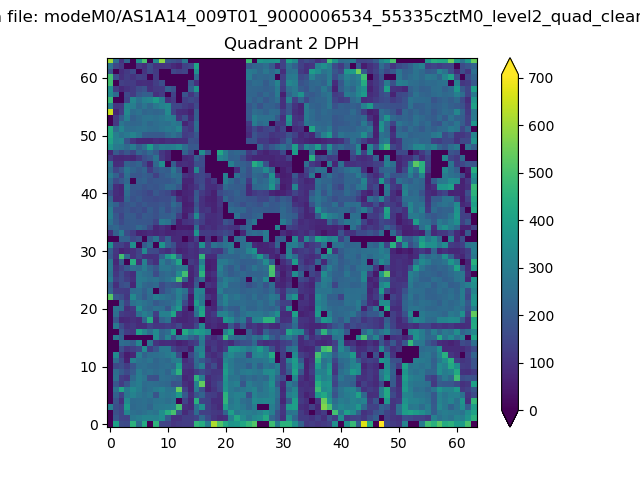 |
Quadrant C |
| Plot type | Count rate plots | Images |
|---|---|---|
| Comparison with Poisson distribution Blue bars denote a histogram of data divided into 1 sec bins. Red curve is a Poisson curve with rate = median count rate of data. |
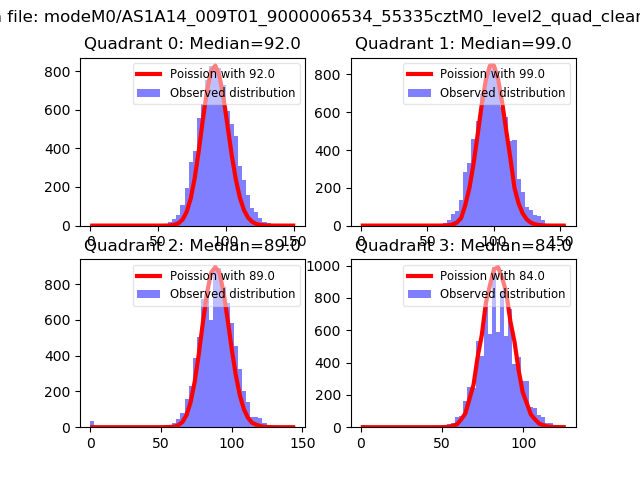 |
 |
| Quadrant-wise count rates Data is divided into 100 sec bins |
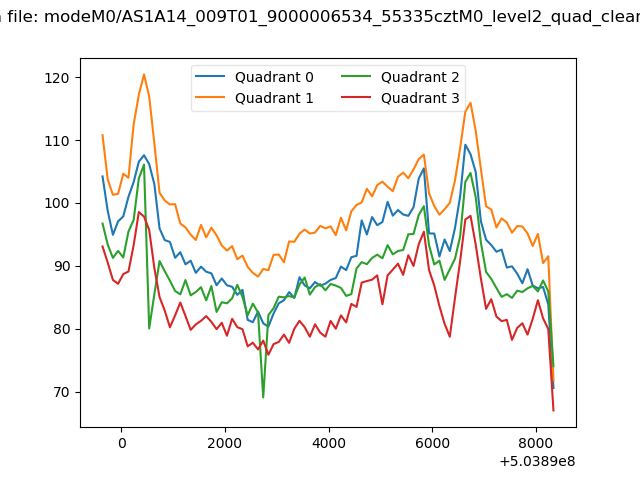 |
|
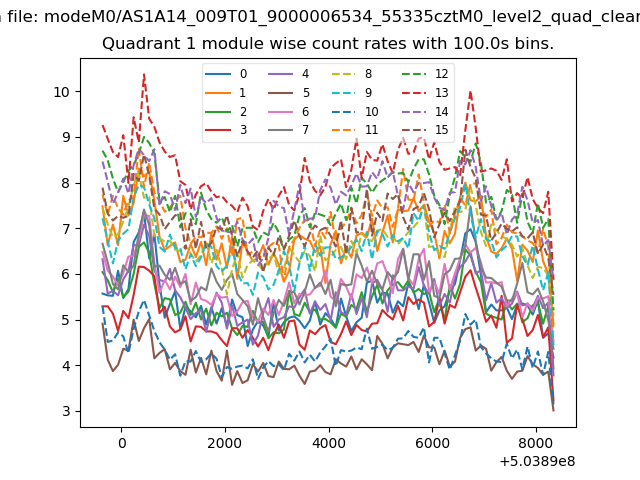
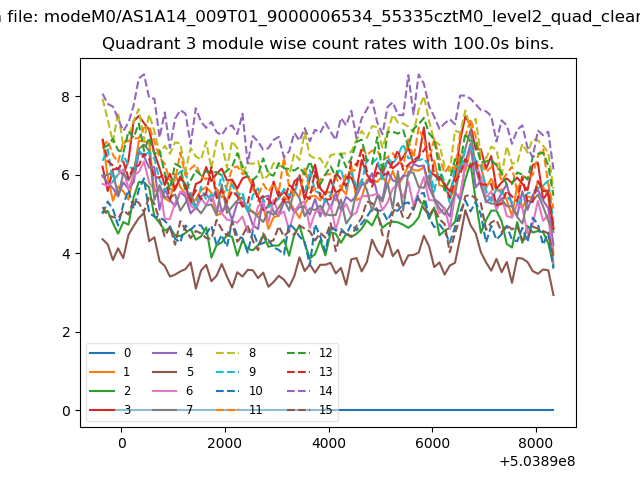
| Module-wise count rates for Quadrant A Data is divided into 100 sec bins |
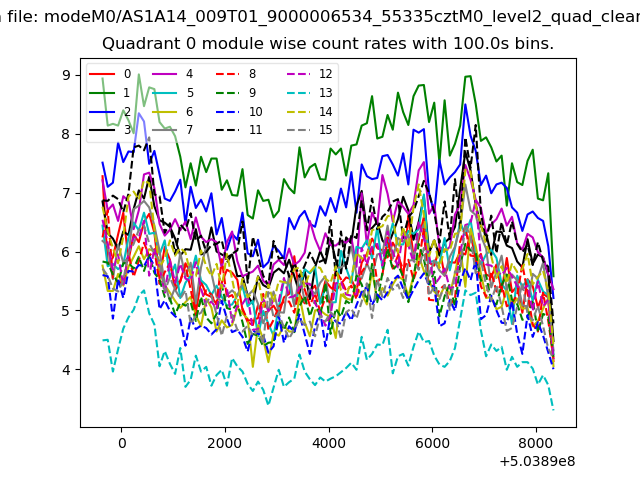 |
 |
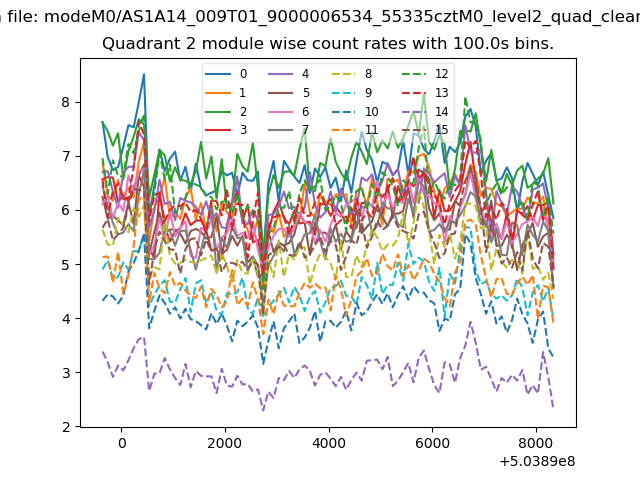
| Module-wise count rates for Quadrant B Data is divided into 100 sec bins |
 |
 |
| Module-wise count rates for Quadrant C Data is divided into 100 sec bins |
 |
 |
| Module-wise count rates for Quadrant D Data is divided into 100 sec bins |
 |
 |
| Parameter | Plot |
|---|---|
| CZT HV Monitor | 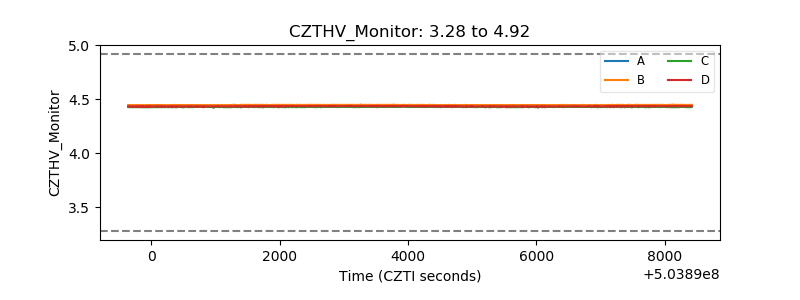 |
| D_VDD | 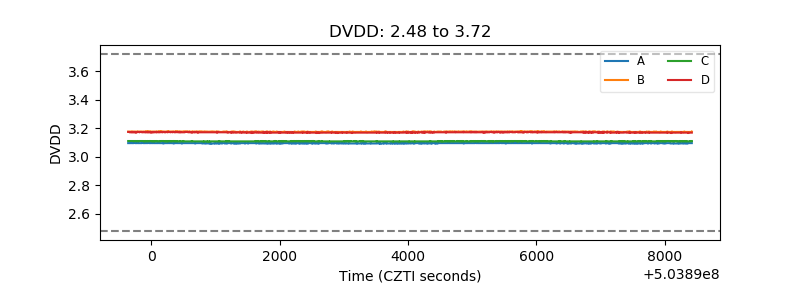 |
| Temperature 1 | 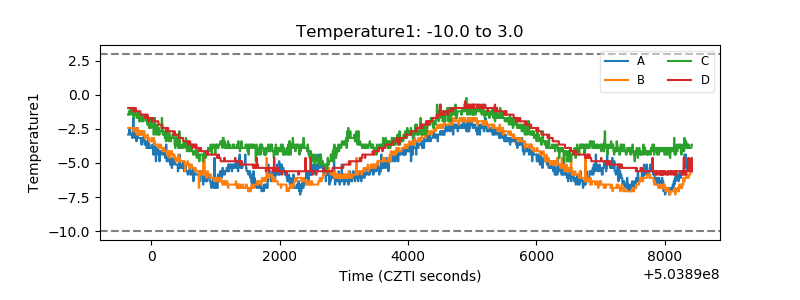 |
| Veto HV Monitor | 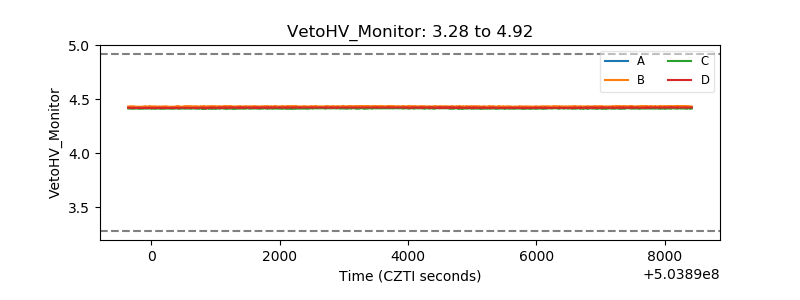 |
| Veto LLD | 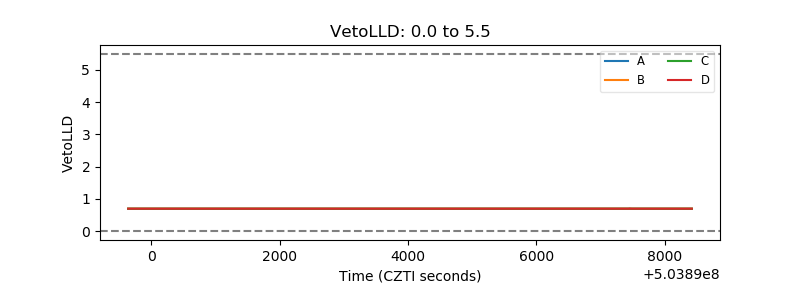 |
| Alpha Counter | 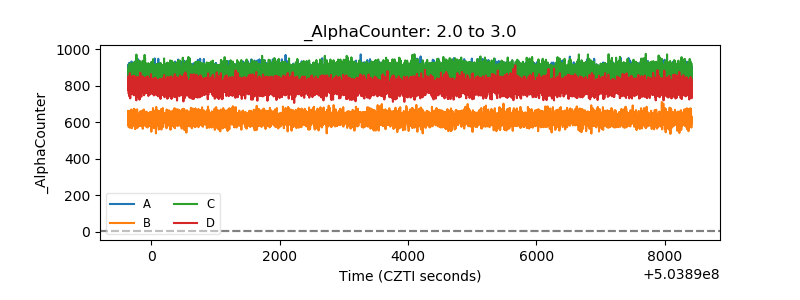 |
| _CPM_Rate | 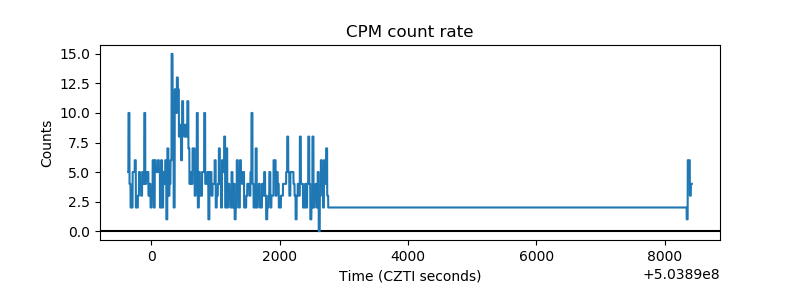 |
| CZT Counter | 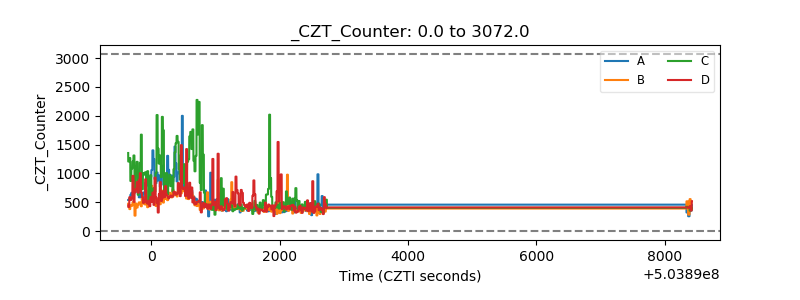 |
| +2.5 Volts monitor |  |
| +5 Volts monitor | 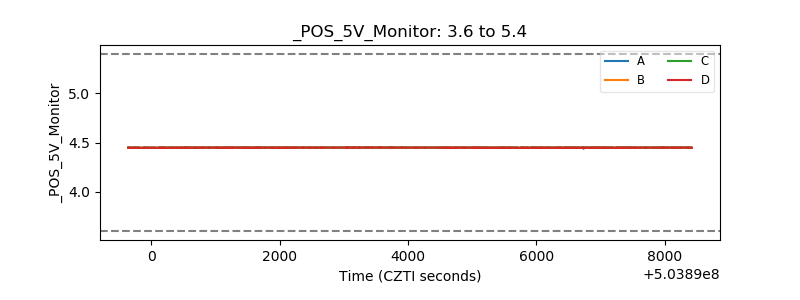 |
| _ROLL_ROT | 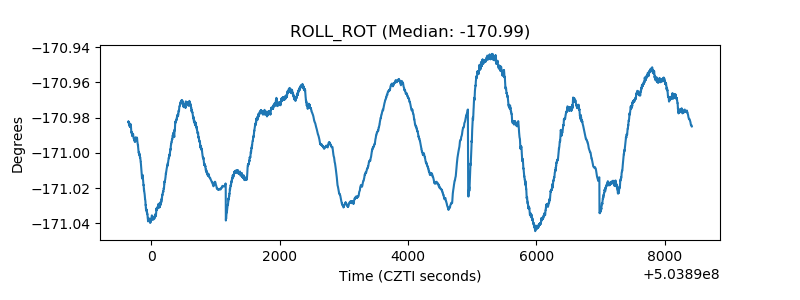 |
| _Roll_DEC | 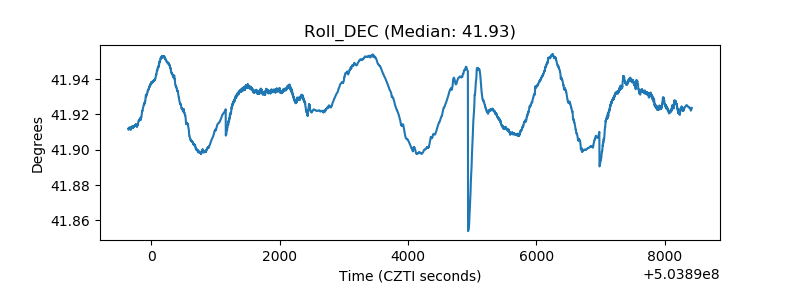 |
| _Roll_RA | 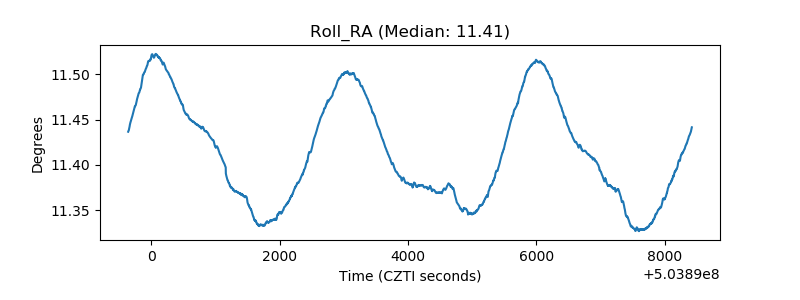 |
| Veto Counter | 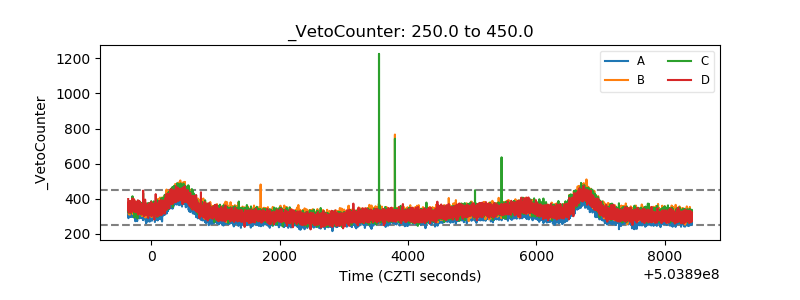 |