| Param | Original file | Final file |
|---|---|---|
| Filename | modeM0/AS1A14_009T01_9000006534_55339cztM0_level2.fits | modeM0/AS1A14_009T01_9000006534_55339cztM0_level2_quad_clean.evt |
| Size (bytes) | 469,120,320 | 98,328,960 |
| Size | 447.4 MB | 93.8 MB |
| Events in quadrant A | 3,624,044 | 636,342 |
| Events in quadrant B | 3,253,061 | 690,444 |
| Events in quadrant C | 5,529,176 | 586,172 |
| Events in quadrant D | 4,410,650 | 572,956 |
| Mode SS | |||
|---|---|---|---|
| Quadrant | BADHDUFLAG | Total packets | Discarded packets |
| A | 0 | 146 | 0 |
| B | 0 | 146 | 0 |
| C | 0 | 146 | 0 |
| D | 0 | 146 | 0 |
| Mode M0 | |||
|---|---|---|---|
| Quadrant | BADHDUFLAG | Total packets | Discarded packets |
| A | 0 | 16086 | 2 |
| B | 0 | 14846 | 2 |
| C | 0 | 21333 | 2 |
| D | 0 | 17951 | 2 |
| Mode M9 | |||
|---|---|---|---|
| Quadrant | BADHDUFLAG | Total packets | Discarded packets |
| A | 0 | 13 | 0 |
| B | 0 | 13 | 0 |
| C | 0 | 13 | 0 |
| D | 0 | 13 | 0 |
| Quadrant | Total seconds | Saturated seconds | Saturation percentage |
|---|---|---|---|
| A | 7050 | 210 | 2.978723% |
| B | 7050 | 150 | 2.127660% |
| C | 7051 | 563 | 7.984683% |
| D | 7051 | 318 | 4.509999% |
Noise dominated data is calculated using 1-second bins in cleaned event files. If a bin has >2000 counts, and if more than 50% of those come from <1% of pixels, then it is considered to be noise-dominated and hence unusable.
| Quadrant | # 1 sec bins | Bins with >0 counts | Bins with >2000 counts | High rate bins dominated by noise | Noise dominated (total time) | Noise dominated (detector-on time) | Marked lightcurve |
|---|---|---|---|---|---|---|---|
| A | 8410 | 7052 | 55 | 55 | 0.65% | 0.78% | 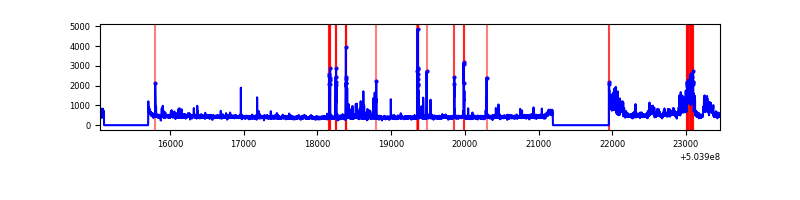 |
| B | 8410 | 7052 | 5 | 5 | 0.06% | 0.07% | 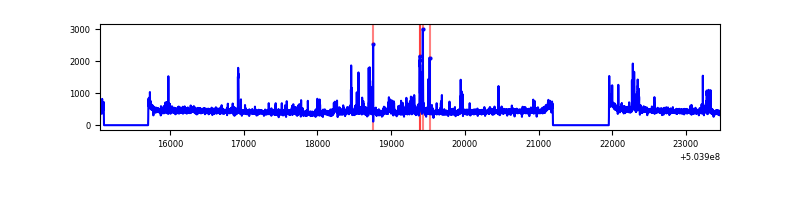 |
| C | 8411 | 7053 | 438 | 438 | 5.21% | 6.21% | 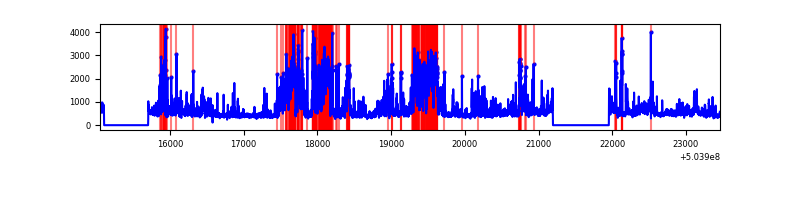 |
| D | 8411 | 7053 | 203 | 203 | 2.41% | 2.88% |  |
Top three noisy pixels from each quadrant. If the there are fewer than three noisy pixels in the level2.evt file, extra rows are filled as -1
| Pixel properties | Quadrant properties | ||||||
|---|---|---|---|---|---|---|---|
| Quadrant | DetID | PixID | Counts | Sigma | Mean | Median | Sigma |
| A | 12 | 115 | 411452 | 2233.87 | 747 | 728 | 183.9 |
| A | 0 | 8 | 156909 | 849.45 | 747 | 728 | 183.9 |
| A | 3 | 78 | 52762 | 283.01 | 747 | 728 | 183.9 |
| B | 0 | 199 | 108156 | 676.78 | 738 | 712 | 158.8 |
| B | 10 | 247 | 81528 | 509.05 | 738 | 712 | 158.8 |
| B | 5 | 185 | 52123 | 323.83 | 738 | 712 | 158.8 |
| C | 9 | 38 | 2145617 | 11061.34 | 711 | 706 | 193.9 |
| C | 13 | 3 | 216919 | 1115.01 | 711 | 706 | 193.9 |
| C | 12 | 252 | 166937 | 857.26 | 711 | 706 | 193.9 |
| D | 12 | 18 | 516418 | 2543.7 | 721 | 692 | 202.7 |
| D | 11 | 129 | 395610 | 1947.84 | 721 | 692 | 202.7 |
| D | 7 | 70 | 197145 | 968.96 | 721 | 692 | 202.7 |
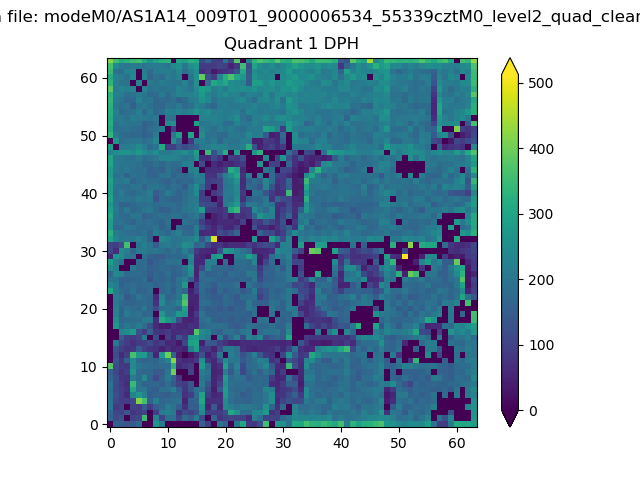
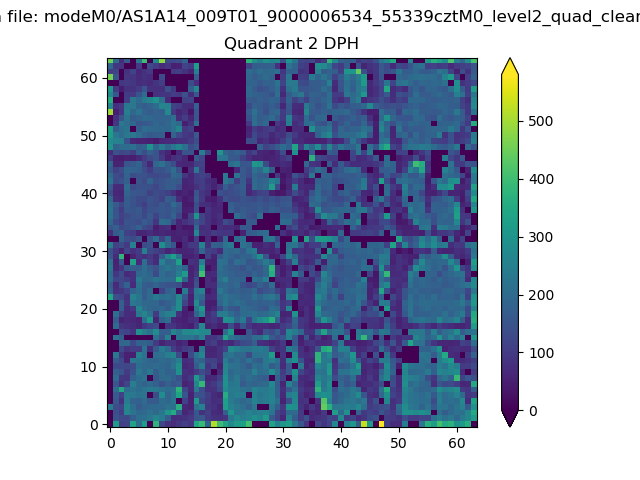
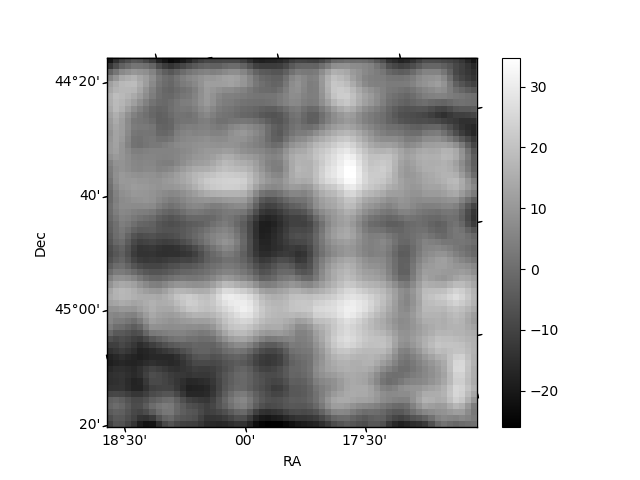
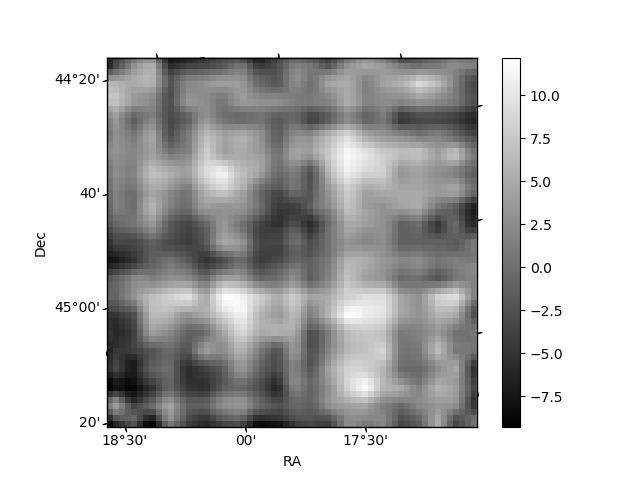
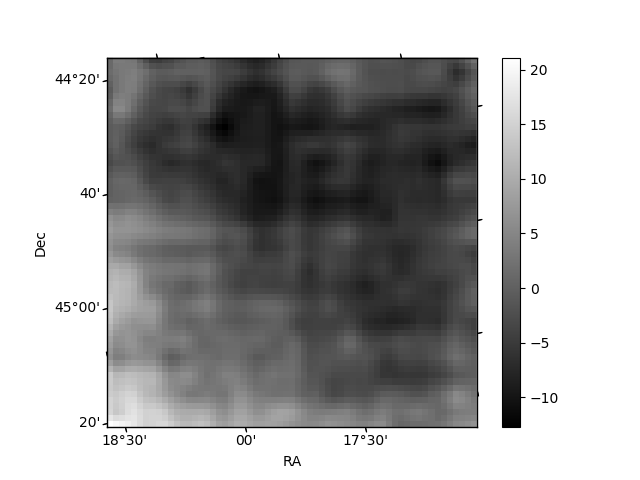
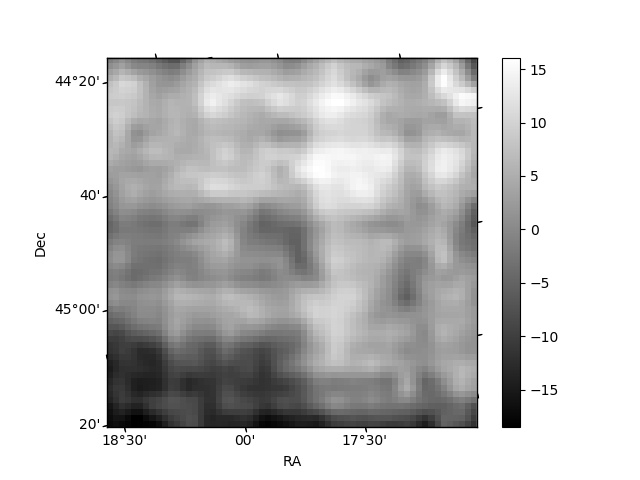
Histogram calculated using DETX and DETY for each event in the final _common_clean file
| Quadrant A | 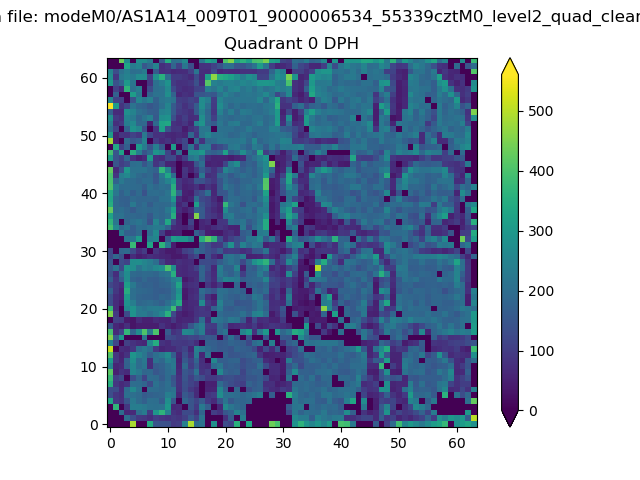 |
 |
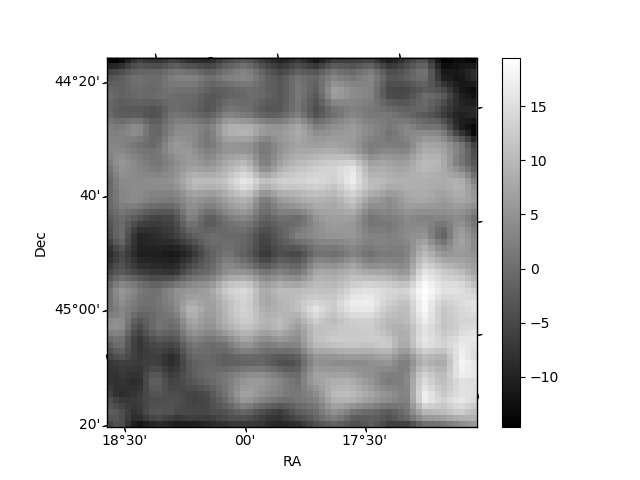
Quadrant B |
|---|---|---|---|
| Quadrant D | 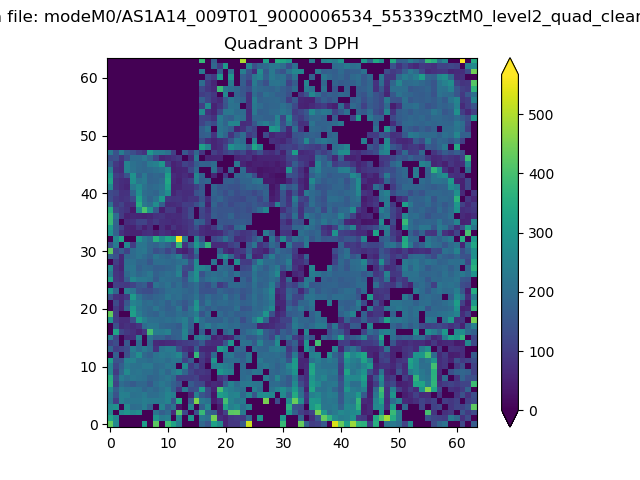 |
 |
Quadrant C |
| Plot type | Count rate plots | Images |
|---|---|---|
| Comparison with Poisson distribution Blue bars denote a histogram of data divided into 1 sec bins. Red curve is a Poisson curve with rate = median count rate of data. |
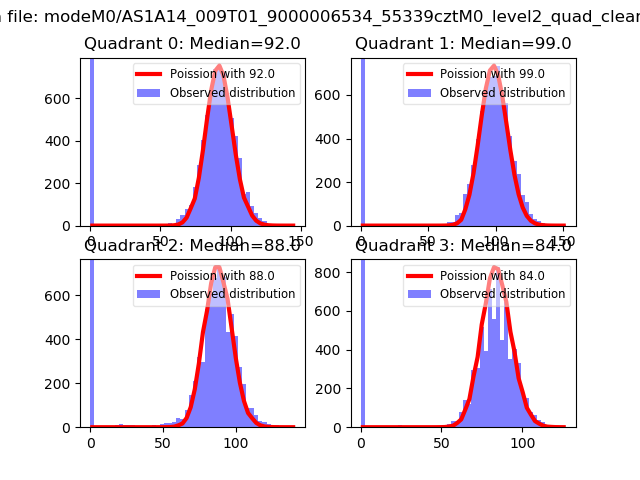 |
 |
| Quadrant-wise count rates Data is divided into 100 sec bins |
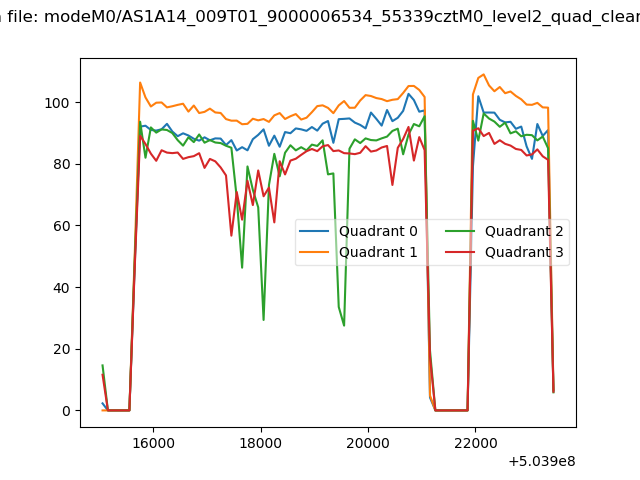 |
|
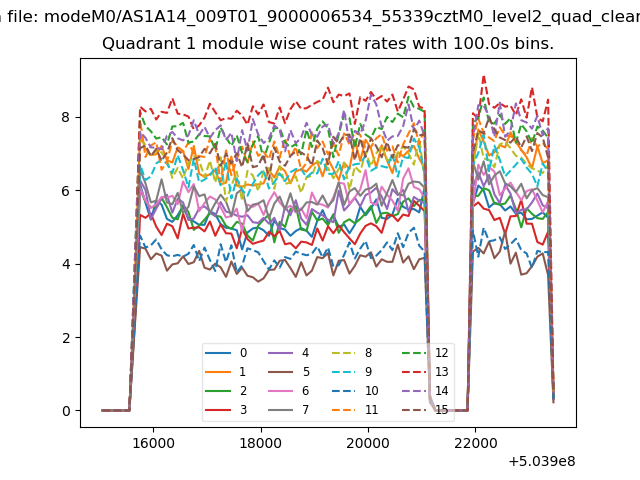
| Module-wise count rates for Quadrant A Data is divided into 100 sec bins |
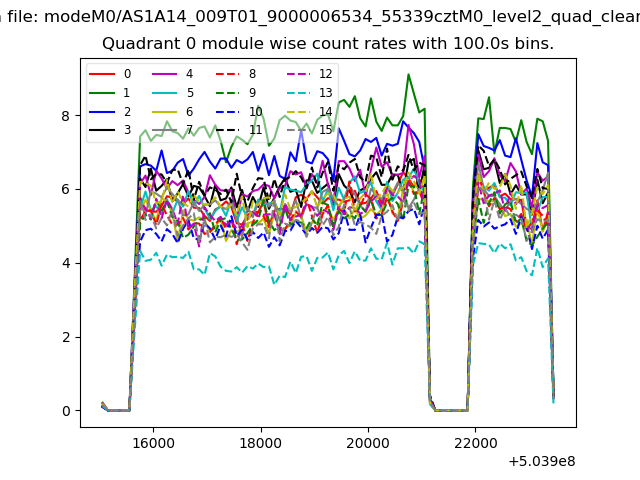 |
 |
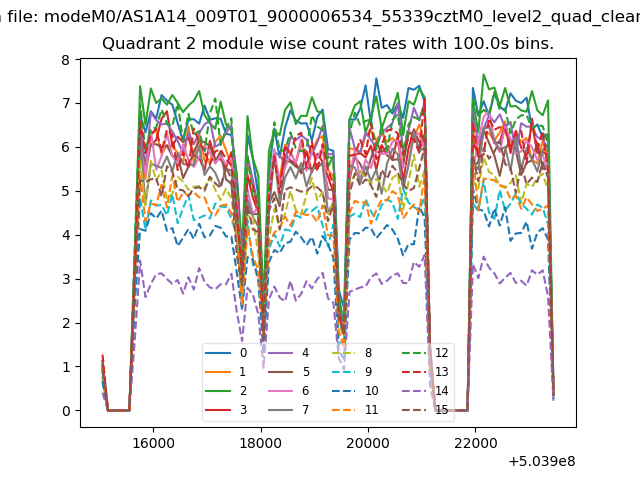
| Module-wise count rates for Quadrant B Data is divided into 100 sec bins |
 |
 |
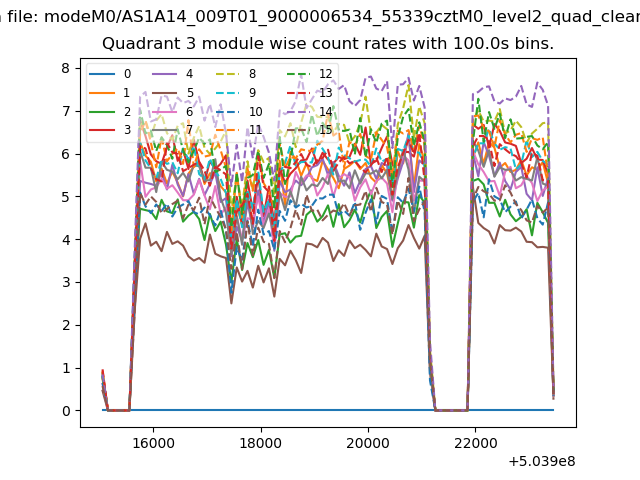
| Module-wise count rates for Quadrant C Data is divided into 100 sec bins |
 |
 |
| Module-wise count rates for Quadrant D Data is divided into 100 sec bins |
 |
 |
| Parameter | Plot |
|---|---|
| CZT HV Monitor | 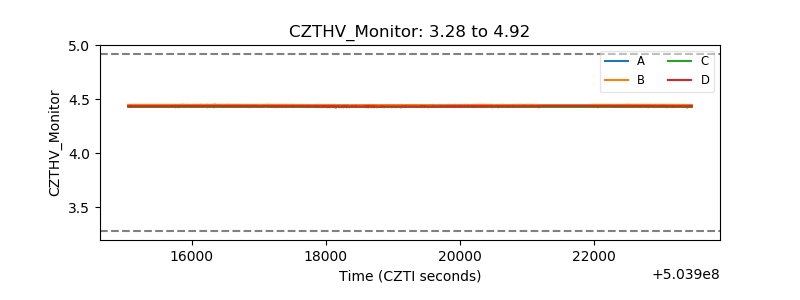 |
| D_VDD | 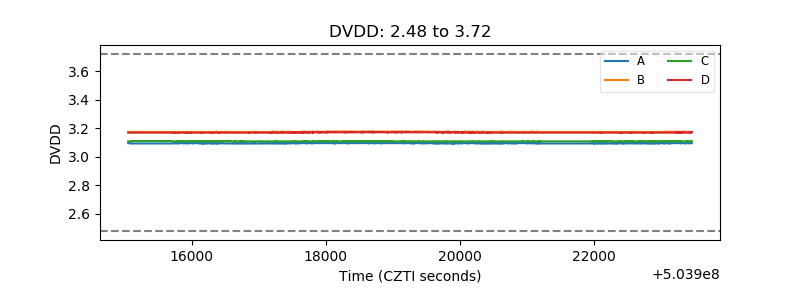 |
| Temperature 1 | 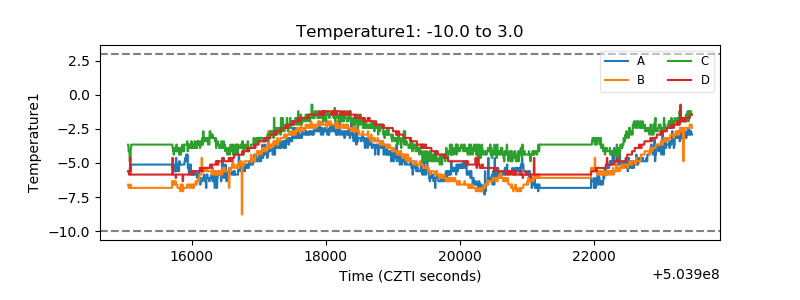 |
| Veto HV Monitor | 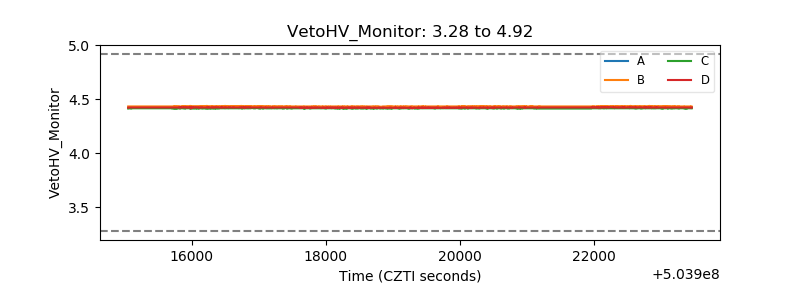 |
| Veto LLD | 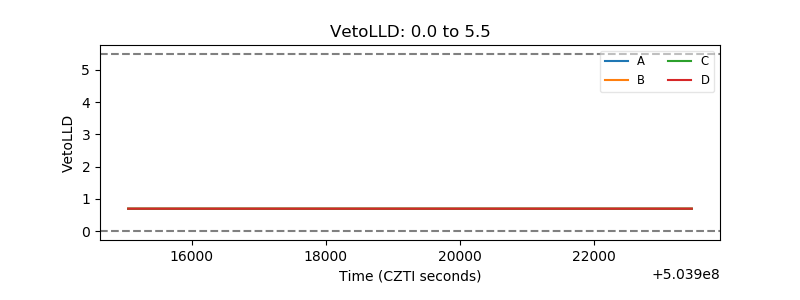 |
| Alpha Counter | 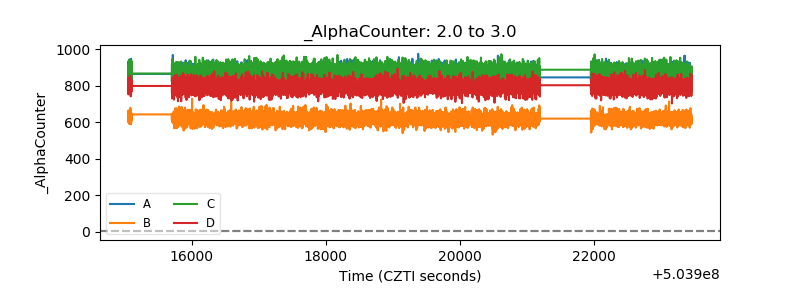 |
| _CPM_Rate | 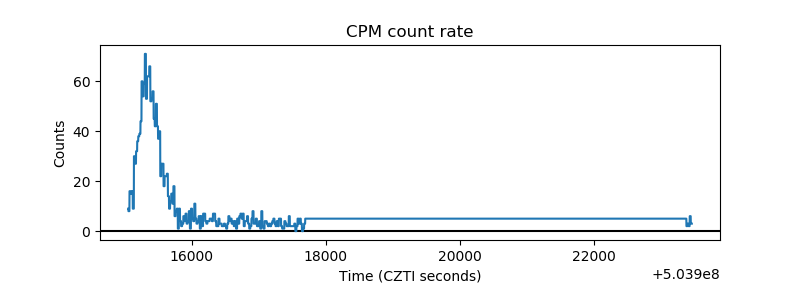 |
| CZT Counter | 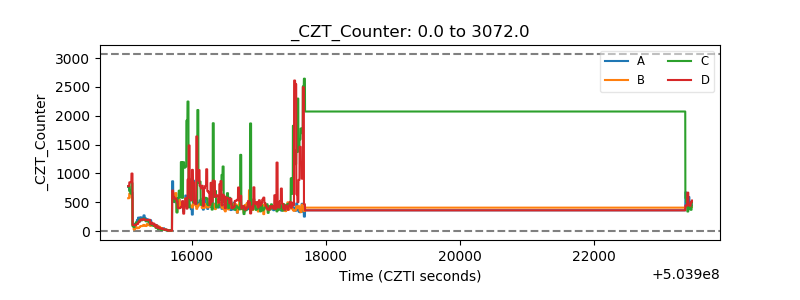 |
| +2.5 Volts monitor | 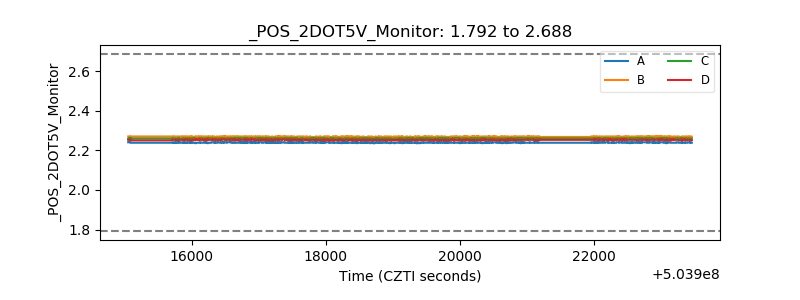 |
| +5 Volts monitor | 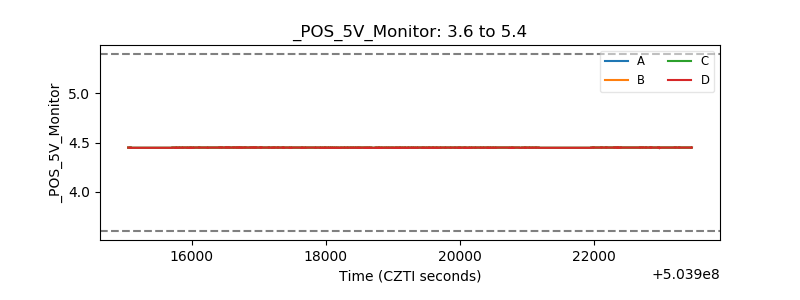 |
| _ROLL_ROT | 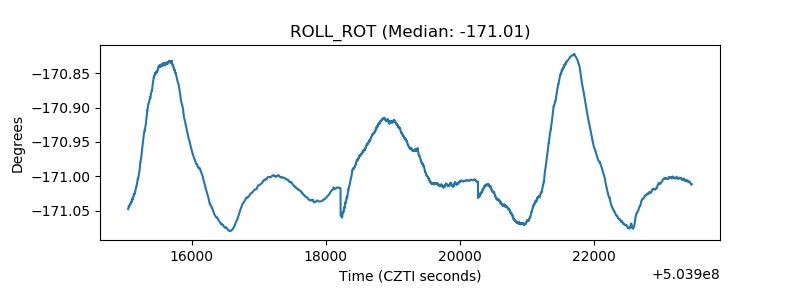 |
| _Roll_DEC | 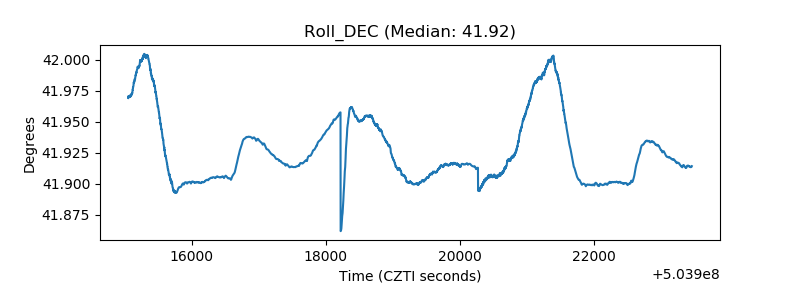 |
| _Roll_RA | 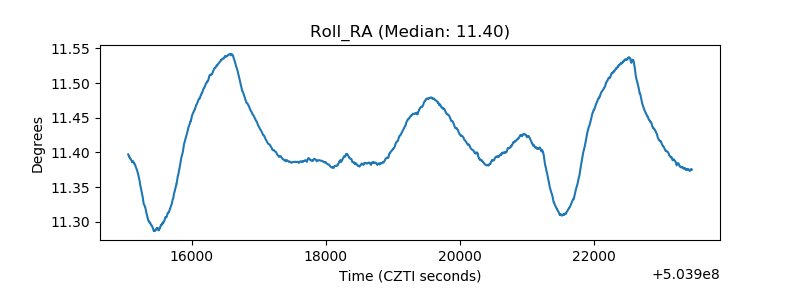 |
| Veto Counter | 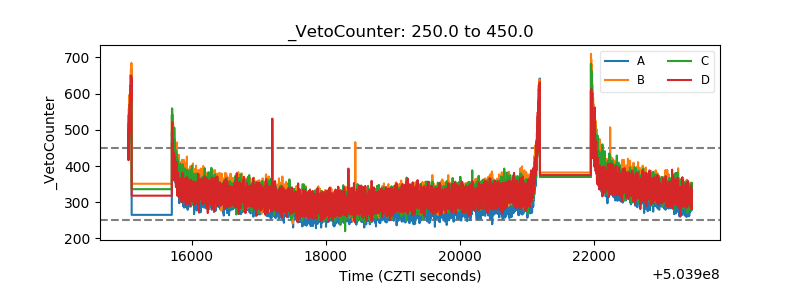 |