| Param | Original file | Final file |
|---|---|---|
| Filename | modeM0/AS1A14_009T01_9000006534_55340cztM0_level2.fits | modeM0/AS1A14_009T01_9000006534_55340cztM0_level2_quad_clean.evt |
| Size (bytes) | 385,398,720 | 93,430,080 |
| Size | 367.5 MB | 89.1 MB |
| Events in quadrant A | 3,463,018 | 606,396 |
| Events in quadrant B | 3,095,928 | 642,673 |
| Events in quadrant C | 3,343,686 | 582,067 |
| Events in quadrant D | 3,857,880 | 544,831 |
| Mode SS | |||
|---|---|---|---|
| Quadrant | BADHDUFLAG | Total packets | Discarded packets |
| A | 0 | 136 | 4 |
| B | 0 | 136 | 4 |
| C | 0 | 136 | 2 |
| D | 0 | 136 | 4 |
| Mode M0 | |||
|---|---|---|---|
| Quadrant | BADHDUFLAG | Total packets | Discarded packets |
| A | 0 | 15205 | 286 |
| B | 0 | 14338 | 298 |
| C | 0 | 15072 | 331 |
| D | 0 | 16324 | 297 |
| Mode M9 | |||
|---|---|---|---|
| Quadrant | BADHDUFLAG | Total packets | Discarded packets |
| A | 0 | 9 | 0 |
| B | 0 | 9 | 0 |
| C | 0 | 9 | 0 |
| D | 0 | 9 | 0 |
| Quadrant | Total seconds | Saturated seconds | Saturation percentage |
|---|---|---|---|
| A | 6502 | 100 | 1.537988% |
| B | 6494 | 127 | 1.955651% |
| C | 6493 | 60 | 0.924072% |
| D | 6489 | 125 | 1.926337% |
Noise dominated data is calculated using 1-second bins in cleaned event files. If a bin has >2000 counts, and if more than 50% of those come from <1% of pixels, then it is considered to be noise-dominated and hence unusable.
| Quadrant | # 1 sec bins | Bins with >0 counts | Bins with >2000 counts | High rate bins dominated by noise | Noise dominated (total time) | Noise dominated (detector-on time) | Marked lightcurve |
|---|---|---|---|---|---|---|---|
| A | 7516 | 6540 | 40 | 40 | 0.53% | 0.61% | 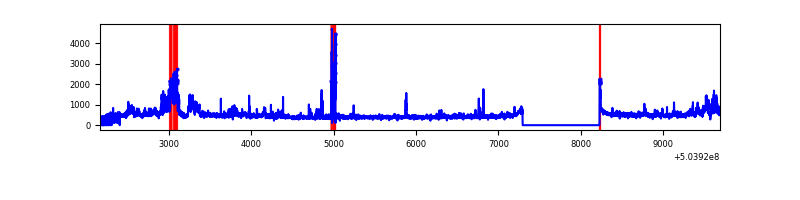 |
| B | 7531 | 6536 | 18 | 18 | 0.24% | 0.28% | 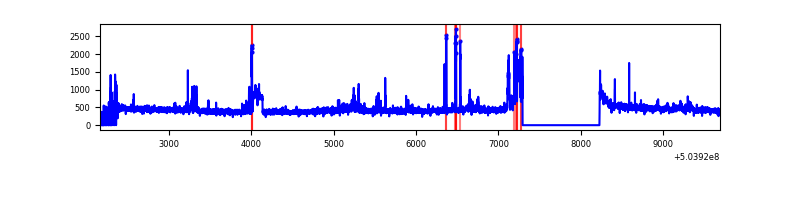 |
| C | 7513 | 6534 | 39 | 39 | 0.52% | 0.60% | 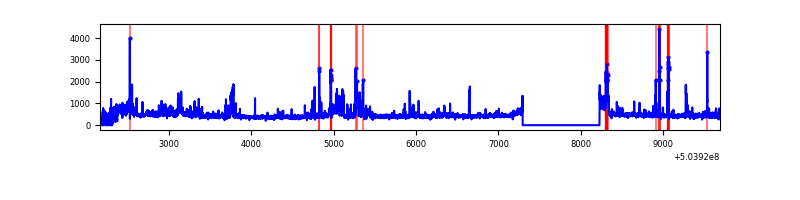 |
| D | 7512 | 6523 | 90 | 90 | 1.20% | 1.38% | 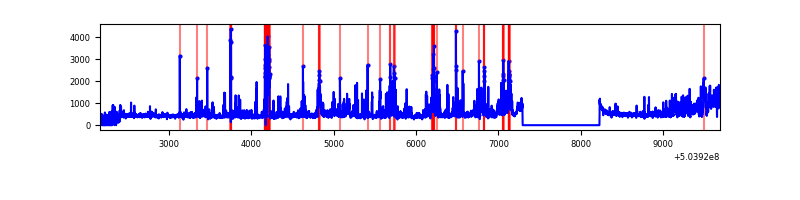 |
Top three noisy pixels from each quadrant. If the there are fewer than three noisy pixels in the level2.evt file, extra rows are filled as -1
| Pixel properties | Quadrant properties | ||||||
|---|---|---|---|---|---|---|---|
| Quadrant | DetID | PixID | Counts | Sigma | Mean | Median | Sigma |
| A | 12 | 115 | 544608 | 3213.2 | 685 | 668 | 169.3 |
| A | 0 | 8 | 89592 | 525.29 | 685 | 668 | 169.3 |
| A | 3 | 78 | 81291 | 476.26 | 685 | 668 | 169.3 |
| B | 5 | 185 | 210359 | 1455.37 | 670 | 645 | 144.1 |
| B | 0 | 199 | 71638 | 492.68 | 670 | 645 | 144.1 |
| B | 0 | 183 | 61991 | 425.73 | 670 | 645 | 144.1 |
| C | 12 | 252 | 395299 | 2152.04 | 662 | 655 | 183.4 |
| C | 9 | 38 | 159350 | 865.38 | 662 | 655 | 183.4 |
| C | 12 | 249 | 81438 | 440.52 | 662 | 655 | 183.4 |
| D | 11 | 129 | 694268 | 3703.08 | 662 | 632 | 187.3 |
| D | 2 | 62 | 242956 | 1293.68 | 662 | 632 | 187.3 |
| D | 3 | 12 | 95956 | 508.9 | 662 | 632 | 187.3 |
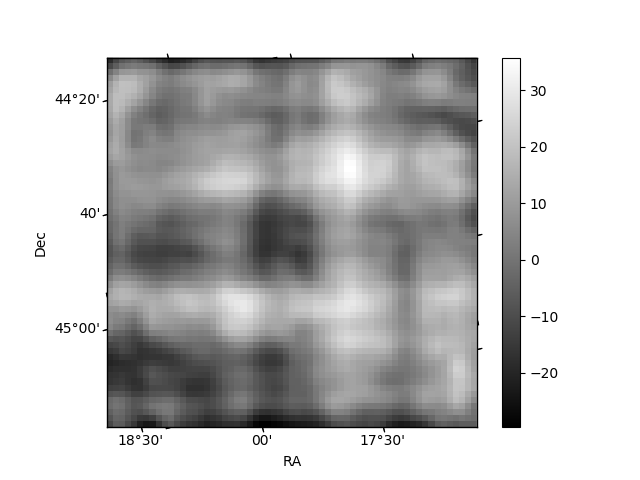
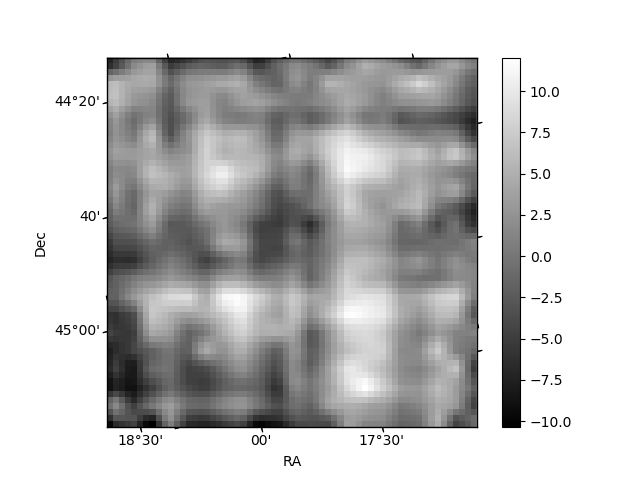
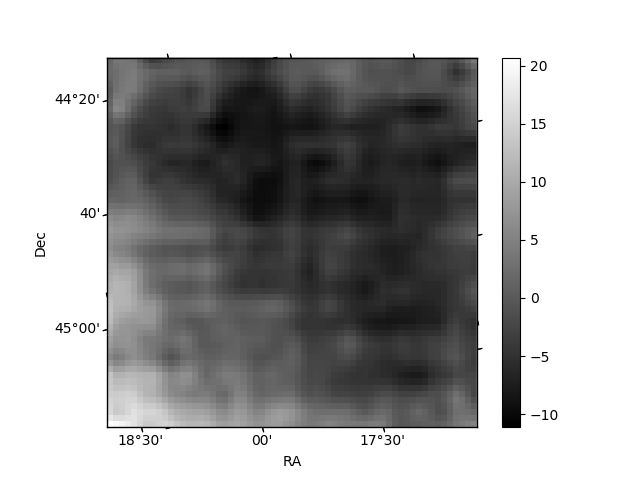
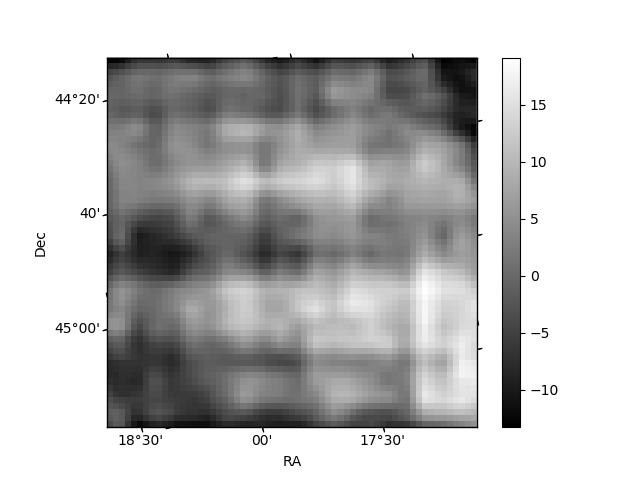
Histogram calculated using DETX and DETY for each event in the final _common_clean file
| Quadrant A | 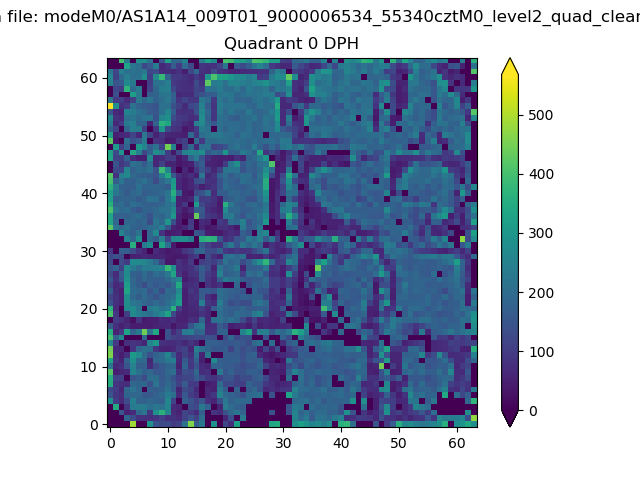 |
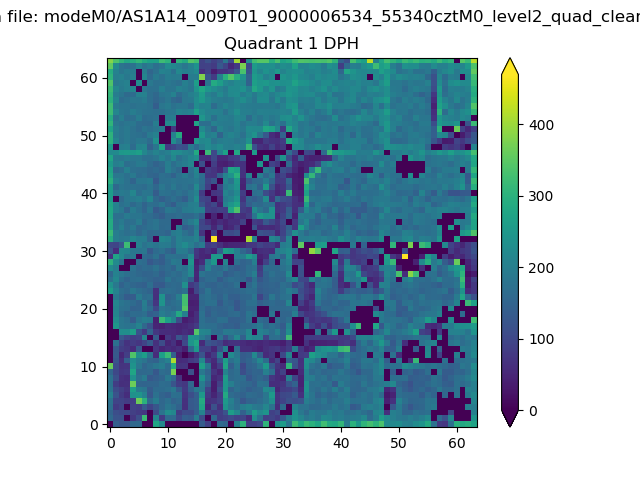 |
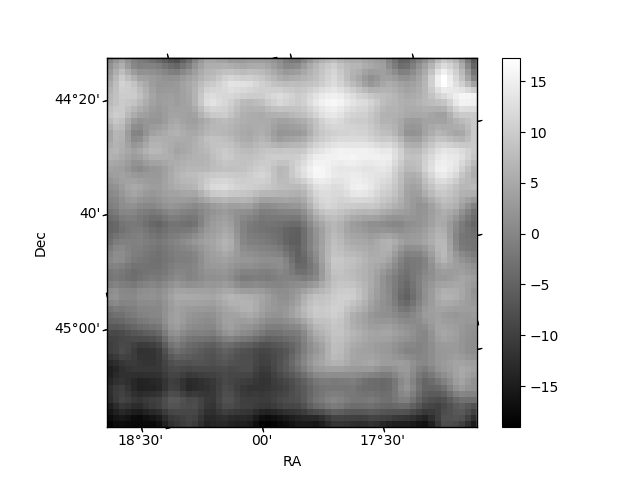
Quadrant B |
|---|---|---|---|
| Quadrant D | 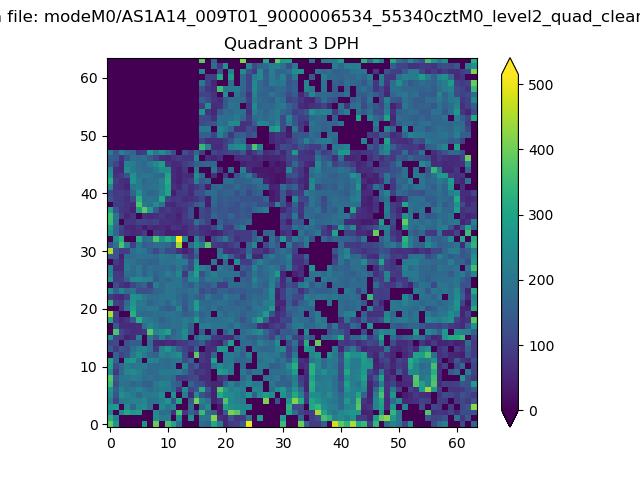 |
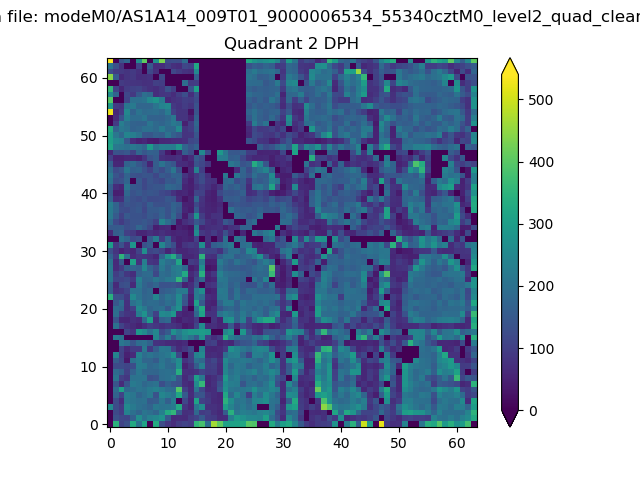 |
Quadrant C |
| Plot type | Count rate plots | Images |
|---|---|---|
| Comparison with Poisson distribution Blue bars denote a histogram of data divided into 1 sec bins. Red curve is a Poisson curve with rate = median count rate of data. |
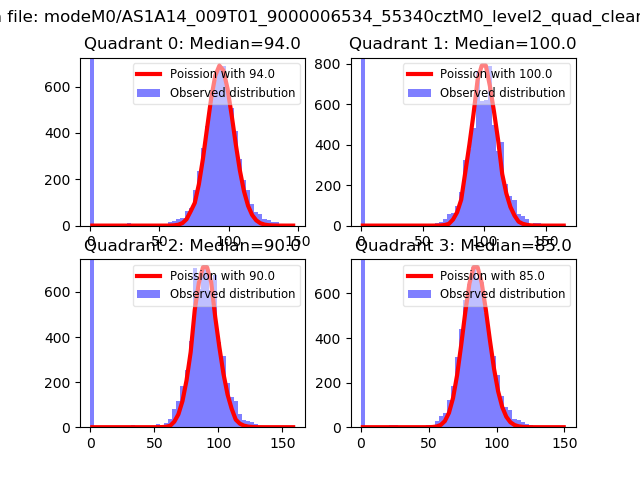 |
 |
| Quadrant-wise count rates Data is divided into 100 sec bins |
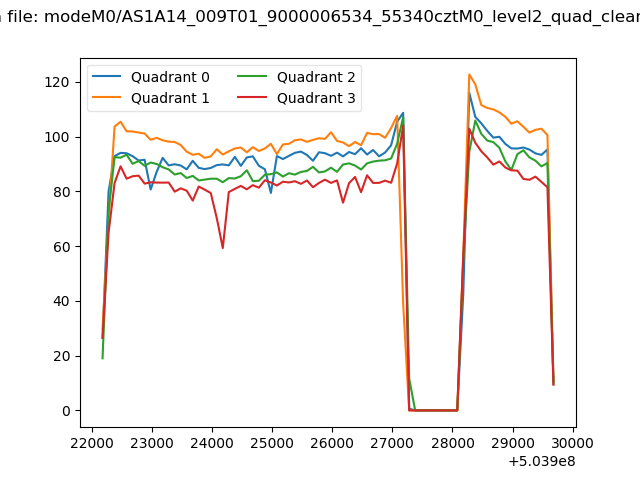 |
|
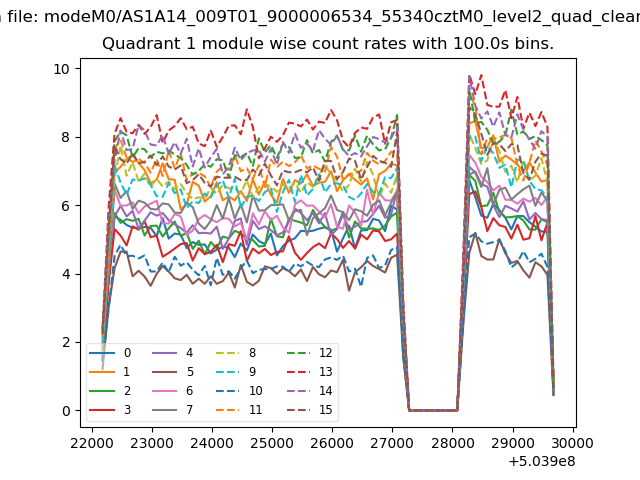
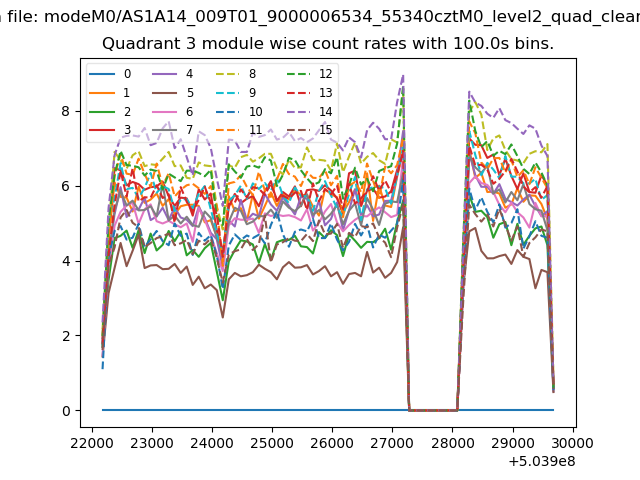
| Module-wise count rates for Quadrant A Data is divided into 100 sec bins |
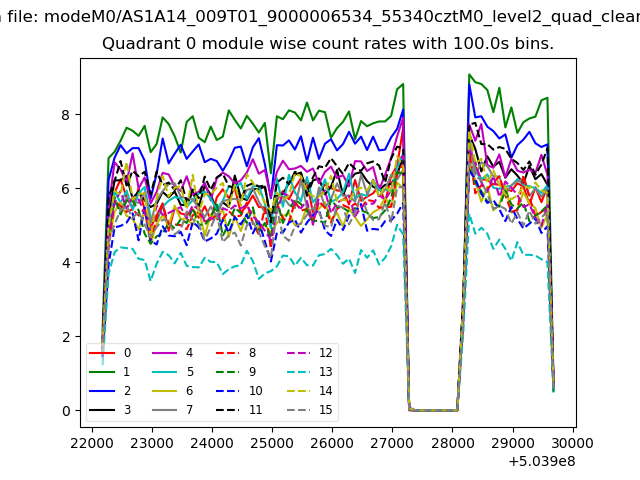 |
 |
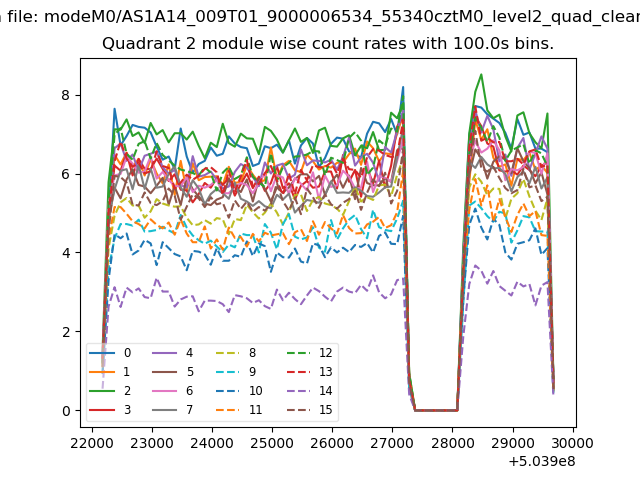
| Module-wise count rates for Quadrant B Data is divided into 100 sec bins |
 |
 |
| Module-wise count rates for Quadrant C Data is divided into 100 sec bins |
 |
 |
| Module-wise count rates for Quadrant D Data is divided into 100 sec bins |
 |
 |
| Parameter | Plot |
|---|---|
| CZT HV Monitor | 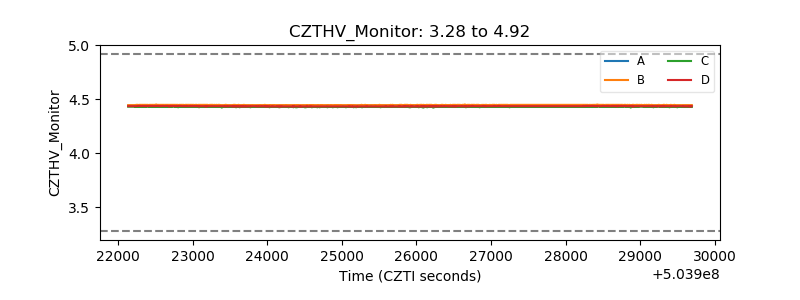 |
| D_VDD | 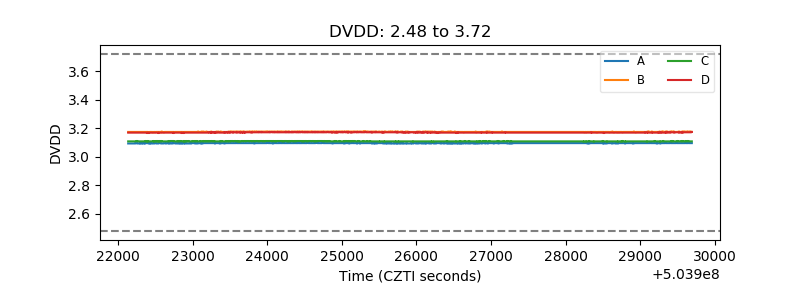 |
| Temperature 1 | 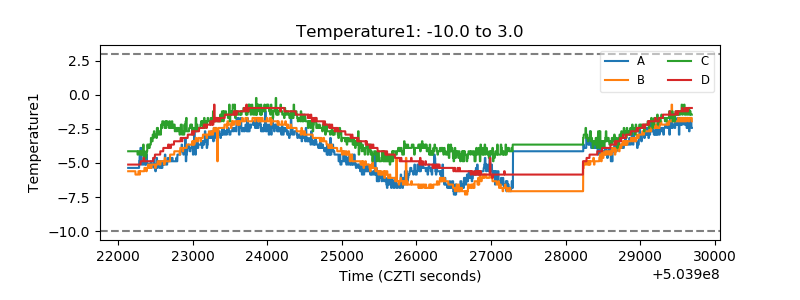 |
| Veto HV Monitor | 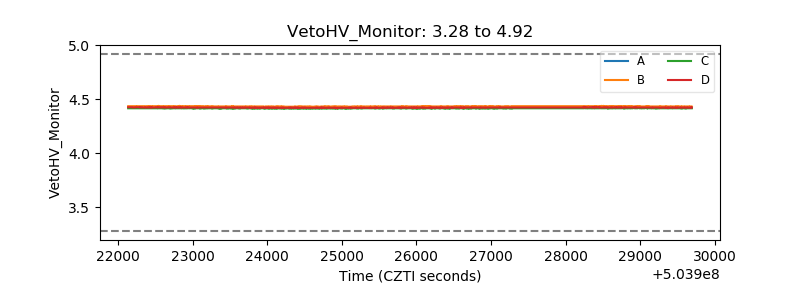 |
| Veto LLD | 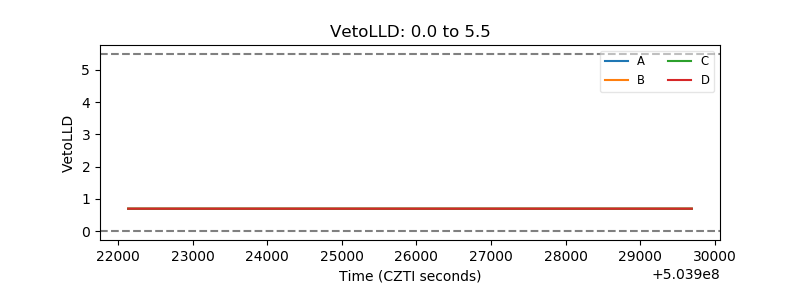 |
| Alpha Counter | 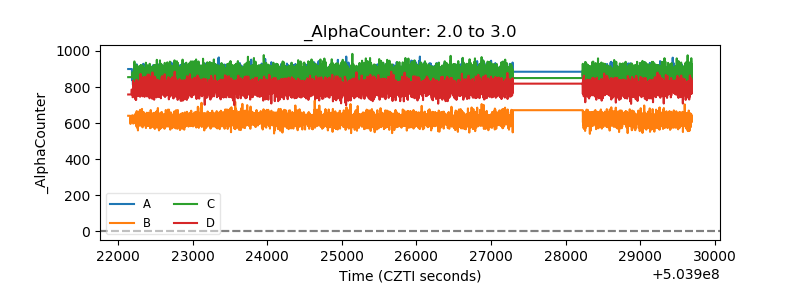 |
| _CPM_Rate | 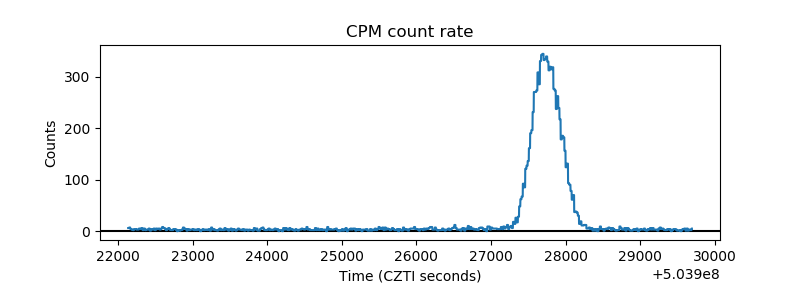 |
| CZT Counter | 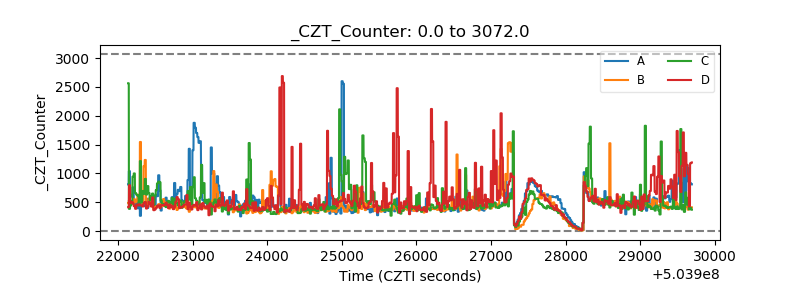 |
| +2.5 Volts monitor | 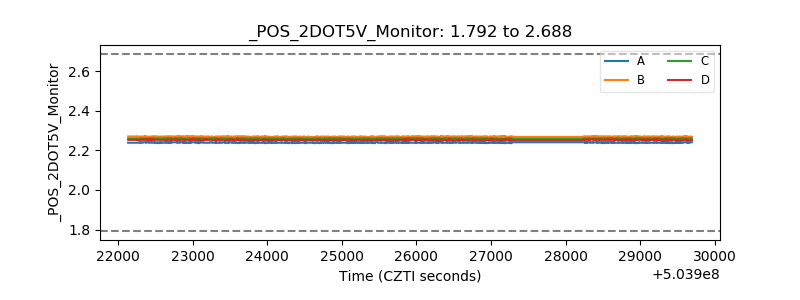 |
| +5 Volts monitor | 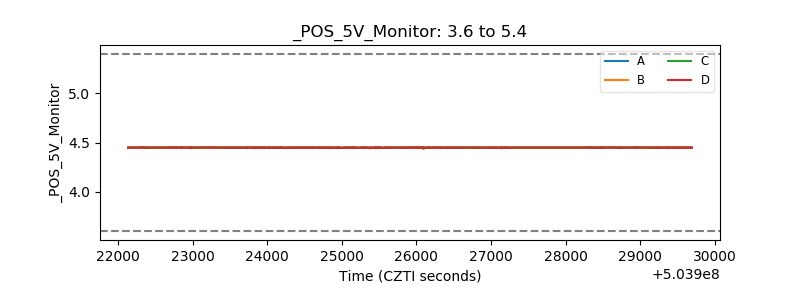 |
| _ROLL_ROT | 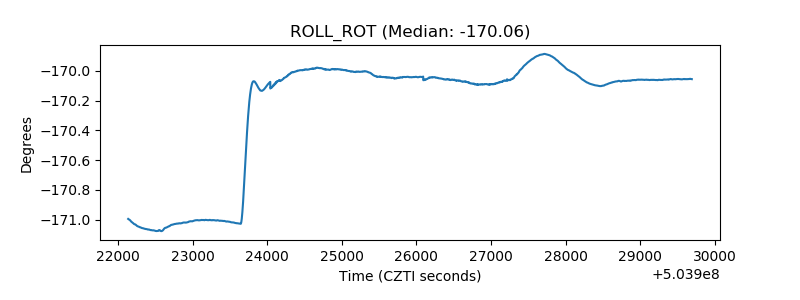 |
| _Roll_DEC | 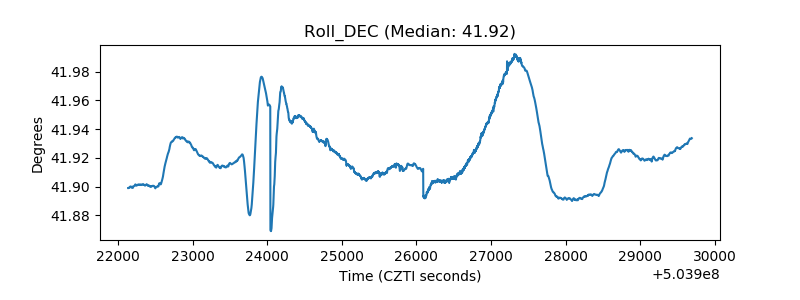 |
| _Roll_RA | 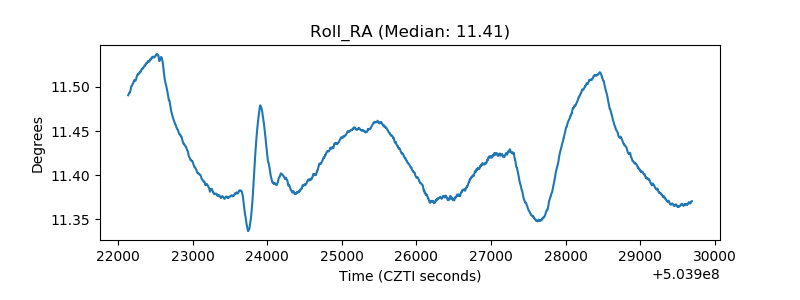 |
| Veto Counter | 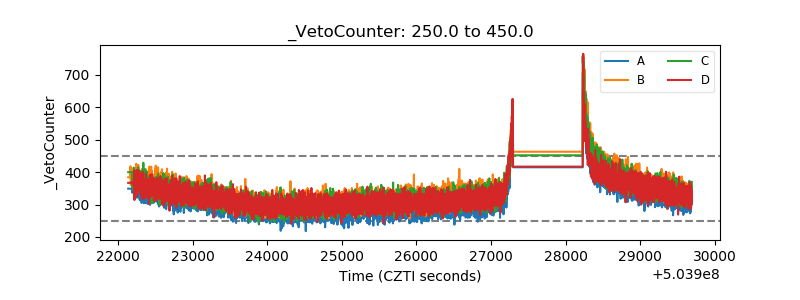 |