| Param | Original file | Final file |
|---|---|---|
| Filename | modeM0/AS1A14_009T01_9000006534_55343cztM0_level2.fits | modeM0/AS1A14_009T01_9000006534_55343cztM0_level2_quad_clean.evt |
| Size (bytes) | 454,089,600 | 84,536,640 |
| Size | 433.1 MB | 80.6 MB |
| Events in quadrant A | 6,910,007 | 458,860 |
| Events in quadrant B | 2,917,735 | 618,632 |
| Events in quadrant C | 3,313,523 | 543,788 |
| Events in quadrant D | 3,205,269 | 523,116 |
| Mode SS | |||
|---|---|---|---|
| Quadrant | BADHDUFLAG | Total packets | Discarded packets |
| A | 0 | 122 | 0 |
| B | 0 | 122 | 0 |
| C | 0 | 122 | 0 |
| D | 0 | 122 | 0 |
| Mode M0 | |||
|---|---|---|---|
| Quadrant | BADHDUFLAG | Total packets | Discarded packets |
| A | 0 | 24575 | 1 |
| B | 0 | 12872 | 1 |
| C | 0 | 14285 | 1 |
| D | 0 | 13809 | 3 |
| Mode M9 | |||
|---|---|---|---|
| Quadrant | BADHDUFLAG | Total packets | Discarded packets |
| A | 0 | 11 | 0 |
| B | 0 | 11 | 0 |
| C | 0 | 11 | 0 |
| D | 0 | 11 | 0 |
| Quadrant | Total seconds | Saturated seconds | Saturation percentage |
|---|---|---|---|
| A | 5942 | 1392 | 23.426456% |
| B | 5943 | 95 | 1.598519% |
| C | 5943 | 198 | 3.331651% |
| D | 5942 | 125 | 2.103669% |
Noise dominated data is calculated using 1-second bins in cleaned event files. If a bin has >2000 counts, and if more than 50% of those come from <1% of pixels, then it is considered to be noise-dominated and hence unusable.
| Quadrant | # 1 sec bins | Bins with >0 counts | Bins with >2000 counts | High rate bins dominated by noise | Noise dominated (total time) | Noise dominated (detector-on time) | Marked lightcurve |
|---|---|---|---|---|---|---|---|
| A | 7052 | 5943 | 1324 | 1324 | 18.77% | 22.28% | 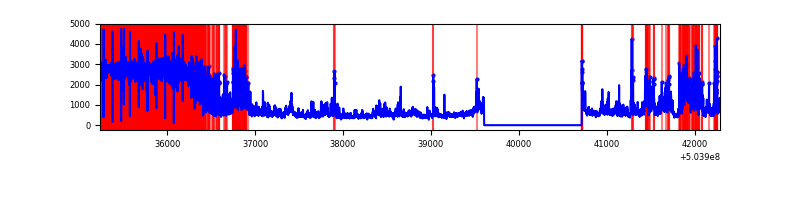 |
| B | 7053 | 5944 | 18 | 18 | 0.26% | 0.30% | 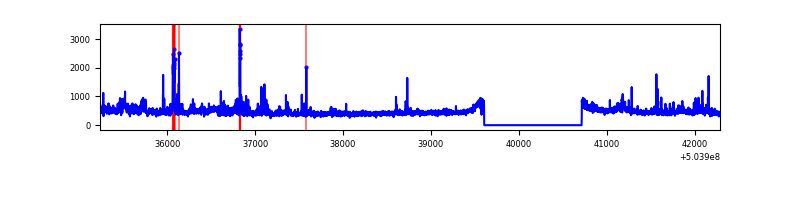 |
| C | 7053 | 5944 | 129 | 129 | 1.83% | 2.17% | 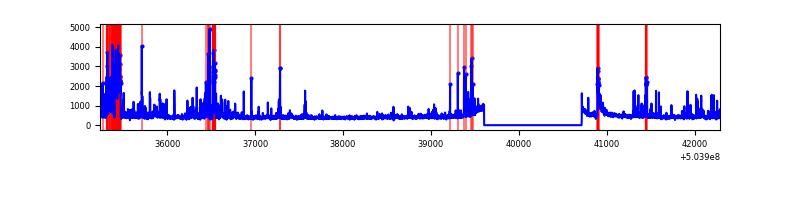 |
| D | 7052 | 5943 | 74 | 74 | 1.05% | 1.25% | 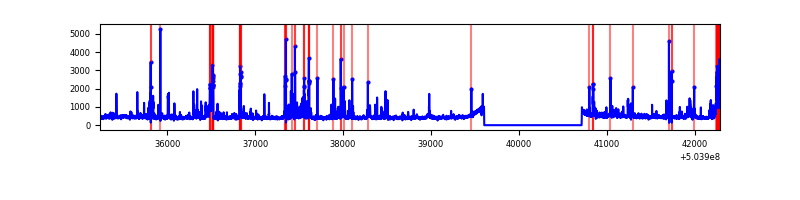 |
Top three noisy pixels from each quadrant. If the there are fewer than three noisy pixels in the level2.evt file, extra rows are filled as -1
| Pixel properties | Quadrant properties | ||||||
|---|---|---|---|---|---|---|---|
| Quadrant | DetID | PixID | Counts | Sigma | Mean | Median | Sigma |
| A | 12 | 115 | 3667049 | 26842.65 | 553 | 540 | 136.6 |
| A | 3 | 78 | 852683 | 6238.57 | 553 | 540 | 136.6 |
| A | 0 | 8 | 170876 | 1247.04 | 553 | 540 | 136.6 |
| B | 0 | 199 | 193119 | 1432.78 | 624 | 602 | 134.4 |
| B | 10 | 247 | 75470 | 557.19 | 624 | 602 | 134.4 |
| B | 0 | 182 | 69298 | 511.26 | 624 | 602 | 134.4 |
| C | 13 | 3 | 478881 | 2834.63 | 612 | 606 | 168.7 |
| C | 12 | 252 | 153046 | 903.48 | 612 | 606 | 168.7 |
| C | 15 | 147 | 151373 | 893.56 | 612 | 606 | 168.7 |
| D | 11 | 129 | 252348 | 1449.59 | 619 | 593 | 173.7 |
| D | 2 | 31 | 167725 | 962.34 | 619 | 593 | 173.7 |
| D | 2 | 62 | 106570 | 610.21 | 619 | 593 | 173.7 |
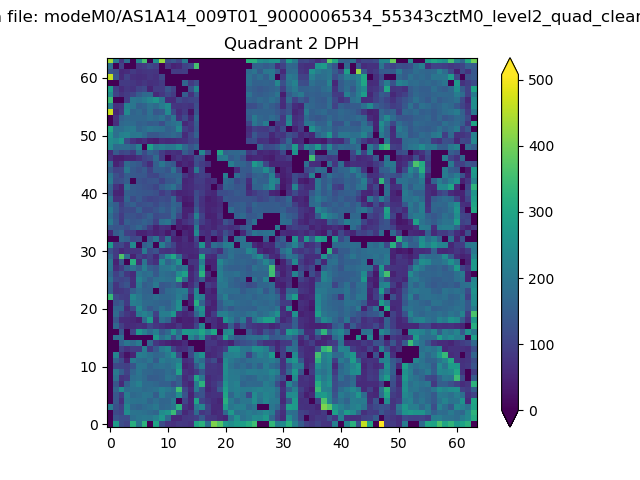
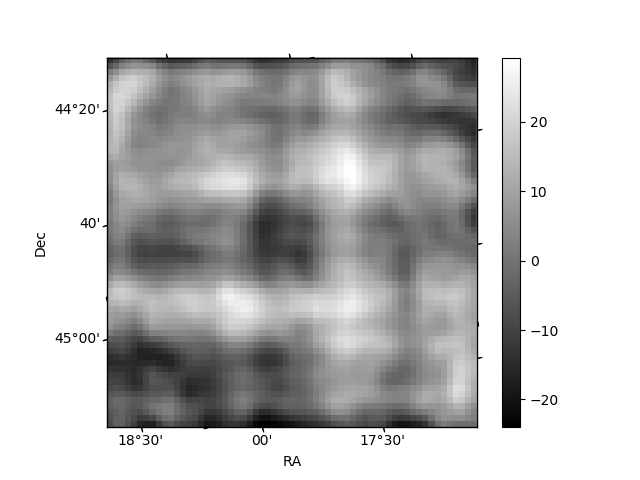
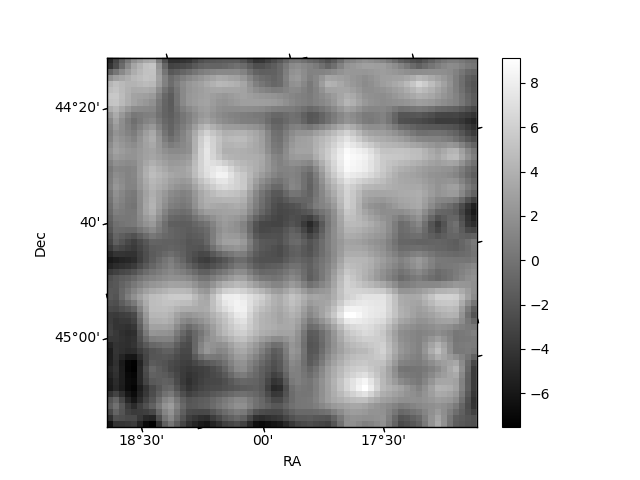
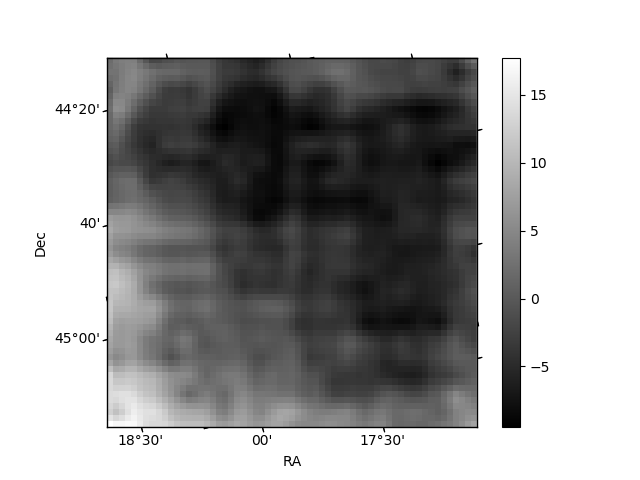
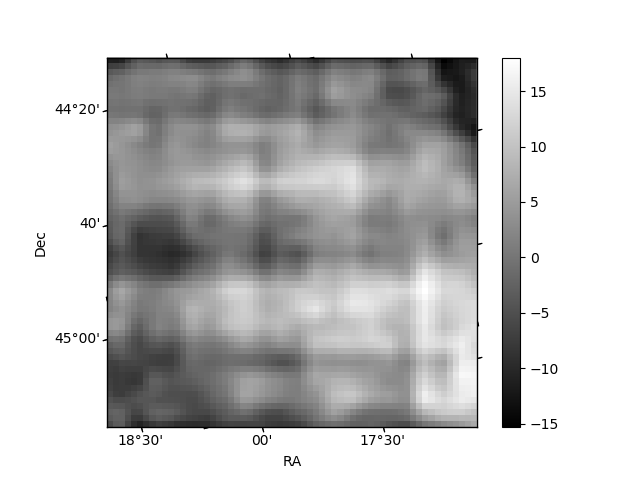
Histogram calculated using DETX and DETY for each event in the final _common_clean file
| Quadrant A | 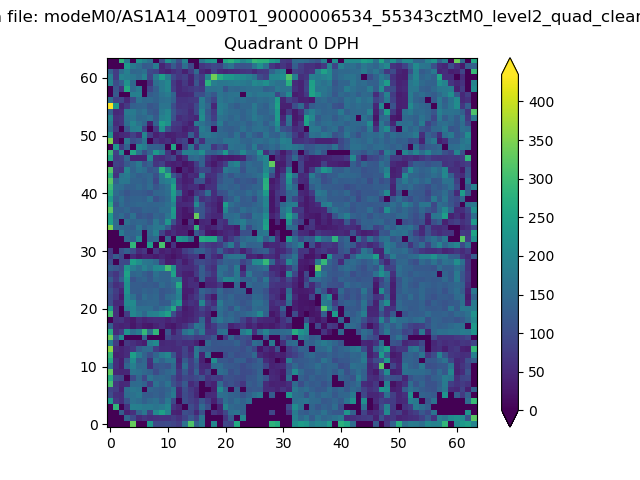 |
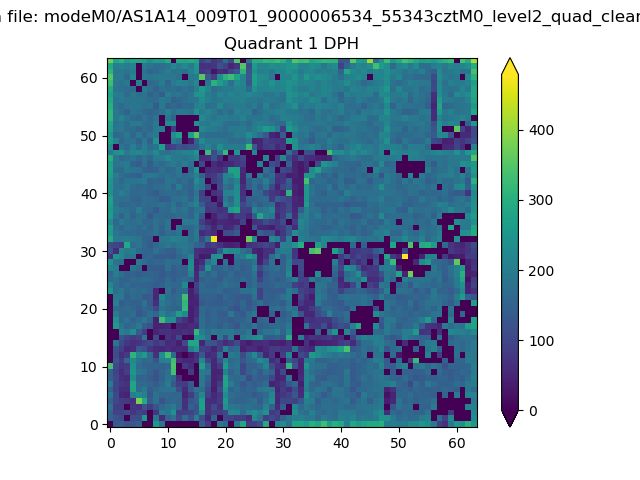 |
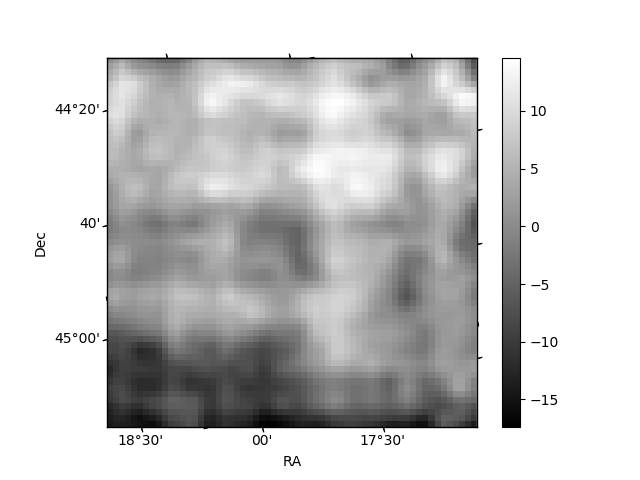
Quadrant B |
|---|---|---|---|
| Quadrant D | 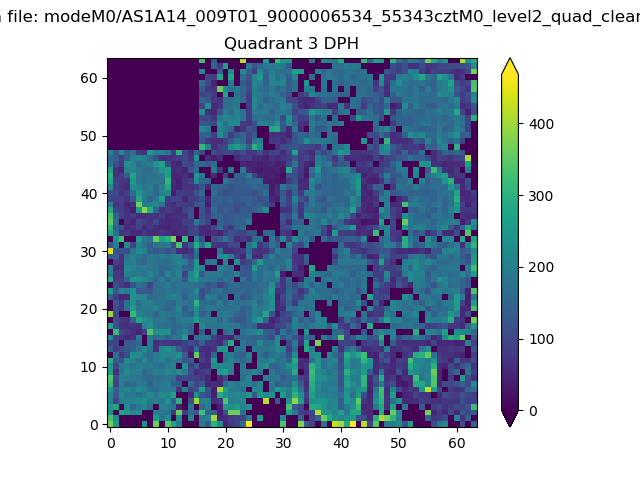 |
 |
Quadrant C |
| Plot type | Count rate plots | Images |
|---|---|---|
| Comparison with Poisson distribution Blue bars denote a histogram of data divided into 1 sec bins. Red curve is a Poisson curve with rate = median count rate of data. |
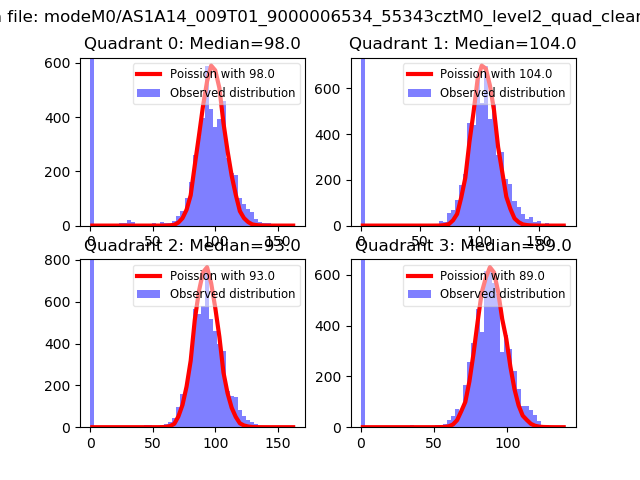 |
 |
| Quadrant-wise count rates Data is divided into 100 sec bins |
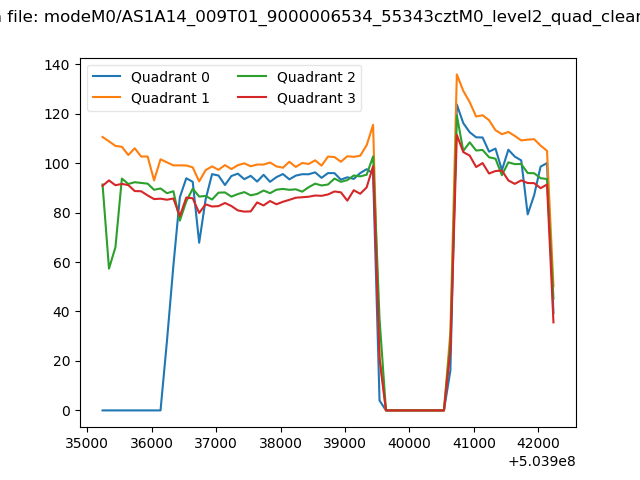 |
|
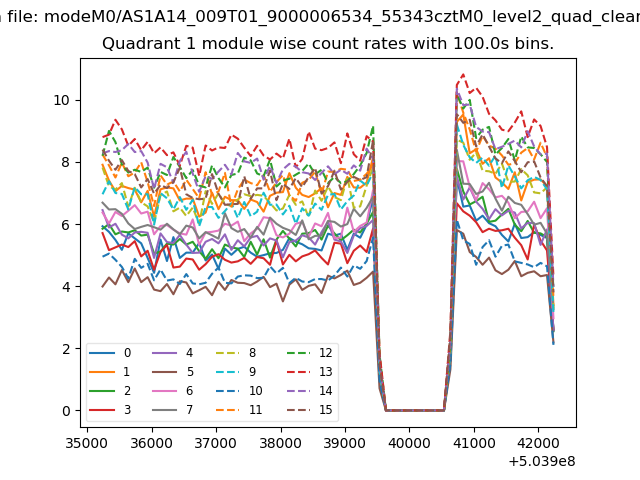
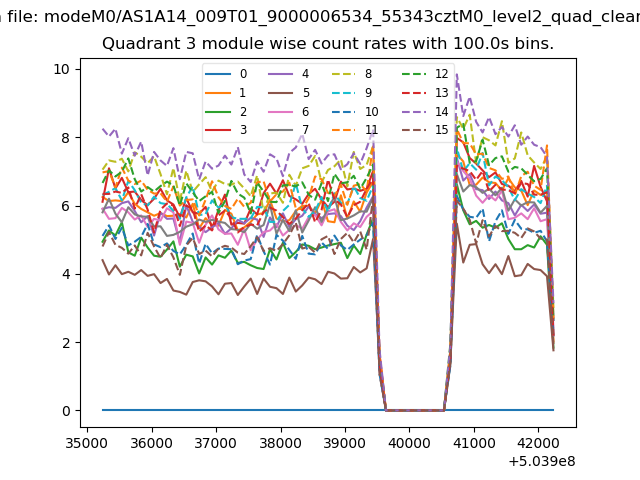
| Module-wise count rates for Quadrant A Data is divided into 100 sec bins |
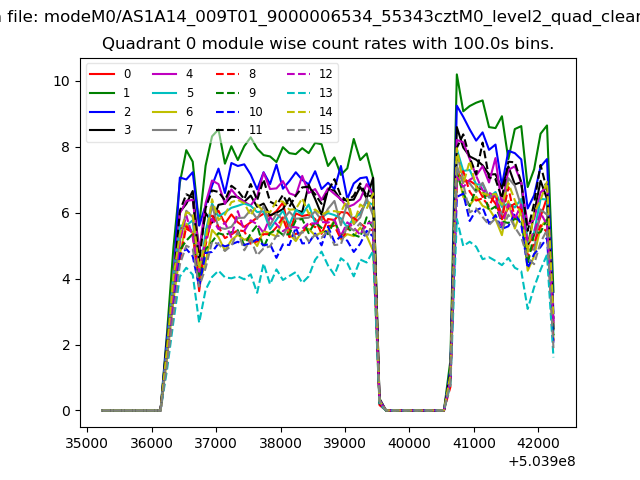 |
 |
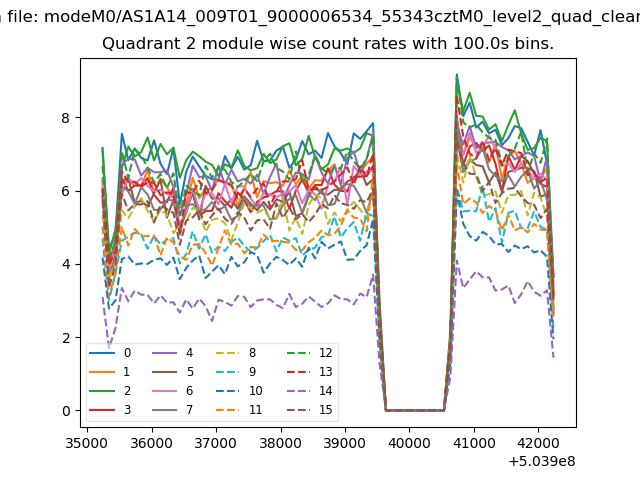
| Module-wise count rates for Quadrant B Data is divided into 100 sec bins |
 |
 |
| Module-wise count rates for Quadrant C Data is divided into 100 sec bins |
 |
 |
| Module-wise count rates for Quadrant D Data is divided into 100 sec bins |
 |
 |
| Parameter | Plot |
|---|---|
| CZT HV Monitor | 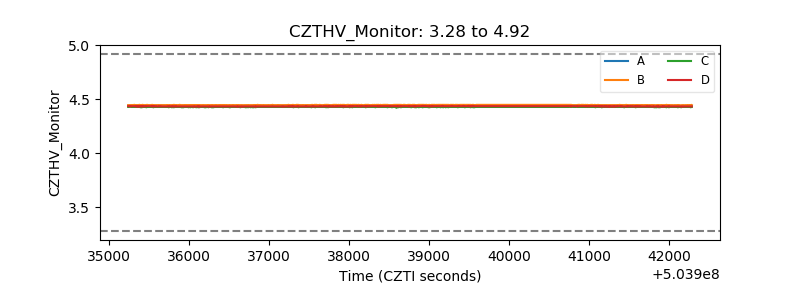 |
| D_VDD | 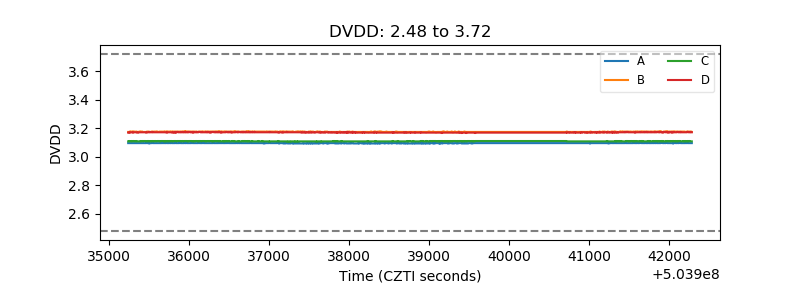 |
| Temperature 1 | 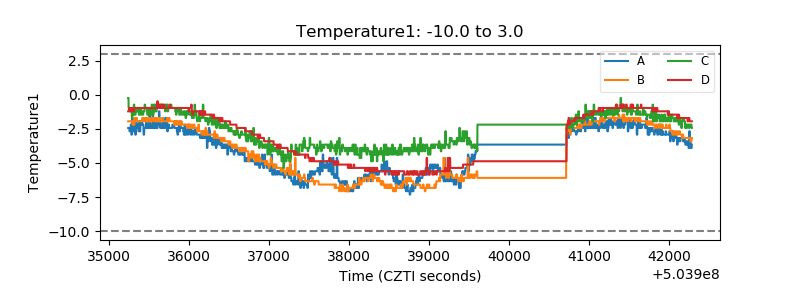 |
| Veto HV Monitor | 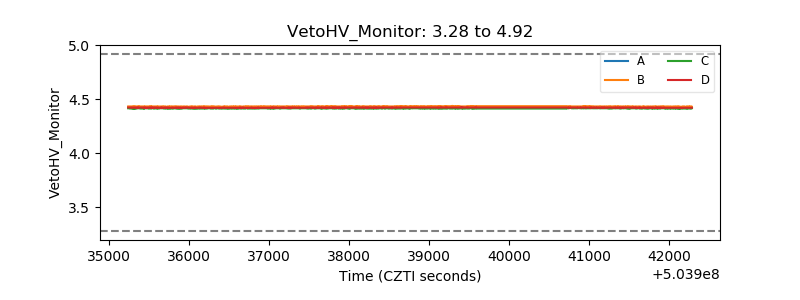 |
| Veto LLD | 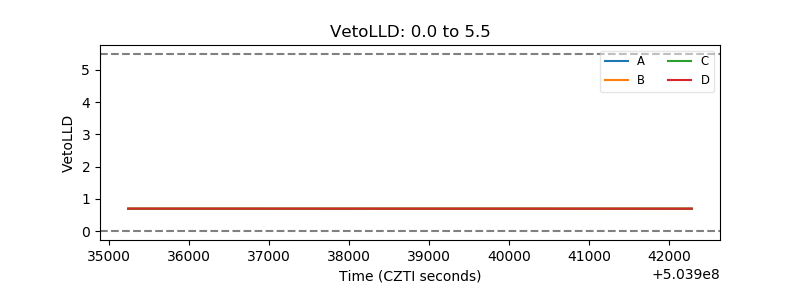 |
| Alpha Counter | 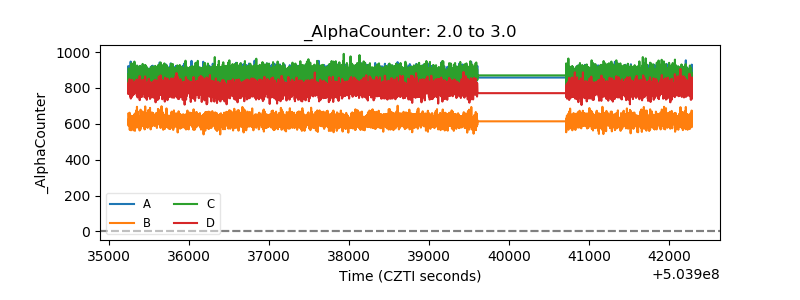 |
| _CPM_Rate | 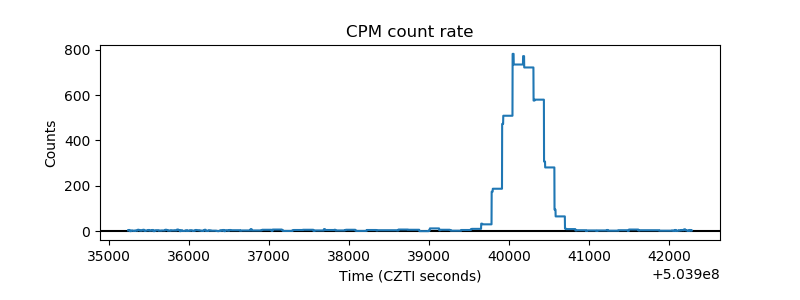 |
| CZT Counter | 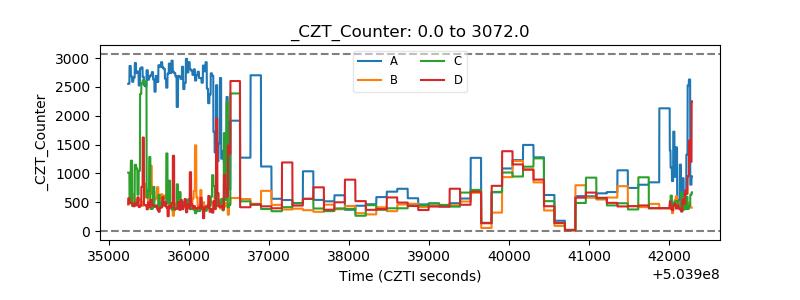 |
| +2.5 Volts monitor | 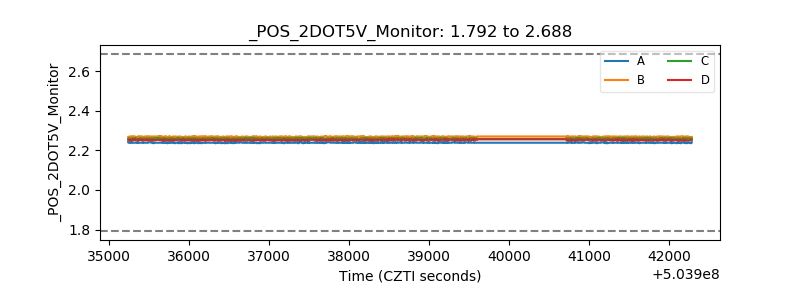 |
| +5 Volts monitor | 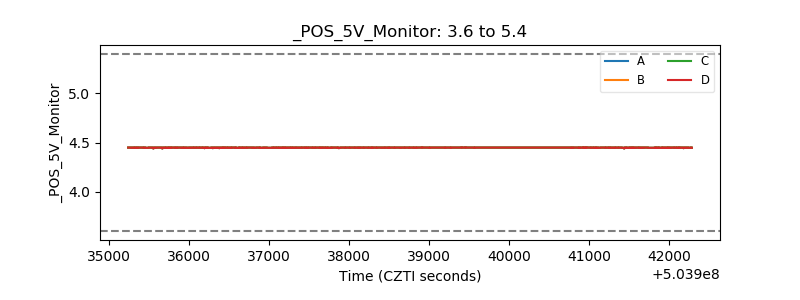 |
| _ROLL_ROT | 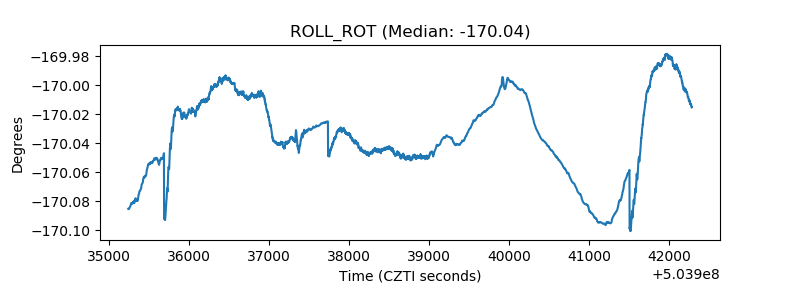 |
| _Roll_DEC | 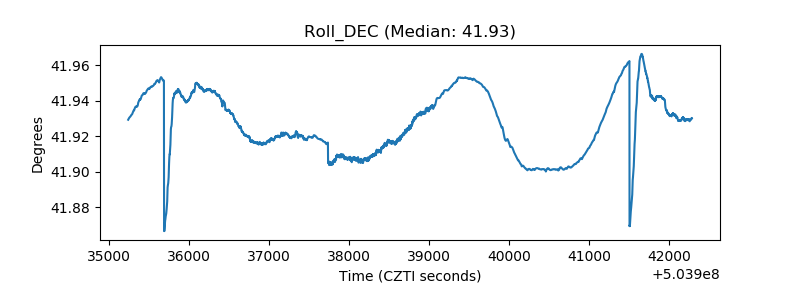 |
| _Roll_RA | 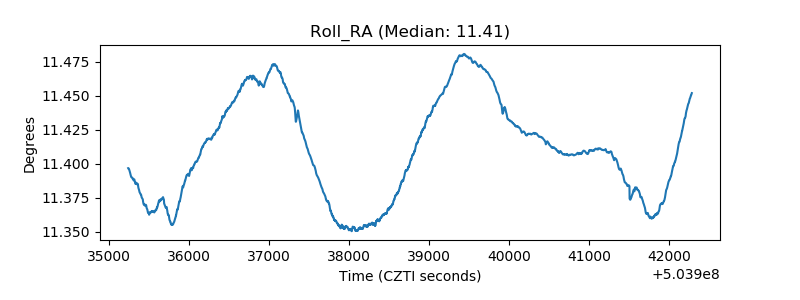 |
| Veto Counter | 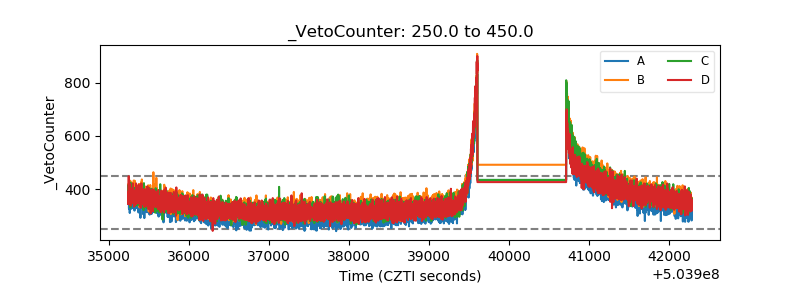 |