| Param | Original file | Final file |
|---|---|---|
| Filename | modeM0/AS1A14_009T01_9000006534_55345cztM0_level2.fits | modeM0/AS1A14_009T01_9000006534_55345cztM0_level2_quad_clean.evt |
| Size (bytes) | 491,636,160 | 94,844,160 |
| Size | 468.9 MB | 90.5 MB |
| Events in quadrant A | 7,818,339 | 539,141 |
| Events in quadrant B | 3,056,988 | 687,933 |
| Events in quadrant C | 3,424,240 | 616,157 |
| Events in quadrant D | 3,393,923 | 575,315 |
| Mode SS | |||
|---|---|---|---|
| Quadrant | BADHDUFLAG | Total packets | Discarded packets |
| A | 0 | 132 | 0 |
| B | 0 | 132 | 0 |
| C | 0 | 132 | 0 |
| D | 0 | 132 | 0 |
| Mode M0 | |||
|---|---|---|---|
| Quadrant | BADHDUFLAG | Total packets | Discarded packets |
| A | 0 | 27610 | 2 |
| B | 0 | 13798 | 2 |
| C | 0 | 14958 | 2 |
| D | 0 | 14874 | 2 |
| Mode M9 | |||
|---|---|---|---|
| Quadrant | BADHDUFLAG | Total packets | Discarded packets |
| A | 0 | 17 | 0 |
| B | 0 | 18 | 0 |
| C | 0 | 18 | 0 |
| D | 0 | 18 | 0 |
| Quadrant | Total seconds | Saturated seconds | Saturation percentage |
|---|---|---|---|
| A | 6500 | 1294 | 19.907692% |
| B | 6500 | 89 | 1.369231% |
| C | 6500 | 121 | 1.861538% |
| D | 6500 | 163 | 2.507692% |
Noise dominated data is calculated using 1-second bins in cleaned event files. If a bin has >2000 counts, and if more than 50% of those come from <1% of pixels, then it is considered to be noise-dominated and hence unusable.
| Quadrant | # 1 sec bins | Bins with >0 counts | Bins with >2000 counts | High rate bins dominated by noise | Noise dominated (total time) | Noise dominated (detector-on time) | Marked lightcurve |
|---|---|---|---|---|---|---|---|
| A | 7600 | 6501 | 1336 | 1336 | 17.58% | 20.55% | 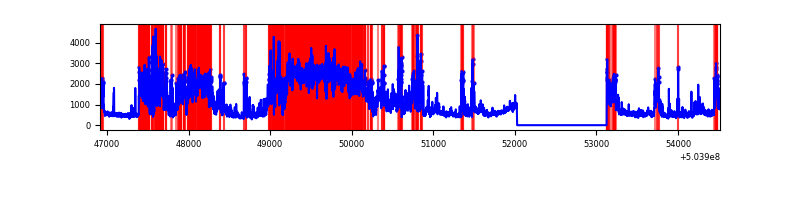 |
| B | 7600 | 6501 | 0 | 0 | 0.00% | 0.00% | 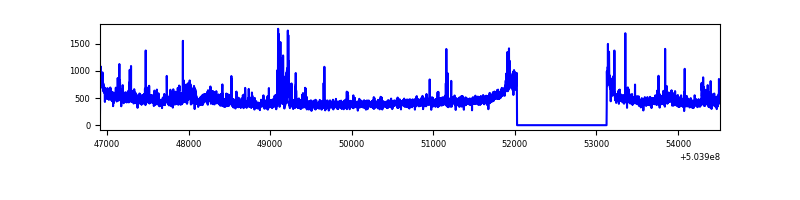 |
| C | 7600 | 6501 | 71 | 71 | 0.93% | 1.09% | 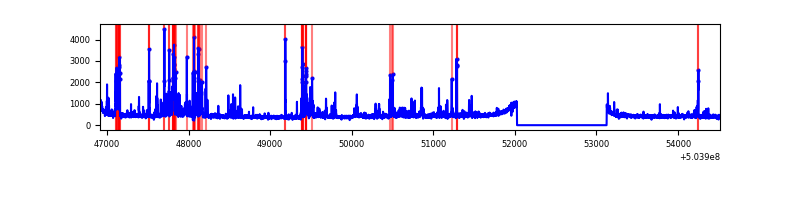 |
| D | 7600 | 6501 | 71 | 71 | 0.93% | 1.09% | 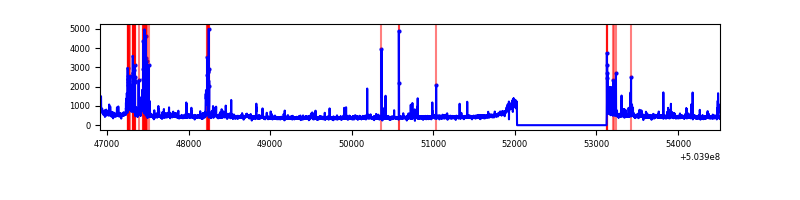 |
Top three noisy pixels from each quadrant. If the there are fewer than three noisy pixels in the level2.evt file, extra rows are filled as -1
| Pixel properties | Quadrant properties | ||||||
|---|---|---|---|---|---|---|---|
| Quadrant | DetID | PixID | Counts | Sigma | Mean | Median | Sigma |
| A | 12 | 115 | 4124371 | 24675.47 | 672 | 654 | 167.1 |
| A | 3 | 78 | 514453 | 3074.47 | 672 | 654 | 167.1 |
| A | 0 | 8 | 237453 | 1416.96 | 672 | 654 | 167.1 |
| B | 0 | 199 | 152388 | 1011.48 | 697 | 672 | 150.0 |
| B | 2 | 249 | 65566 | 432.64 | 697 | 672 | 150.0 |
| B | 9 | 254 | 32138 | 209.78 | 697 | 672 | 150.0 |
| C | 15 | 147 | 326763 | 1722.09 | 694 | 686 | 189.4 |
| C | 13 | 3 | 210802 | 1109.67 | 694 | 686 | 189.4 |
| C | 12 | 250 | 45740 | 237.94 | 694 | 686 | 189.4 |
| D | 2 | 62 | 178289 | 913.47 | 690 | 660 | 194.5 |
| D | 11 | 129 | 125344 | 641.2 | 690 | 660 | 194.5 |
| D | 2 | 31 | 100527 | 513.58 | 690 | 660 | 194.5 |
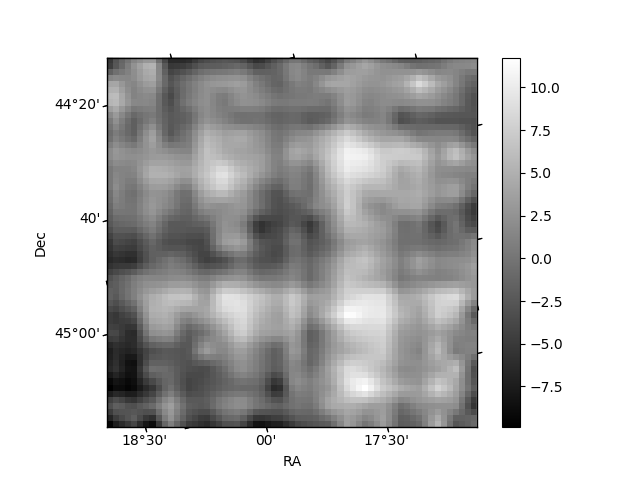
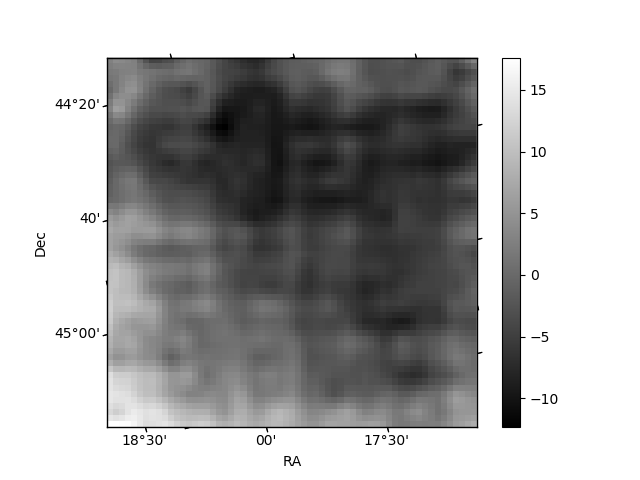
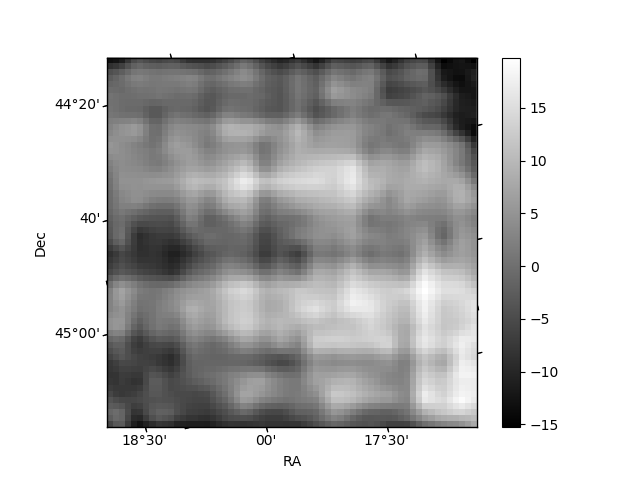
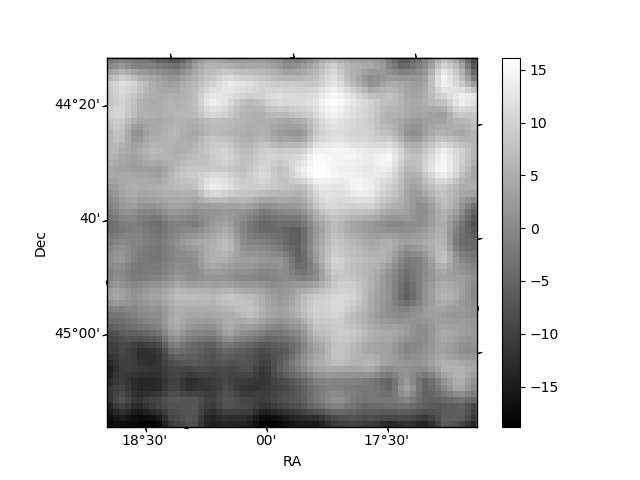
Histogram calculated using DETX and DETY for each event in the final _common_clean file
| Quadrant A | 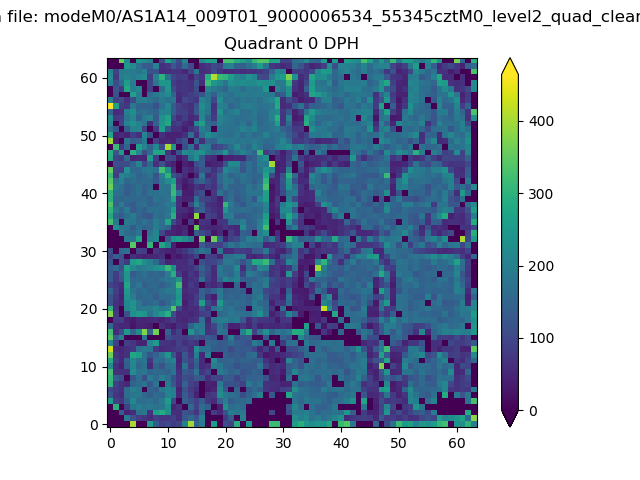 |
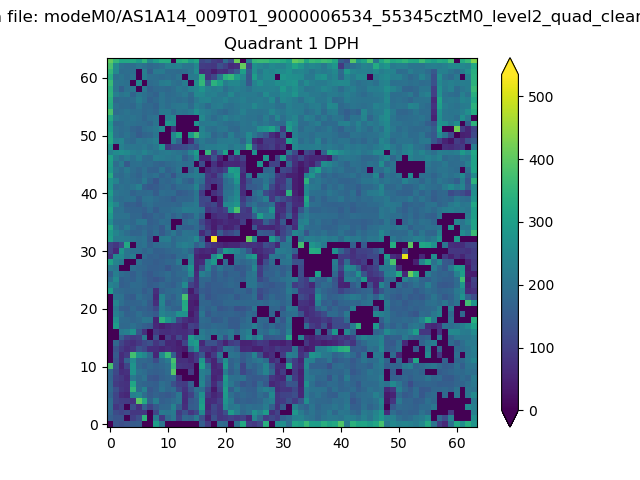 |
Quadrant B |
|---|---|---|---|
| Quadrant D | 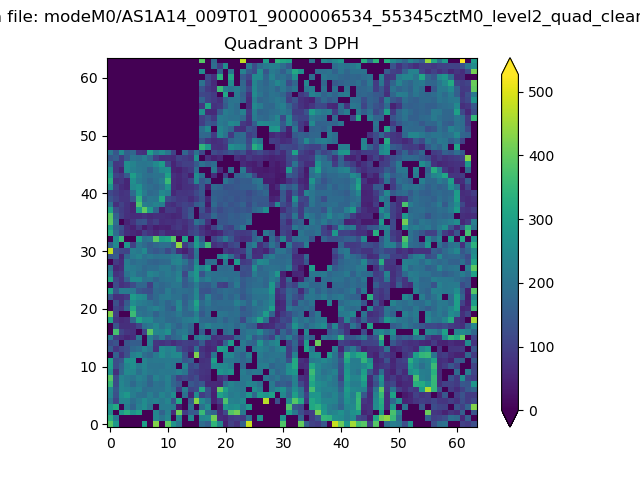 |
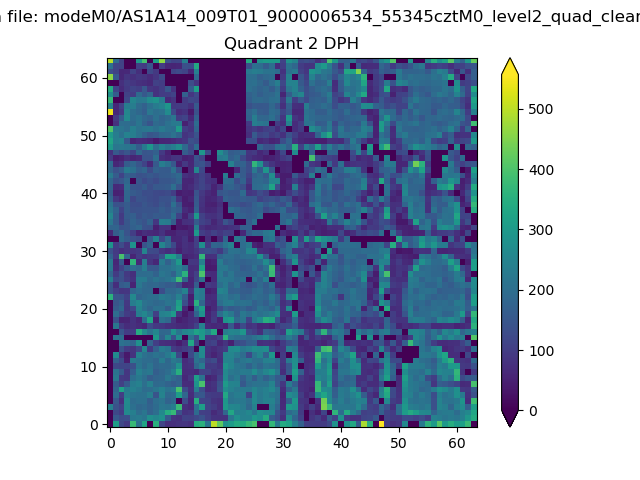 |
Quadrant C |
| Plot type | Count rate plots | Images |
|---|---|---|
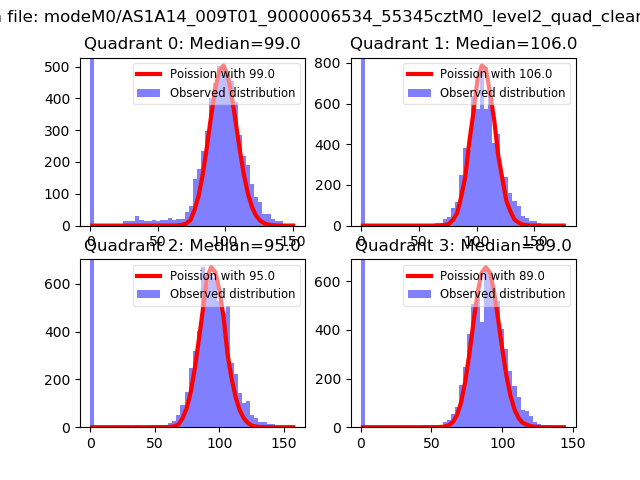
| Comparison with Poisson distribution Blue bars denote a histogram of data divided into 1 sec bins. Red curve is a Poisson curve with rate = median count rate of data. |
 |
 |
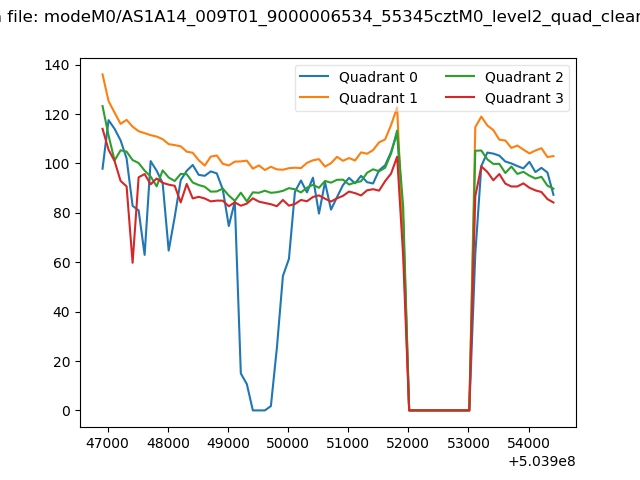
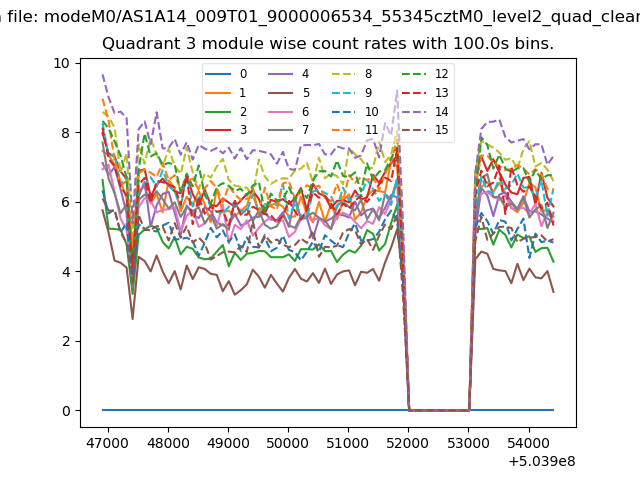
| Quadrant-wise count rates Data is divided into 100 sec bins |
 |
|
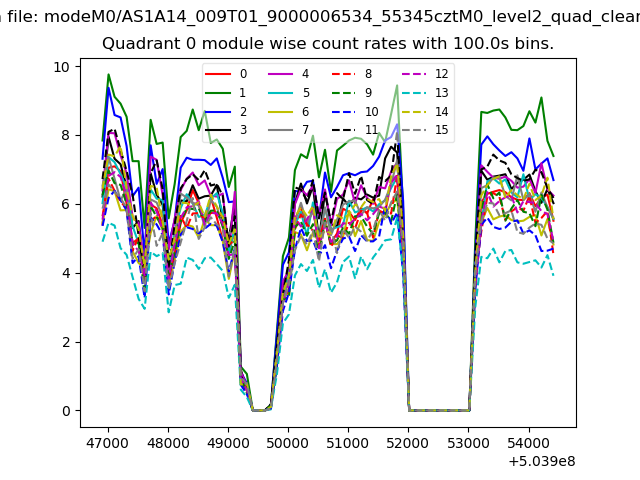
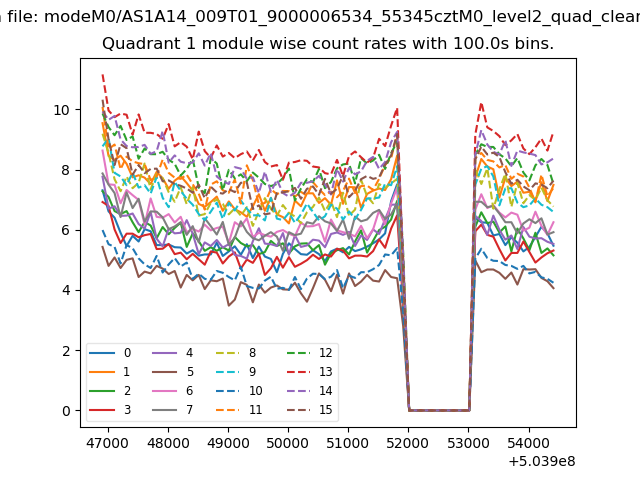
| Module-wise count rates for Quadrant A Data is divided into 100 sec bins |
 |
 |
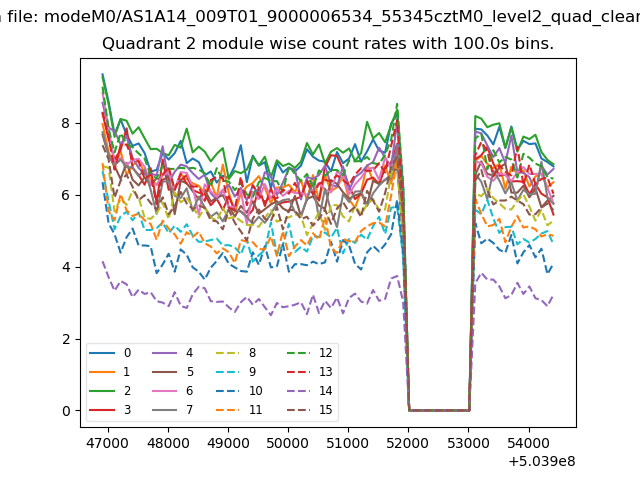
| Module-wise count rates for Quadrant B Data is divided into 100 sec bins |
 |
 |
| Module-wise count rates for Quadrant C Data is divided into 100 sec bins |
 |
 |
| Module-wise count rates for Quadrant D Data is divided into 100 sec bins |
 |
 |
| Parameter | Plot |
|---|---|
| CZT HV Monitor | 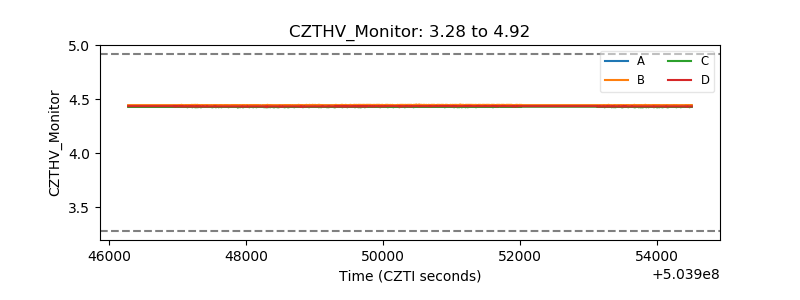 |
| D_VDD | 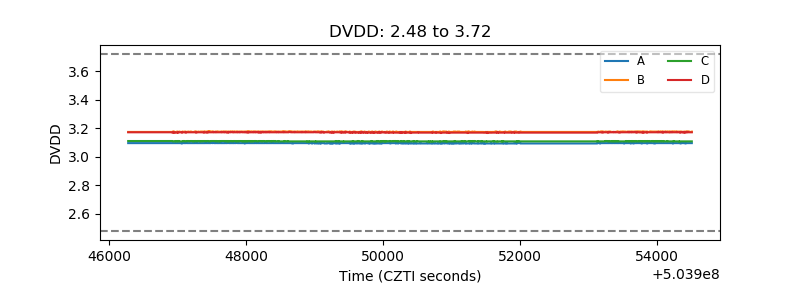 |
| Temperature 1 | 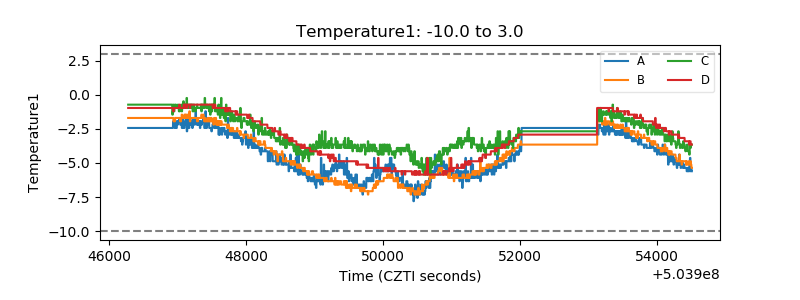 |
| Veto HV Monitor | 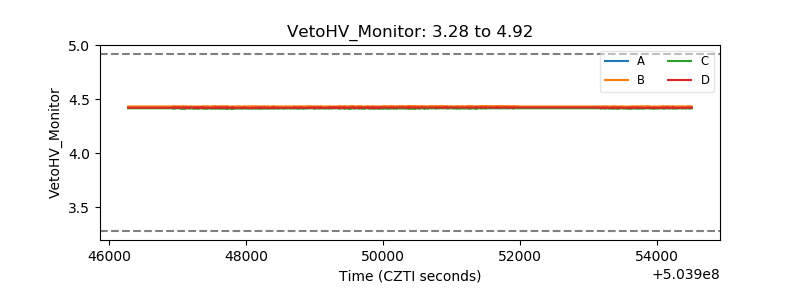 |
| Veto LLD | 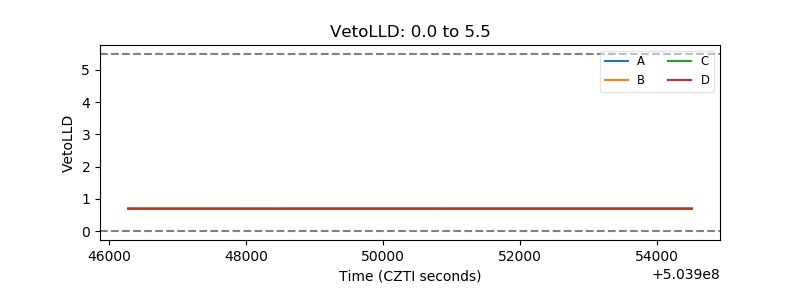 |
| Alpha Counter | 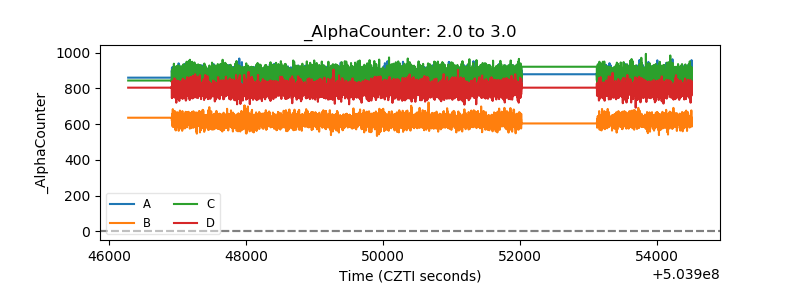 |
| _CPM_Rate | 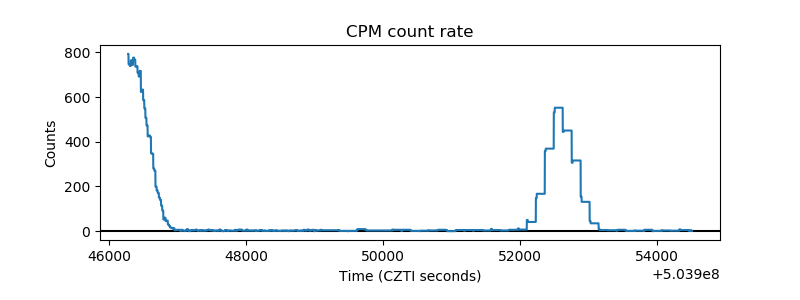 |
| CZT Counter | 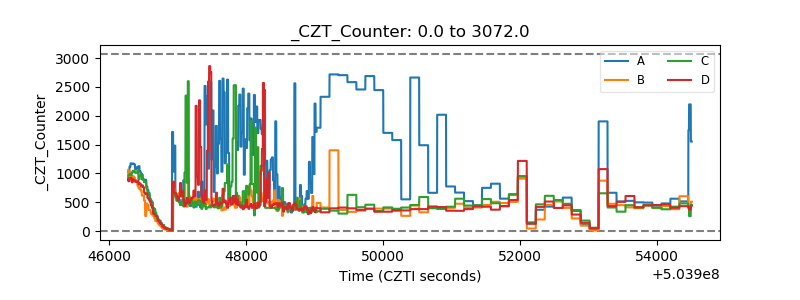 |
| +2.5 Volts monitor |  |
| +5 Volts monitor | 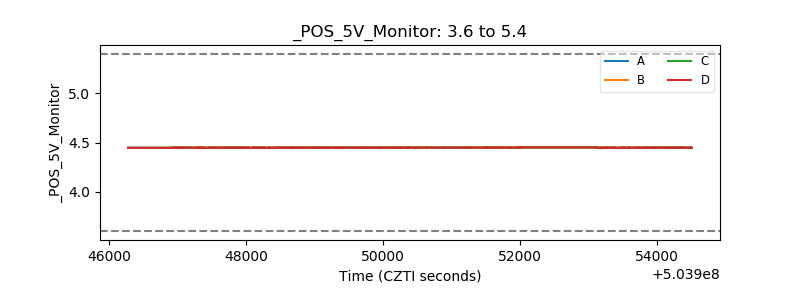 |
| _ROLL_ROT | 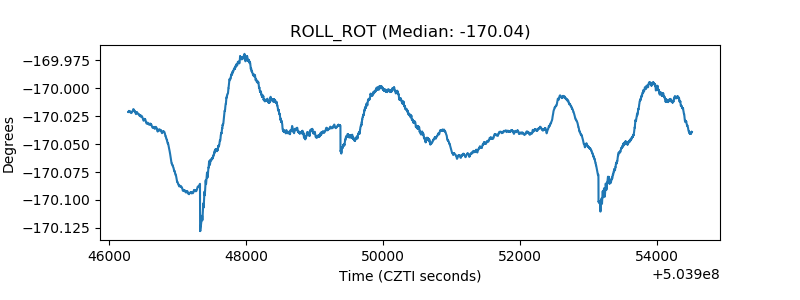 |
| _Roll_DEC | 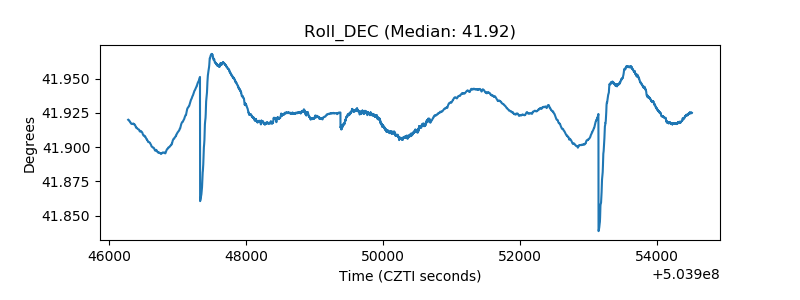 |
| _Roll_RA | 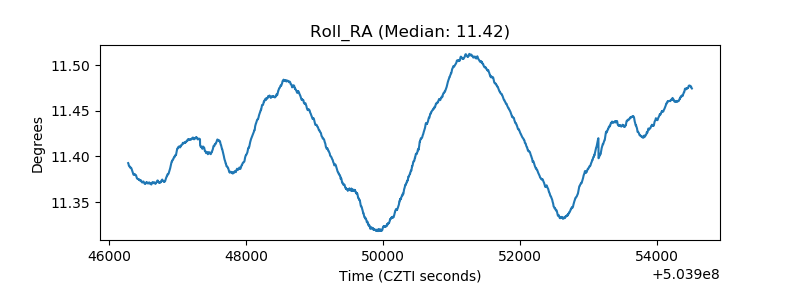 |
| Veto Counter | 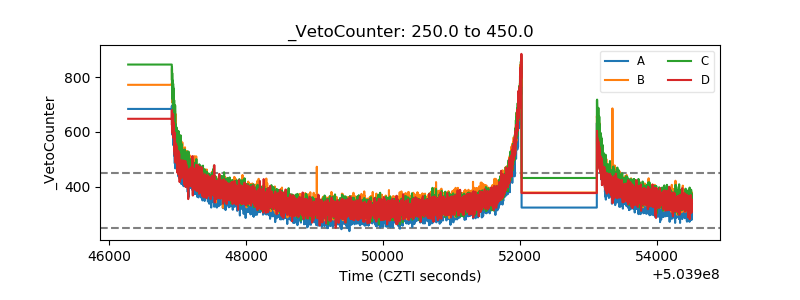 |