| Param | Original file | Final file |
|---|---|---|
| Filename | modeM0/AS1A14_009T01_9000006534_55347cztM0_level2.fits | modeM0/AS1A14_009T01_9000006534_55347cztM0_level2_quad_clean.evt |
| Size (bytes) | 446,921,280 | 91,396,800 |
| Size | 426.2 MB | 87.2 MB |
| Events in quadrant A | 3,278,444 | 598,033 |
| Events in quadrant B | 3,554,730 | 602,631 |
| Events in quadrant C | 3,732,528 | 569,648 |
| Events in quadrant D | 5,431,007 | 506,822 |
| Mode SS | |||
|---|---|---|---|
| Quadrant | BADHDUFLAG | Total packets | Discarded packets |
| A | 0 | 144 | 0 |
| B | 0 | 144 | 0 |
| C | 0 | 144 | 0 |
| D | 0 | 144 | 0 |
| Mode M0 | |||
|---|---|---|---|
| Quadrant | BADHDUFLAG | Total packets | Discarded packets |
| A | 0 | 15036 | 2 |
| B | 0 | 15929 | 2 |
| C | 0 | 16302 | 2 |
| D | 0 | 21395 | 2 |
| Mode M9 | |||
|---|---|---|---|
| Quadrant | BADHDUFLAG | Total packets | Discarded packets |
| A | 0 | 8 | 0 |
| B | 0 | 8 | 0 |
| C | 0 | 9 | 0 |
| D | 0 | 9 | 0 |
| Quadrant | Total seconds | Saturated seconds | Saturation percentage |
|---|---|---|---|
| A | 7032 | 66 | 0.938567% |
| B | 7032 | 120 | 1.706485% |
| C | 7032 | 75 | 1.066553% |
| D | 7032 | 529 | 7.522753% |
Noise dominated data is calculated using 1-second bins in cleaned event files. If a bin has >2000 counts, and if more than 50% of those come from <1% of pixels, then it is considered to be noise-dominated and hence unusable.
| Quadrant | # 1 sec bins | Bins with >0 counts | Bins with >2000 counts | High rate bins dominated by noise | Noise dominated (total time) | Noise dominated (detector-on time) | Marked lightcurve |
|---|---|---|---|---|---|---|---|
| A | 7967 | 7308 | 11 | 11 | 0.14% | 0.15% | 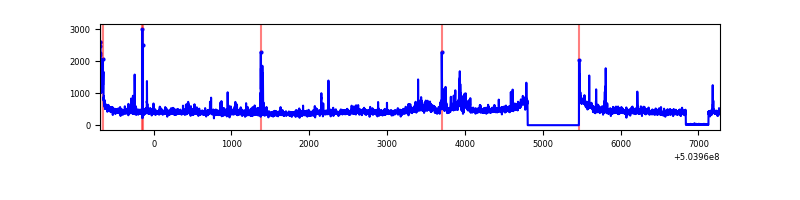 |
| B | 7967 | 7308 | 26 | 26 | 0.33% | 0.36% | 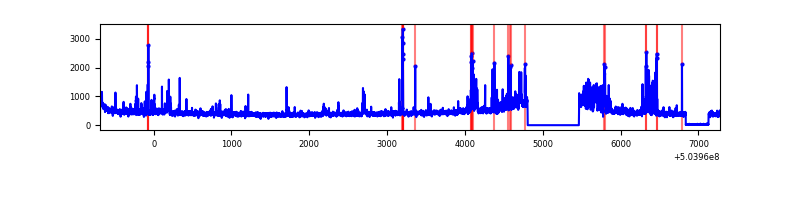 |
| C | 7967 | 7308 | 50 | 50 | 0.63% | 0.68% | 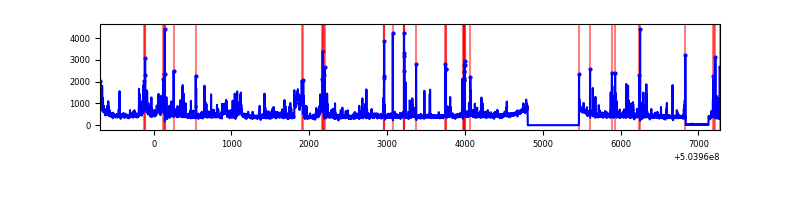 |
| D | 7967 | 7308 | 461 | 461 | 5.79% | 6.31% | 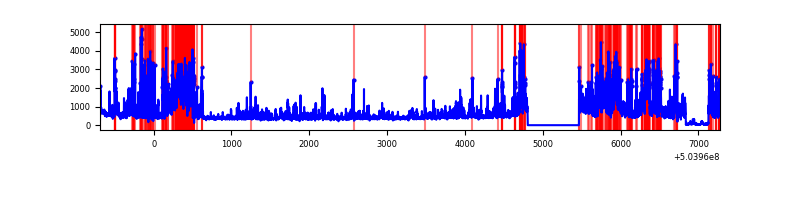 |
Top three noisy pixels from each quadrant. If the there are fewer than three noisy pixels in the level2.evt file, extra rows are filled as -1
| Pixel properties | Quadrant properties | ||||||
|---|---|---|---|---|---|---|---|
| Quadrant | DetID | PixID | Counts | Sigma | Mean | Median | Sigma |
| A | 3 | 78 | 125200 | 686.42 | 732 | 712 | 181.4 |
| A | 12 | 115 | 121894 | 668.19 | 732 | 712 | 181.4 |
| A | 12 | 18 | 40756 | 220.8 | 732 | 712 | 181.4 |
| B | 0 | 199 | 299043 | 1902.37 | 728 | 700 | 156.8 |
| B | 5 | 185 | 201111 | 1277.91 | 728 | 700 | 156.8 |
| B | 10 | 247 | 69552 | 439.03 | 728 | 700 | 156.8 |
| C | 9 | 38 | 380696 | 1935.97 | 722 | 717 | 196.3 |
| C | 12 | 249 | 206692 | 1049.43 | 722 | 717 | 196.3 |
| C | 13 | 3 | 96480 | 487.91 | 722 | 717 | 196.3 |
| D | 11 | 129 | 1585803 | 8049.29 | 700 | 670 | 196.9 |
| D | 10 | 199 | 413101 | 2094.32 | 700 | 670 | 196.9 |
| D | 11 | 176 | 192658 | 974.91 | 700 | 670 | 196.9 |
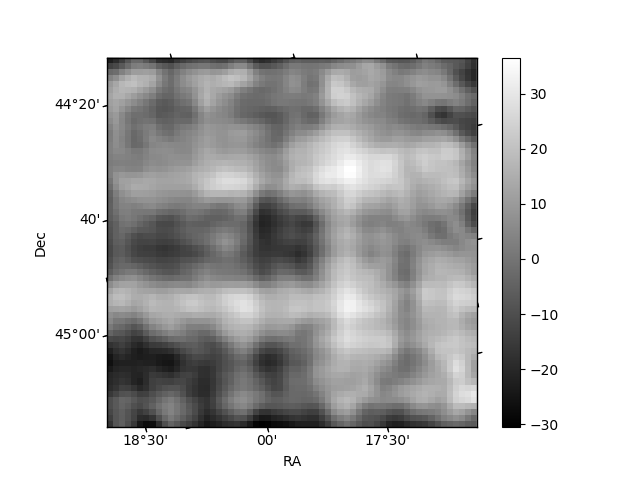
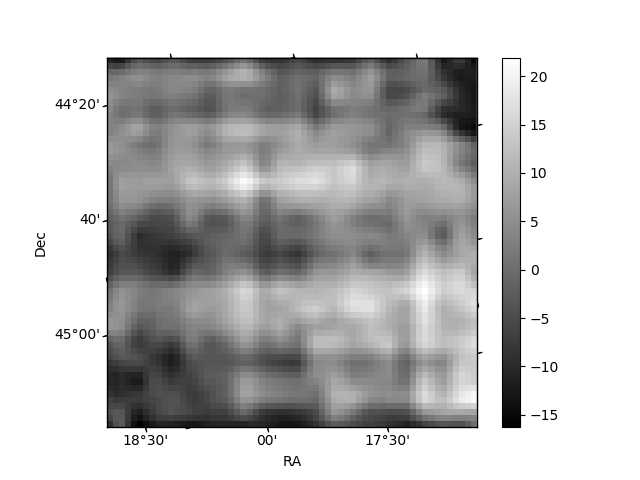
Histogram calculated using DETX and DETY for each event in the final _common_clean file
| Quadrant A | 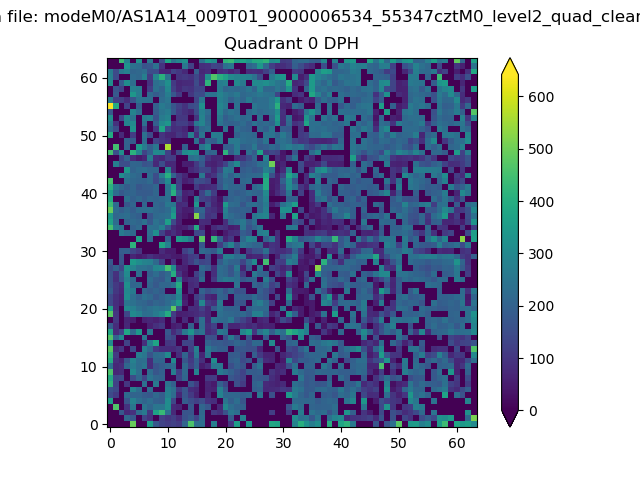 |
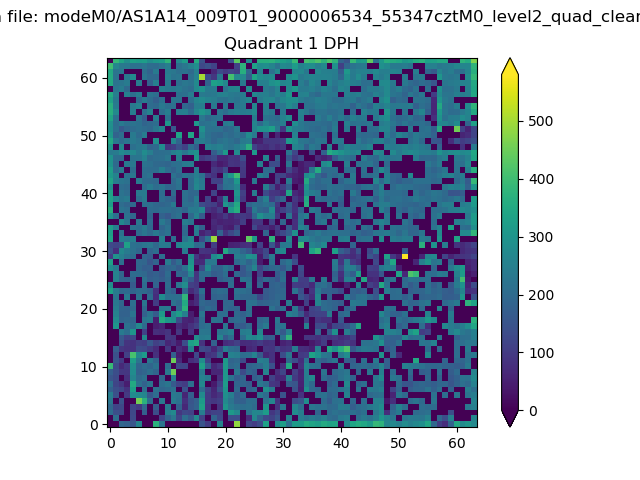 |
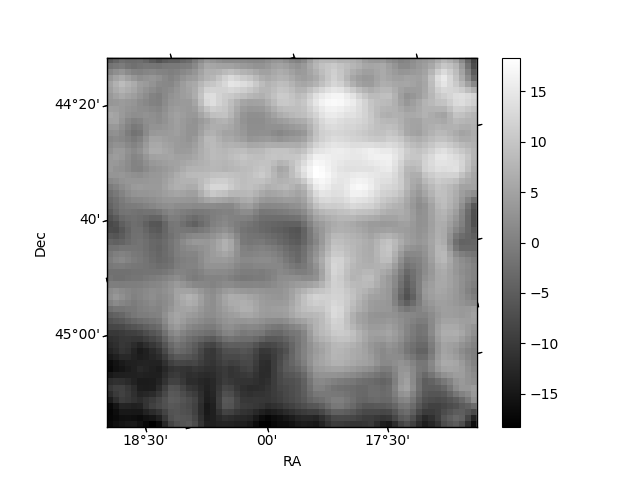
Quadrant B |
|---|---|---|---|
| Quadrant D | 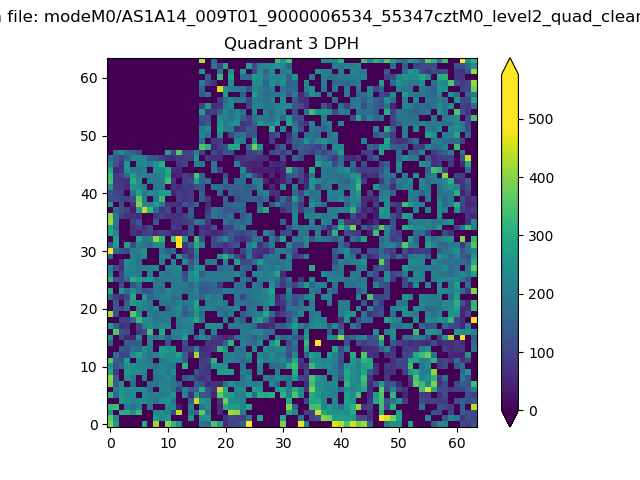 |
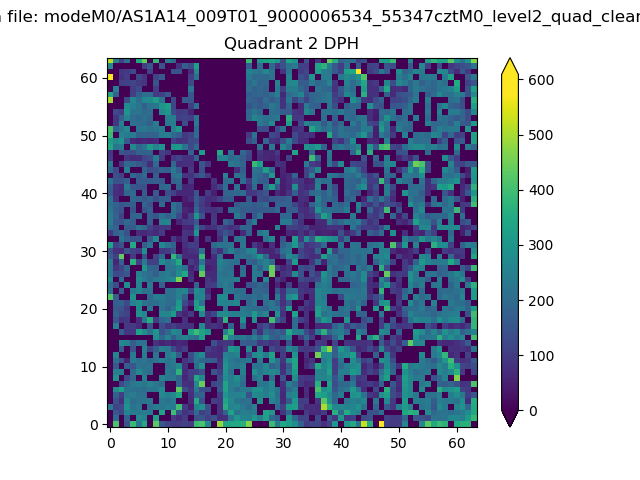 |
Quadrant C |
| Plot type | Count rate plots | Images |
|---|---|---|
| Comparison with Poisson distribution Blue bars denote a histogram of data divided into 1 sec bins. Red curve is a Poisson curve with rate = median count rate of data. |
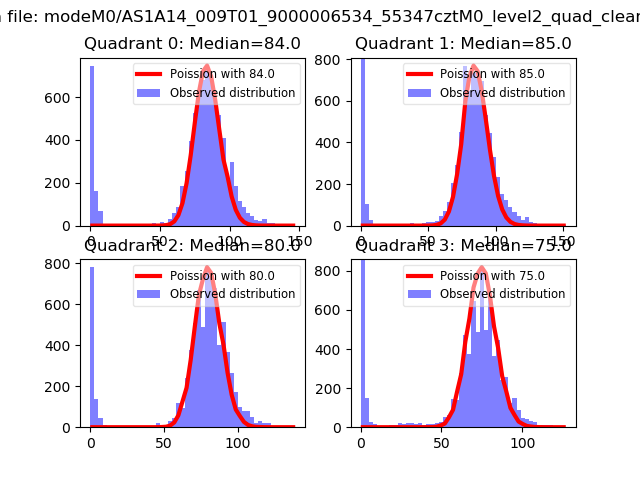 |
 |
| Quadrant-wise count rates Data is divided into 100 sec bins |
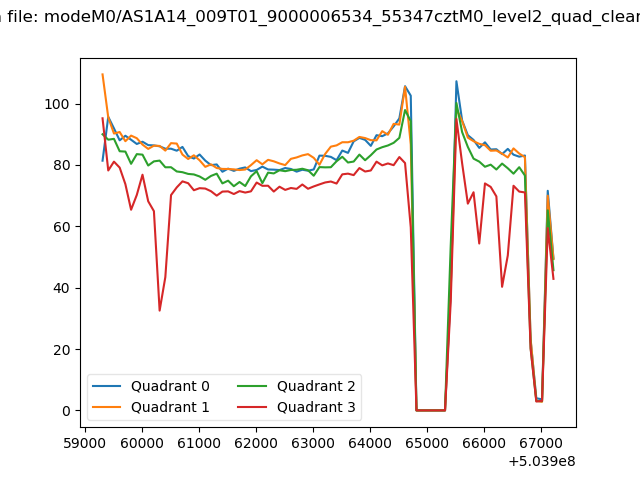 |
|
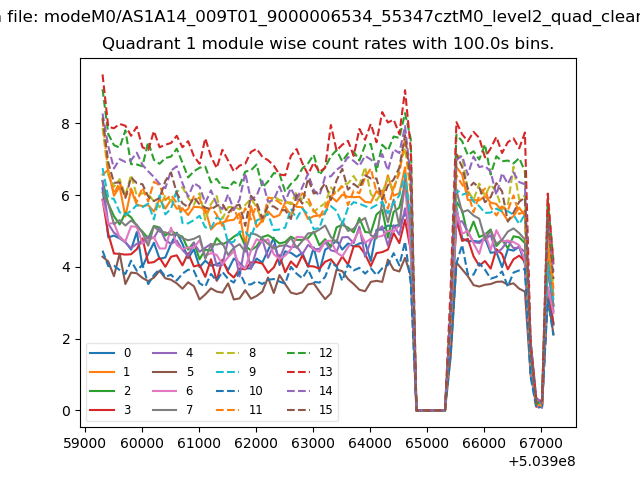
| Module-wise count rates for Quadrant A Data is divided into 100 sec bins |
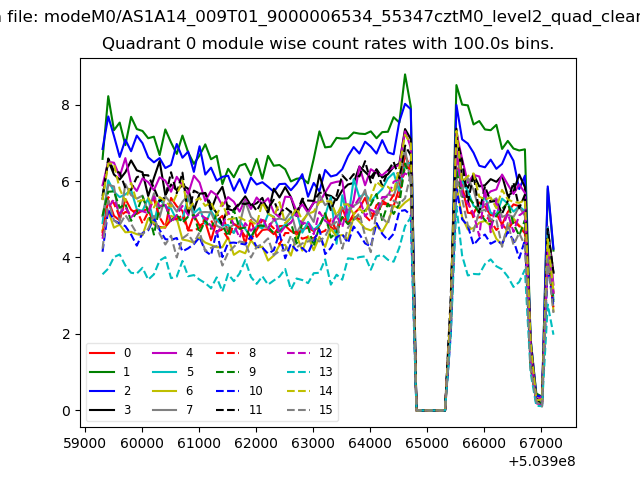 |
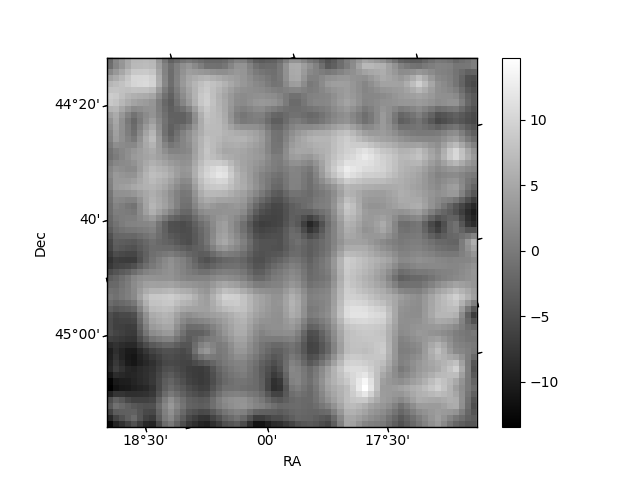 |
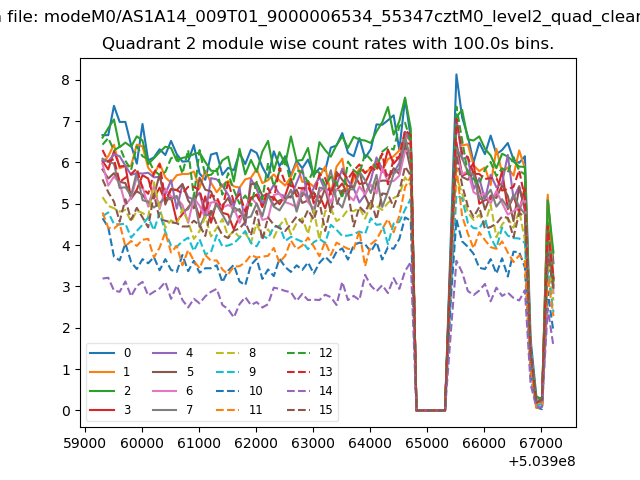
| Module-wise count rates for Quadrant B Data is divided into 100 sec bins |
 |
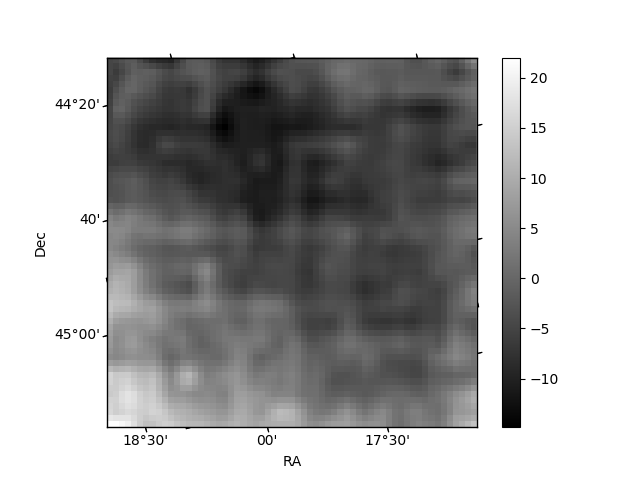 |
| Module-wise count rates for Quadrant C Data is divided into 100 sec bins |
 |
 |
| Module-wise count rates for Quadrant D Data is divided into 100 sec bins |
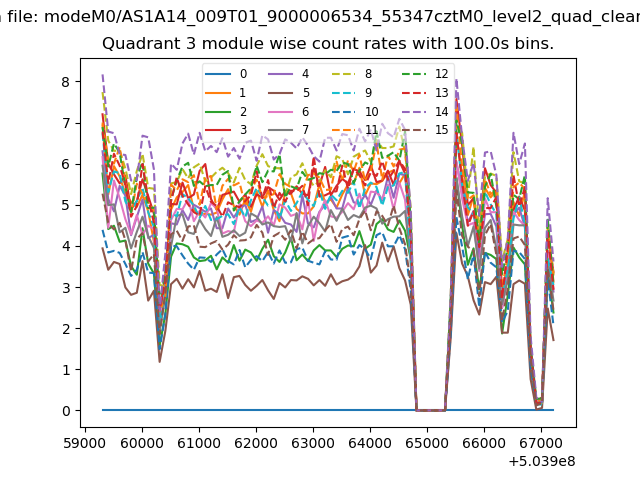 |
 |
| Parameter | Plot |
|---|---|
| CZT HV Monitor | 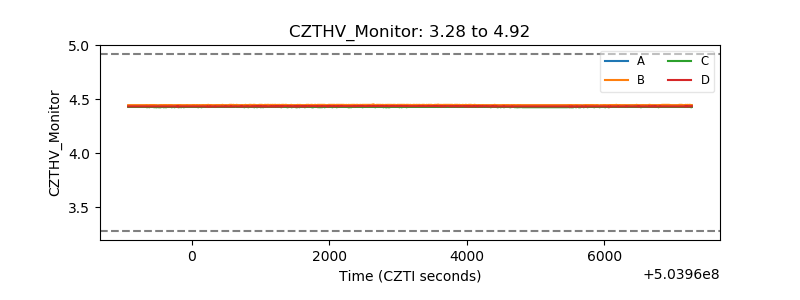 |
| D_VDD | 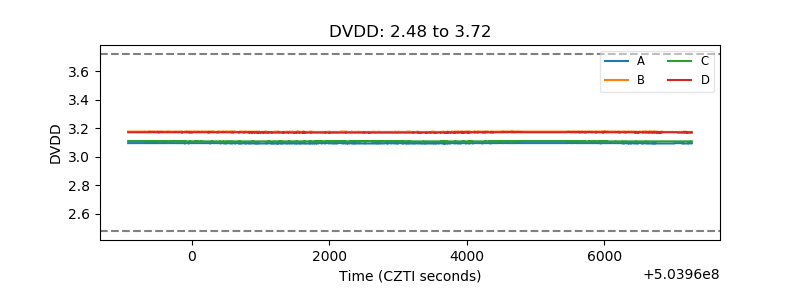 |
| Temperature 1 | 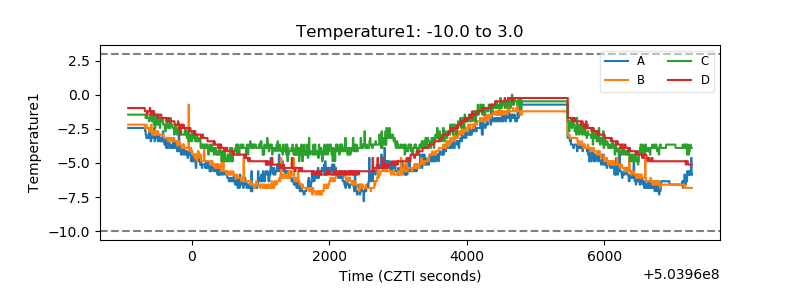 |
| Veto HV Monitor | 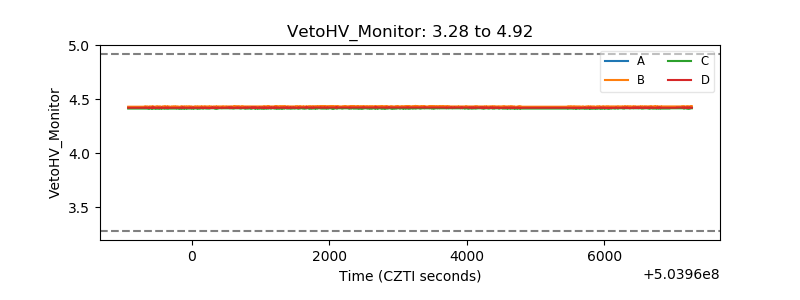 |
| Veto LLD | 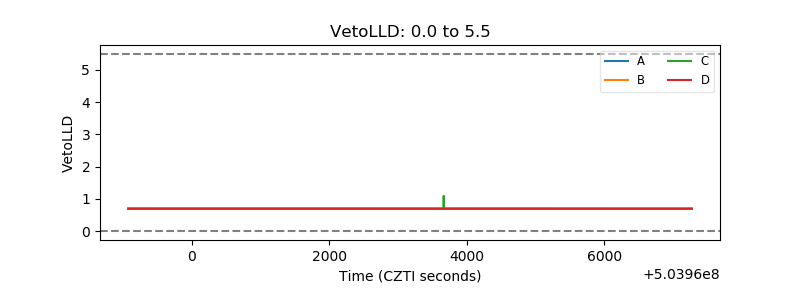 |
| Alpha Counter | 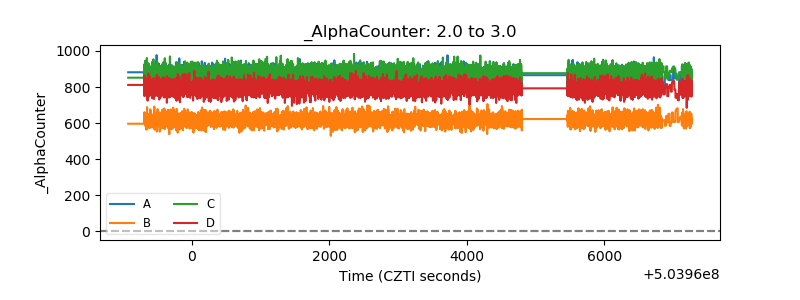 |
| _CPM_Rate | 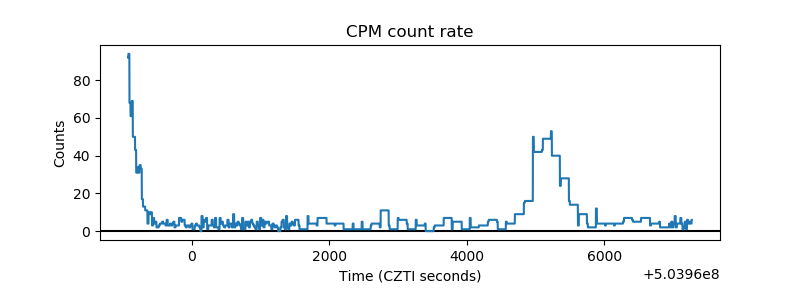 |
| CZT Counter | 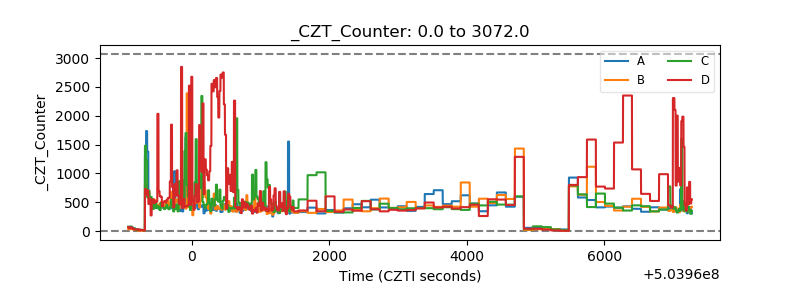 |
| +2.5 Volts monitor |  |
| +5 Volts monitor |  |
| _ROLL_ROT | 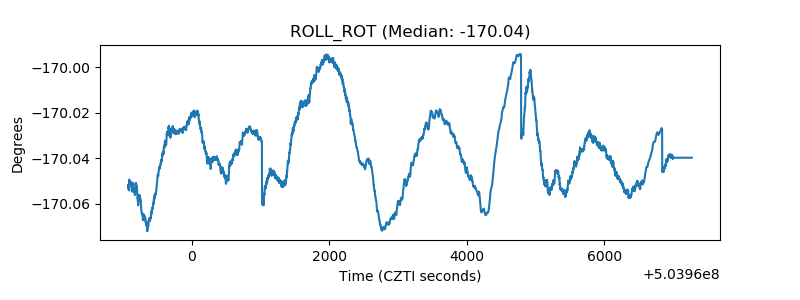 |
| _Roll_DEC | 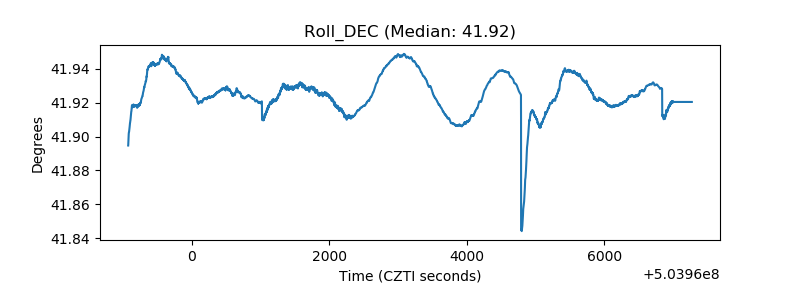 |
| _Roll_RA | 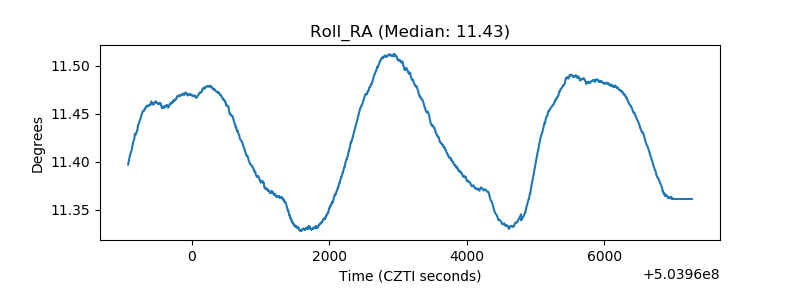 |
| Veto Counter | 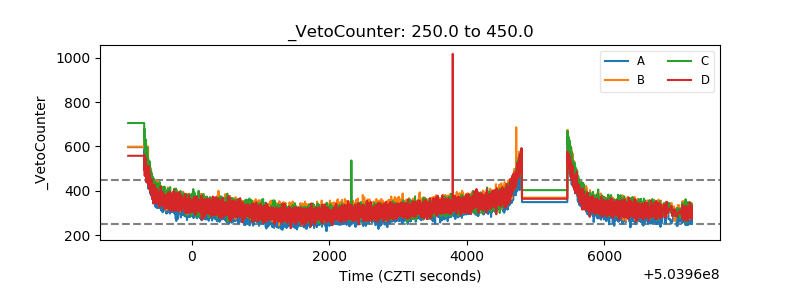 |