| Param | Original file | Final file |
|---|---|---|
| Filename | modeM0/AS1A14_009T01_9000006534_55348cztM0_level2.fits | modeM0/AS1A14_009T01_9000006534_55348cztM0_level2_quad_clean.evt |
| Size (bytes) | 557,513,280 | 115,934,400 |
| Size | 531.7 MB | 110.6 MB |
| Events in quadrant A | 3,956,831 | 768,024 |
| Events in quadrant B | 4,046,389 | 815,582 |
| Events in quadrant C | 4,002,784 | 744,974 |
| Events in quadrant D | 7,994,997 | 612,249 |
| Mode SS | |||
|---|---|---|---|
| Quadrant | BADHDUFLAG | Total packets | Discarded packets |
| A | 0 | 168 | 0 |
| B | 0 | 168 | 0 |
| C | 0 | 168 | 0 |
| D | 0 | 168 | 0 |
| Mode M0 | |||
|---|---|---|---|
| Quadrant | BADHDUFLAG | Total packets | Discarded packets |
| A | 0 | 18024 | 0 |
| B | 0 | 18357 | 0 |
| C | 0 | 18294 | 0 |
| D | 0 | 29583 | 0 |
| Mode M9 | |||
|---|---|---|---|
| Quadrant | BADHDUFLAG | Total packets | Discarded packets |
| A | 0 | 7 | 0 |
| B | 0 | 7 | 0 |
| C | 0 | 7 | 0 |
| D | 0 | 7 | 0 |
| Quadrant | Total seconds | Saturated seconds | Saturation percentage |
|---|---|---|---|
| A | 8191 | 111 | 1.355146% |
| B | 8192 | 197 | 2.404785% |
| C | 8192 | 75 | 0.915527% |
| D | 8191 | 1108 | 13.527042% |
Noise dominated data is calculated using 1-second bins in cleaned event files. If a bin has >2000 counts, and if more than 50% of those come from <1% of pixels, then it is considered to be noise-dominated and hence unusable.
| Quadrant | # 1 sec bins | Bins with >0 counts | Bins with >2000 counts | High rate bins dominated by noise | Noise dominated (total time) | Noise dominated (detector-on time) | Marked lightcurve |
|---|---|---|---|---|---|---|---|
| A | 8886 | 8194 | 37 | 37 | 0.42% | 0.45% | 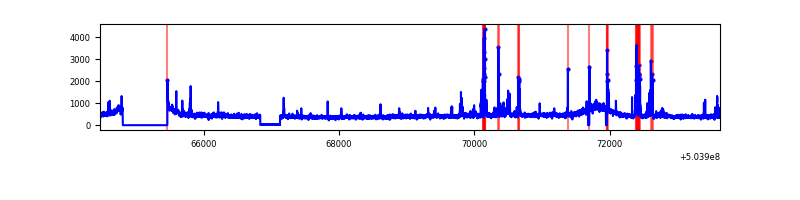 |
| B | 8887 | 8195 | 19 | 19 | 0.21% | 0.23% | 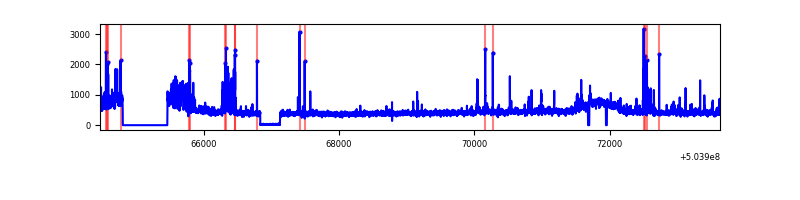 |
| C | 8887 | 8195 | 42 | 42 | 0.47% | 0.51% | 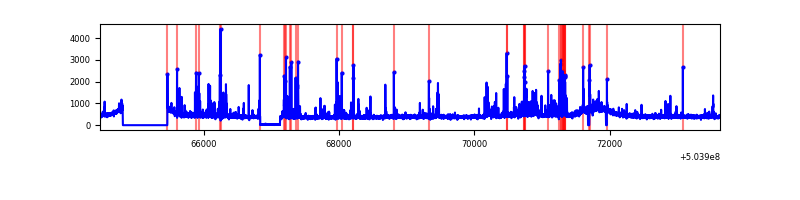 |
| D | 8886 | 8194 | 883 | 883 | 9.94% | 10.78% | 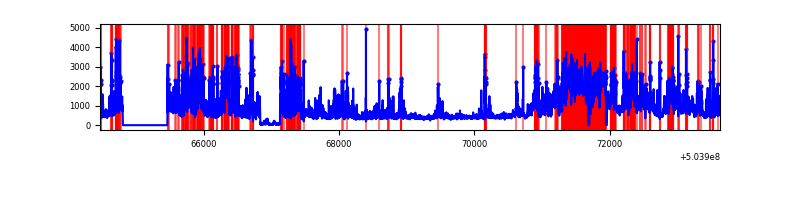 |
Top three noisy pixels from each quadrant. If the there are fewer than three noisy pixels in the level2.evt file, extra rows are filled as -1
| Pixel properties | Quadrant properties | ||||||
|---|---|---|---|---|---|---|---|
| Quadrant | DetID | PixID | Counts | Sigma | Mean | Median | Sigma |
| A | 0 | 8 | 211850 | 971.83 | 885 | 858 | 217.1 |
| A | 3 | 78 | 118367 | 541.25 | 885 | 858 | 217.1 |
| A | 3 | 128 | 36188 | 162.73 | 885 | 858 | 217.1 |
| B | 0 | 199 | 248169 | 1303.15 | 878 | 842 | 189.8 |
| B | 5 | 185 | 174258 | 913.72 | 878 | 842 | 189.8 |
| B | 0 | 182 | 33791 | 173.61 | 878 | 842 | 189.8 |
| C | 12 | 252 | 118548 | 495.65 | 873 | 864 | 237.4 |
| C | 9 | 38 | 118356 | 494.84 | 873 | 864 | 237.4 |
| C | 13 | 3 | 116306 | 486.21 | 873 | 864 | 237.4 |
| D | 11 | 129 | 3321476 | 14526.69 | 811 | 777 | 228.6 |
| D | 3 | 12 | 397687 | 1736.32 | 811 | 777 | 228.6 |
| D | 11 | 176 | 330258 | 1441.34 | 811 | 777 | 228.6 |
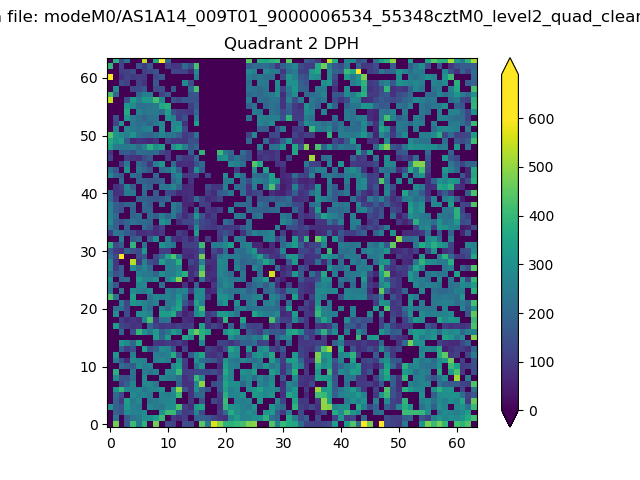
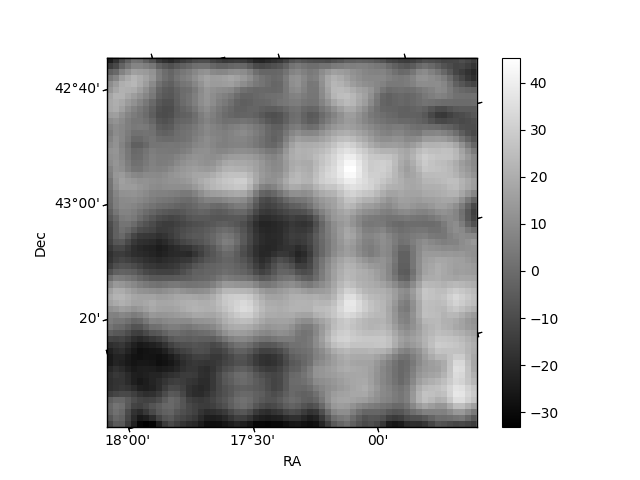
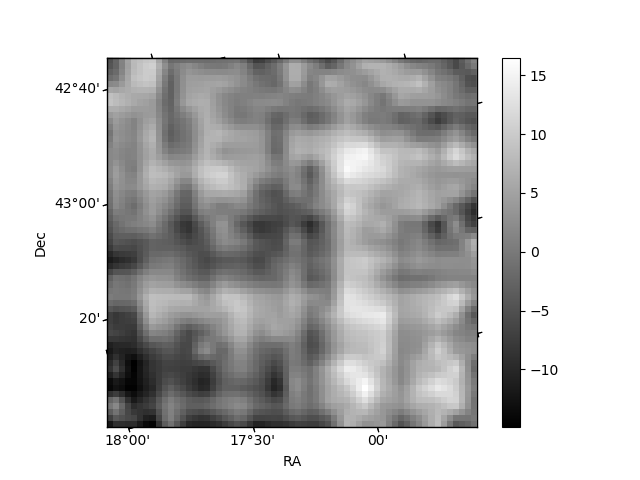
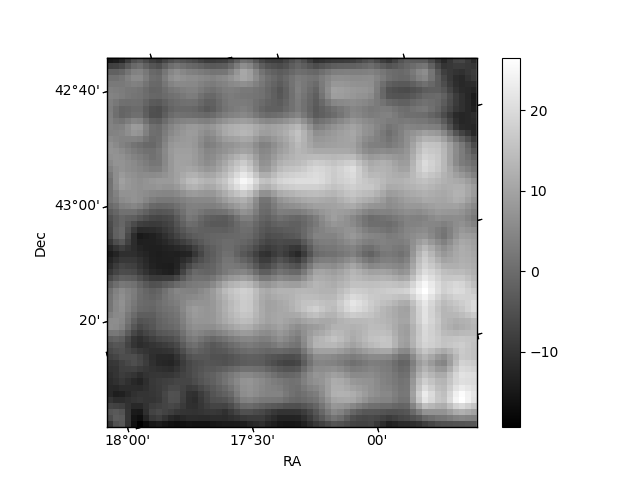
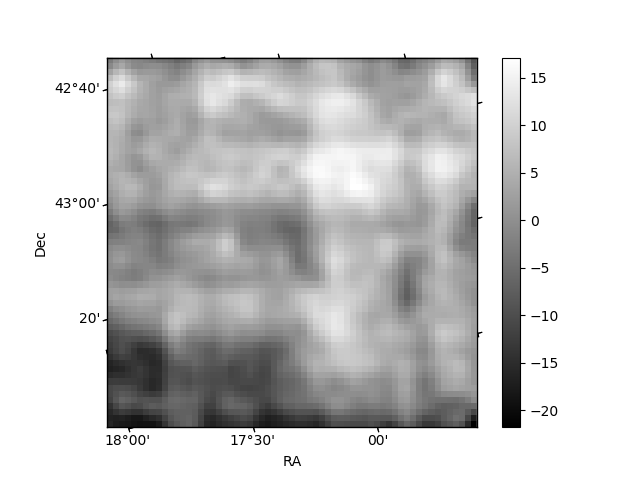
Histogram calculated using DETX and DETY for each event in the final _common_clean file
| Quadrant A | 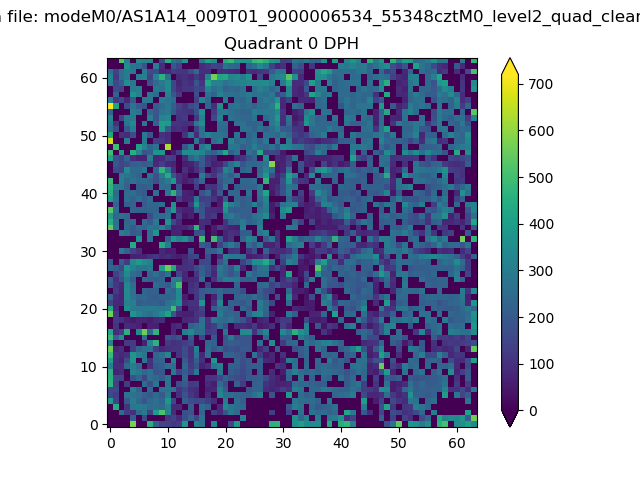 |
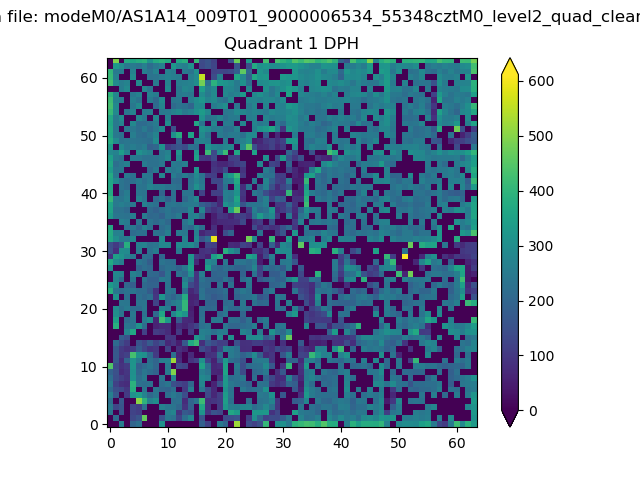 |
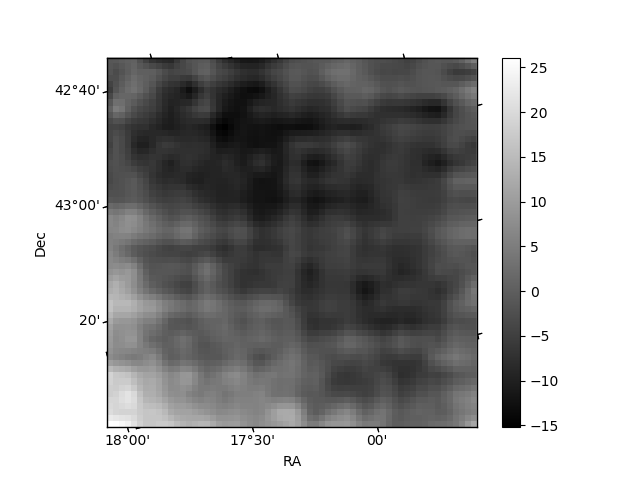
Quadrant B |
|---|---|---|---|
| Quadrant D | 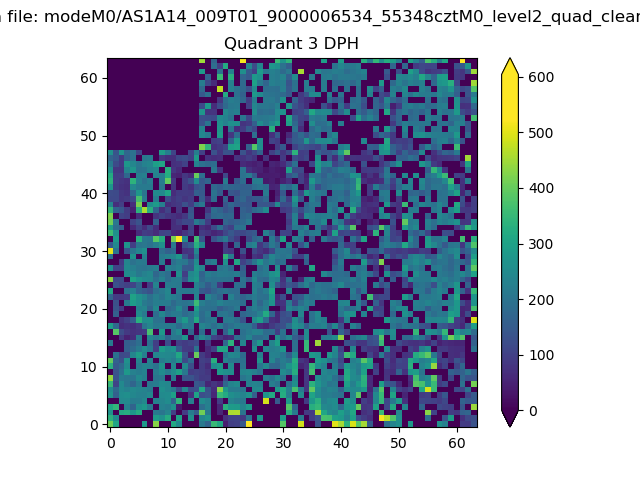 |
 |
Quadrant C |
| Plot type | Count rate plots | Images |
|---|---|---|
| Comparison with Poisson distribution Blue bars denote a histogram of data divided into 1 sec bins. Red curve is a Poisson curve with rate = median count rate of data. |
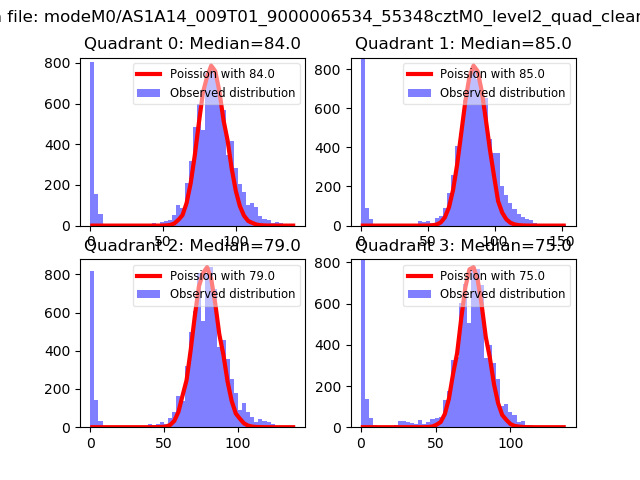 |
 |
| Quadrant-wise count rates Data is divided into 100 sec bins |
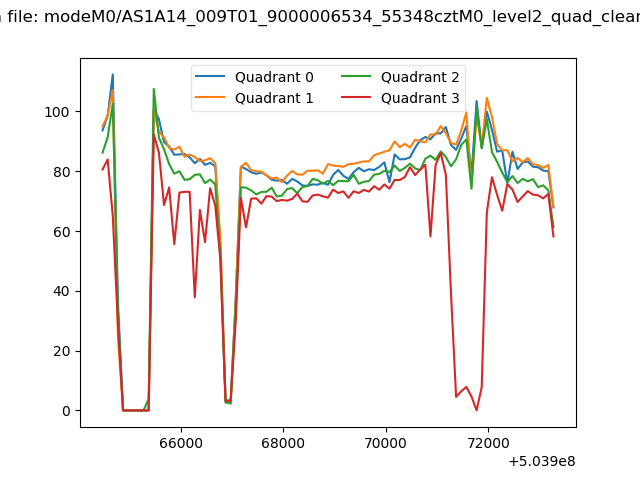 |
|
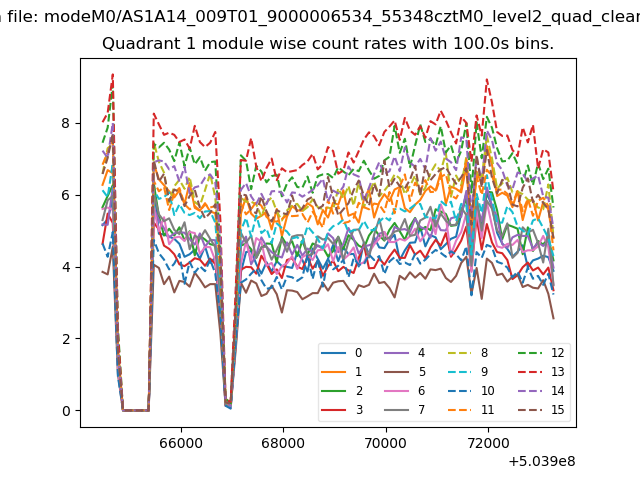
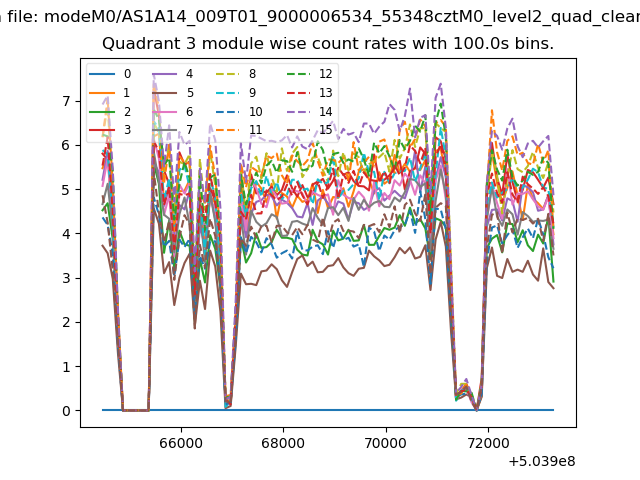
| Module-wise count rates for Quadrant A Data is divided into 100 sec bins |
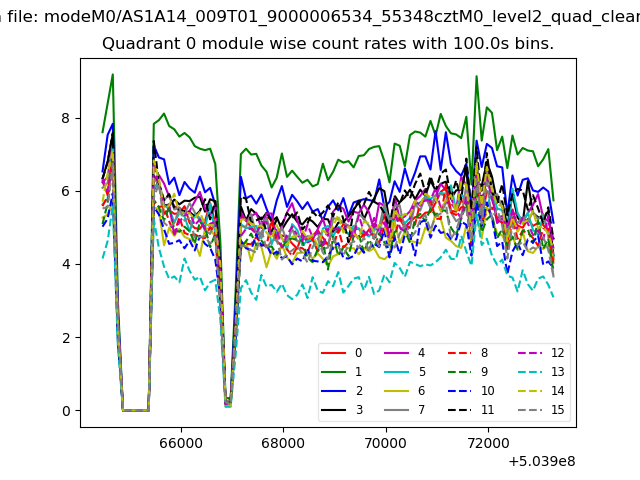 |
 |
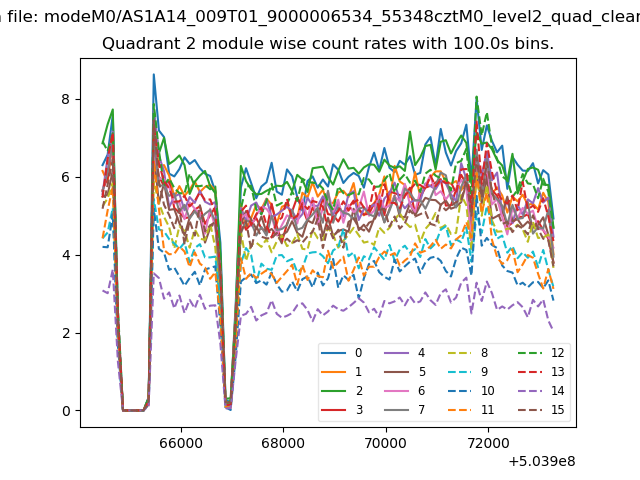
| Module-wise count rates for Quadrant B Data is divided into 100 sec bins |
 |
 |
| Module-wise count rates for Quadrant C Data is divided into 100 sec bins |
 |
 |
| Module-wise count rates for Quadrant D Data is divided into 100 sec bins |
 |
 |
| Parameter | Plot |
|---|---|
| CZT HV Monitor |  |
| D_VDD | 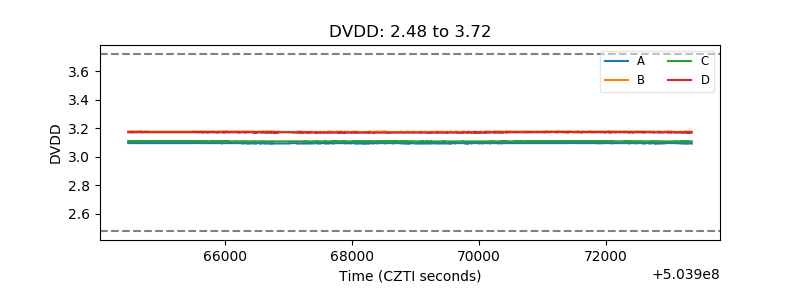 |
| Temperature 1 | 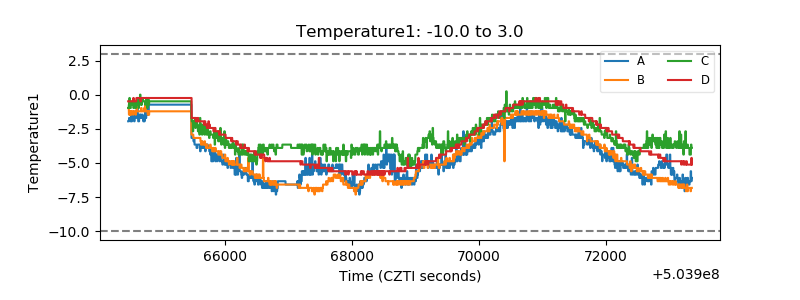 |
| Veto HV Monitor | 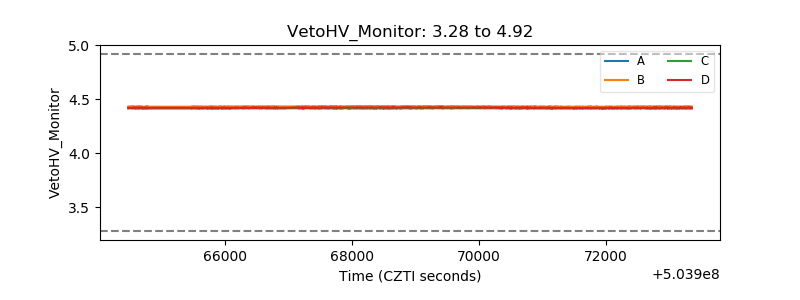 |
| Veto LLD | 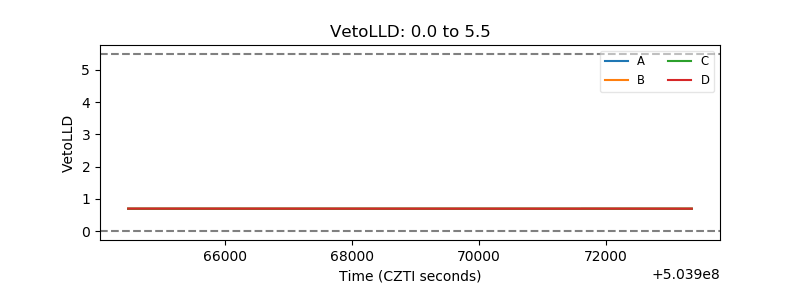 |
| Alpha Counter | 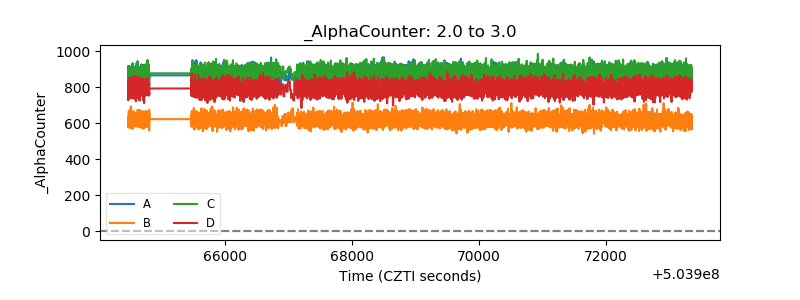 |
| _CPM_Rate |  |
| CZT Counter | 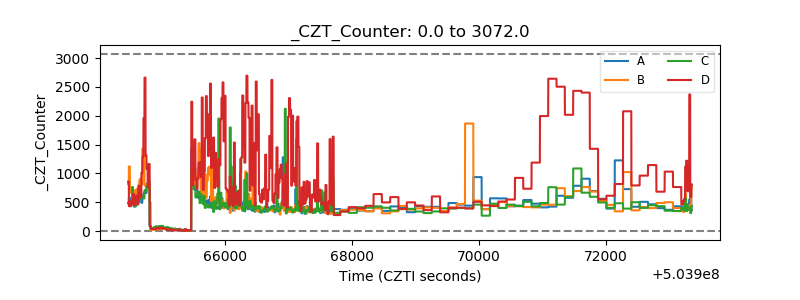 |
| +2.5 Volts monitor | 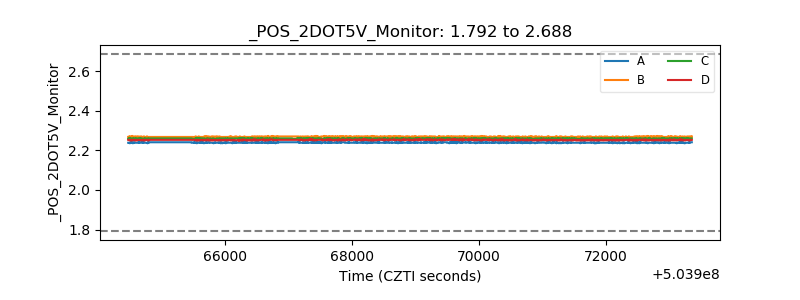 |
| +5 Volts monitor | 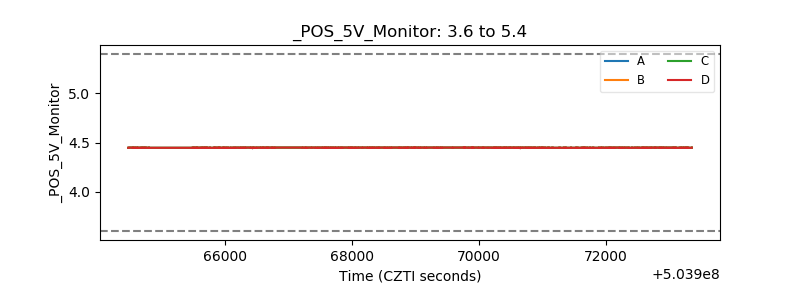 |
| _ROLL_ROT | 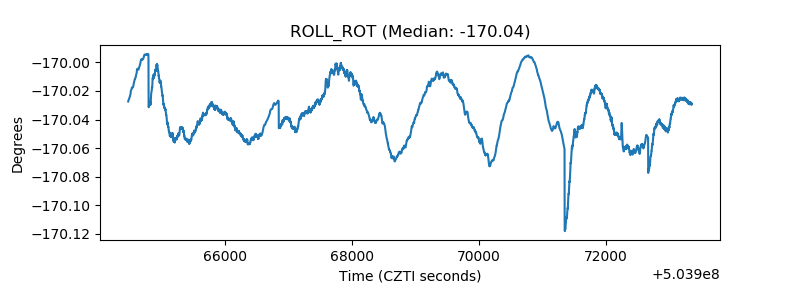 |
| _Roll_DEC | 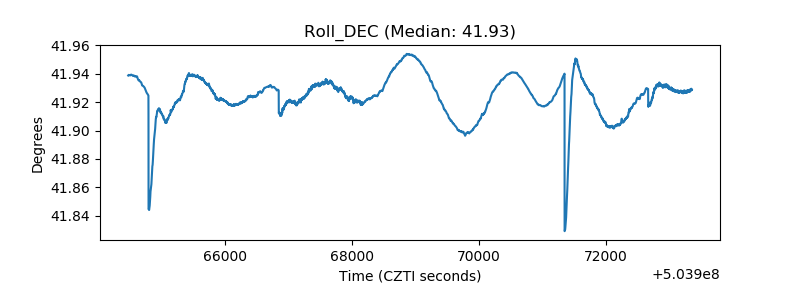 |
| _Roll_RA | 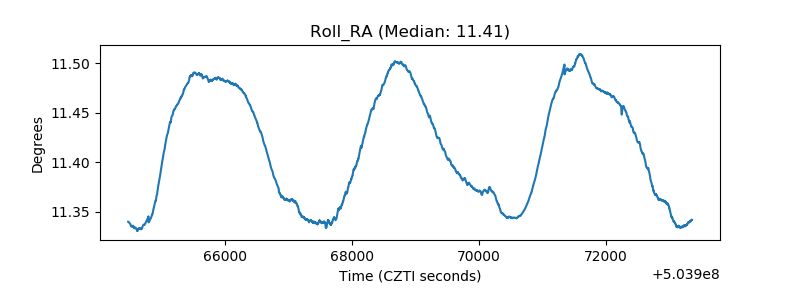 |
| Veto Counter | 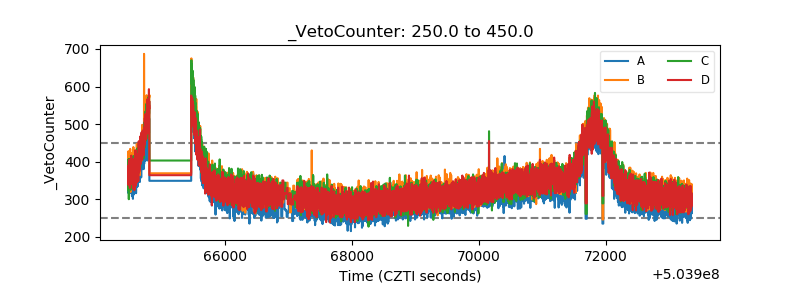 |