| Param | Original file | Final file |
|---|---|---|
| Filename | modeM0/AS1A14_009T01_9000006534_55349cztM0_level2.fits | modeM0/AS1A14_009T01_9000006534_55349cztM0_level2_quad_clean.evt |
| Size (bytes) | 591,099,840 | 124,522,560 |
| Size | 563.7 MB | 118.8 MB |
| Events in quadrant A | 4,164,551 | 817,589 |
| Events in quadrant B | 4,295,183 | 877,646 |
| Events in quadrant C | 5,063,667 | 785,299 |
| Events in quadrant D | 7,671,448 | 676,669 |
| Mode SS | |||
|---|---|---|---|
| Quadrant | BADHDUFLAG | Total packets | Discarded packets |
| A | 0 | 178 | 0 |
| B | 0 | 178 | 0 |
| C | 0 | 178 | 0 |
| D | 0 | 178 | 0 |
| Mode M0 | |||
|---|---|---|---|
| Quadrant | BADHDUFLAG | Total packets | Discarded packets |
| A | 0 | 19242 | 2 |
| B | 0 | 19531 | 2 |
| C | 0 | 21781 | 2 |
| D | 0 | 29110 | 2 |
| Mode M9 | |||
|---|---|---|---|
| Quadrant | BADHDUFLAG | Total packets | Discarded packets |
| A | 0 | 1 | 0 |
| B | 0 | 1 | 0 |
| C | 0 | 1 | 0 |
| D | 0 | 1 | 0 |
| Quadrant | Total seconds | Saturated seconds | Saturation percentage |
|---|---|---|---|
| A | 8834 | 107 | 1.211229% |
| B | 8835 | 121 | 1.369553% |
| C | 8835 | 221 | 2.501415% |
| D | 8834 | 893 | 10.108671% |
Noise dominated data is calculated using 1-second bins in cleaned event files. If a bin has >2000 counts, and if more than 50% of those come from <1% of pixels, then it is considered to be noise-dominated and hence unusable.
| Quadrant | # 1 sec bins | Bins with >0 counts | Bins with >2000 counts | High rate bins dominated by noise | Noise dominated (total time) | Noise dominated (detector-on time) | Marked lightcurve |
|---|---|---|---|---|---|---|---|
| A | 8869 | 8836 | 46 | 46 | 0.52% | 0.52% | 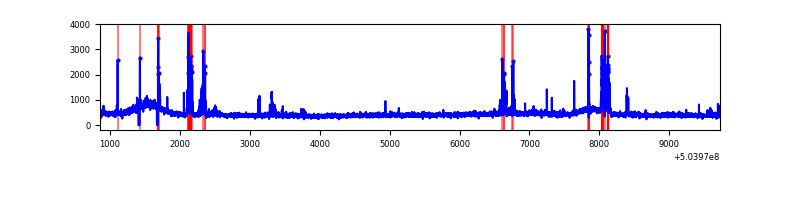 |
| B | 8870 | 8837 | 14 | 14 | 0.16% | 0.16% | 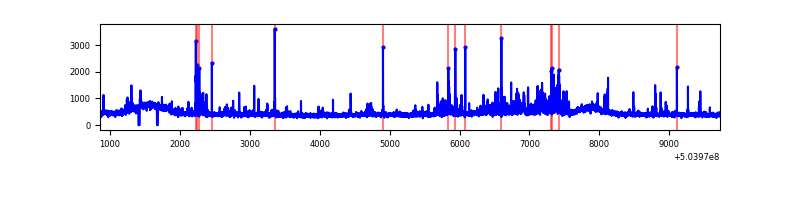 |
| C | 8870 | 8837 | 175 | 175 | 1.97% | 1.98% | 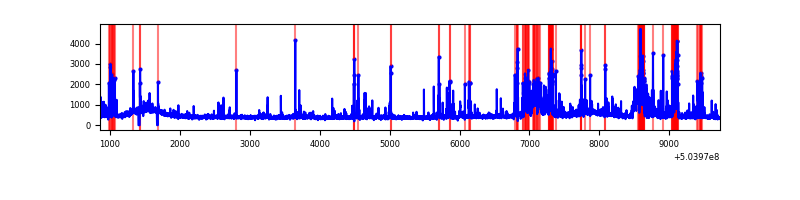 |
| D | 8869 | 8836 | 701 | 701 | 7.90% | 7.93% | 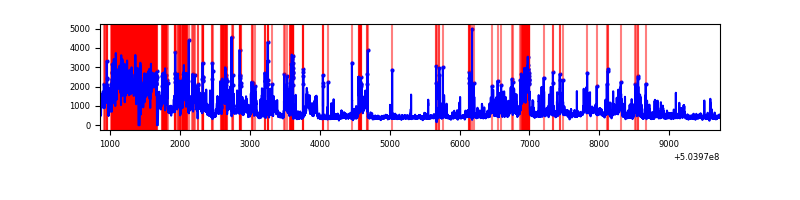 |
Top three noisy pixels from each quadrant. If the there are fewer than three noisy pixels in the level2.evt file, extra rows are filled as -1
| Pixel properties | Quadrant properties | ||||||
|---|---|---|---|---|---|---|---|
| Quadrant | DetID | PixID | Counts | Sigma | Mean | Median | Sigma |
| A | 0 | 8 | 289333 | 1234.61 | 949 | 921 | 233.6 |
| A | 3 | 78 | 43215 | 181.05 | 949 | 921 | 233.6 |
| A | 12 | 3 | 36180 | 150.93 | 949 | 921 | 233.6 |
| B | 0 | 199 | 190631 | 938.8 | 945 | 909 | 202.1 |
| B | 10 | 247 | 174091 | 856.96 | 945 | 909 | 202.1 |
| B | 5 | 185 | 93413 | 457.74 | 945 | 909 | 202.1 |
| C | 9 | 38 | 809829 | 3211.95 | 932 | 918 | 251.8 |
| C | 13 | 3 | 245469 | 971.04 | 932 | 918 | 251.8 |
| C | 12 | 252 | 149006 | 588.01 | 932 | 918 | 251.8 |
| D | 11 | 129 | 3264224 | 13183.81 | 880 | 842 | 247.5 |
| D | 7 | 70 | 319477 | 1287.26 | 880 | 842 | 247.5 |
| D | 2 | 31 | 190069 | 764.46 | 880 | 842 | 247.5 |
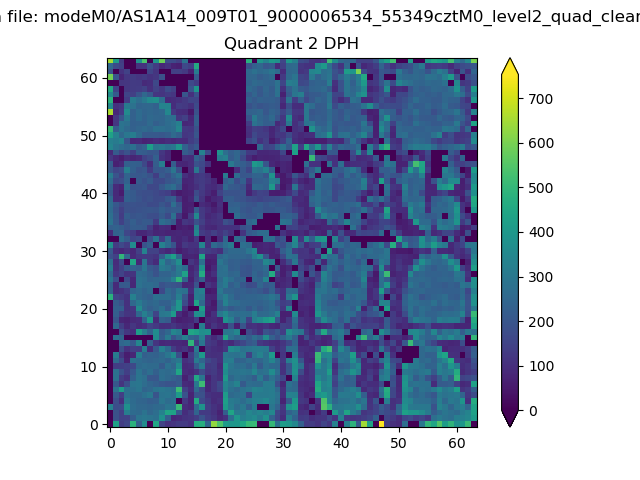
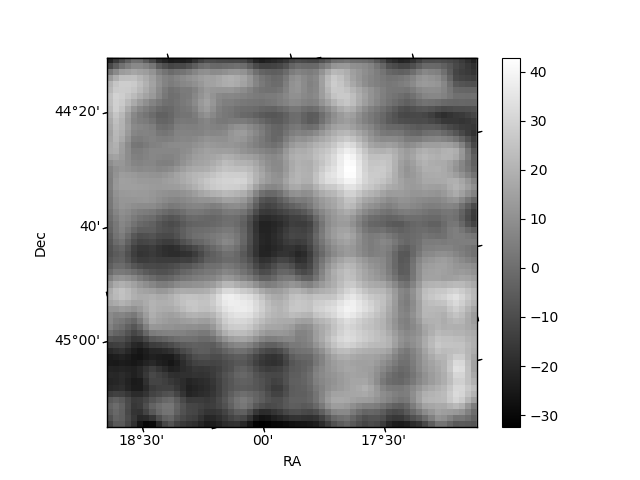
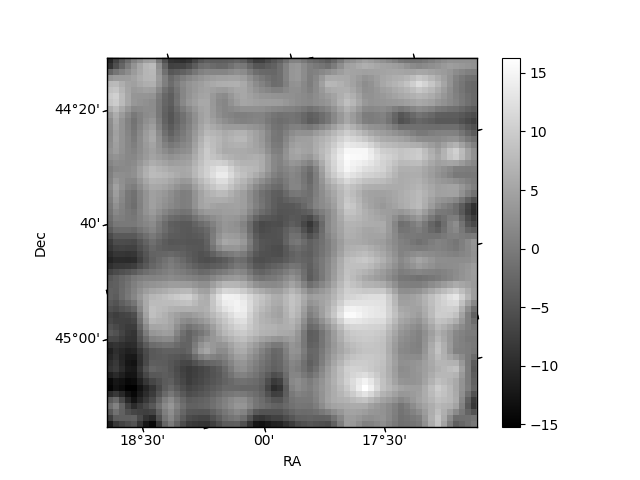
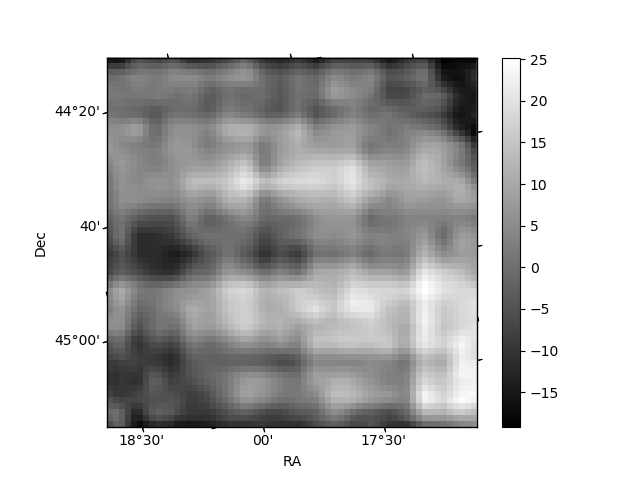
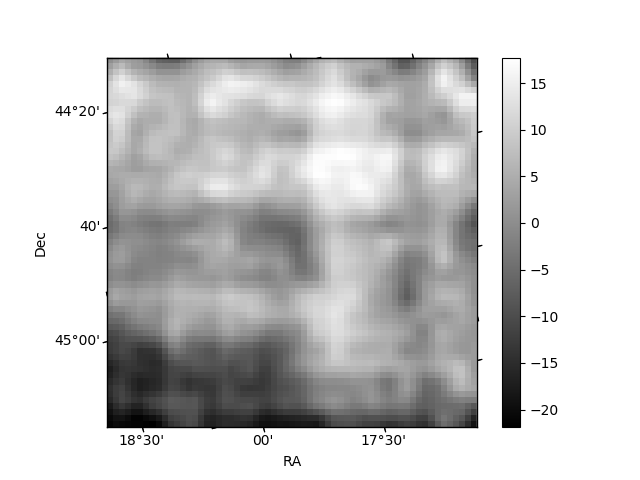
Histogram calculated using DETX and DETY for each event in the final _common_clean file
| Quadrant A | 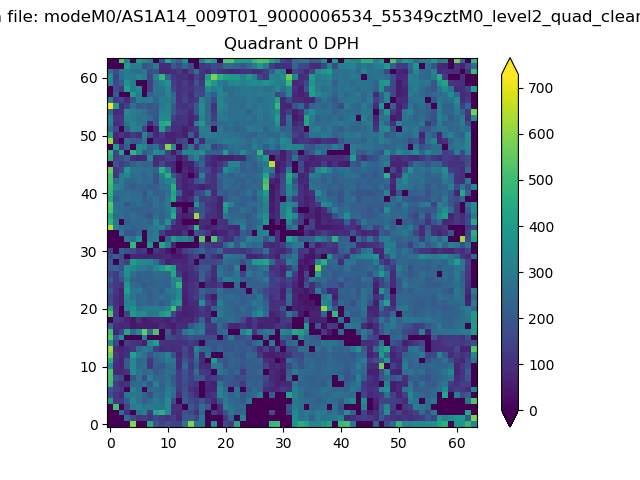 |
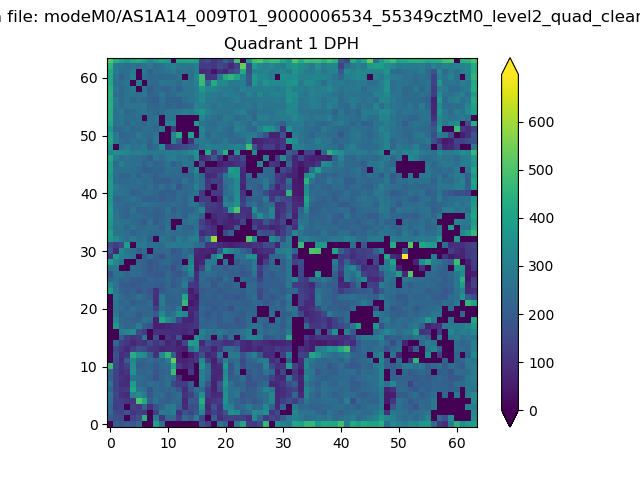 |
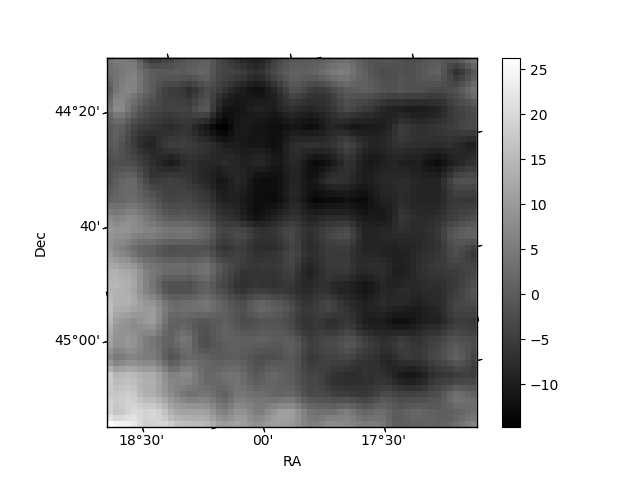
Quadrant B |
|---|---|---|---|
| Quadrant D | 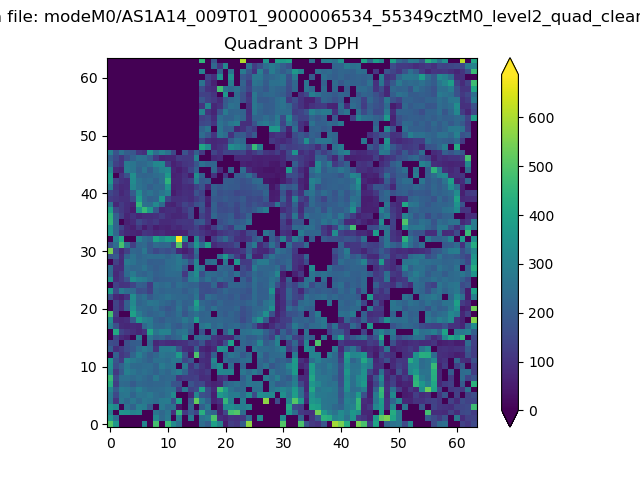 |
 |
Quadrant C |
| Plot type | Count rate plots | Images |
|---|---|---|
| Comparison with Poisson distribution Blue bars denote a histogram of data divided into 1 sec bins. Red curve is a Poisson curve with rate = median count rate of data. |
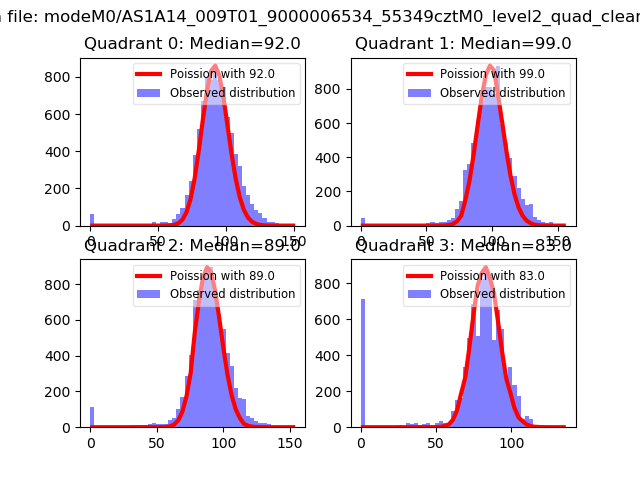 |
 |
| Quadrant-wise count rates Data is divided into 100 sec bins |
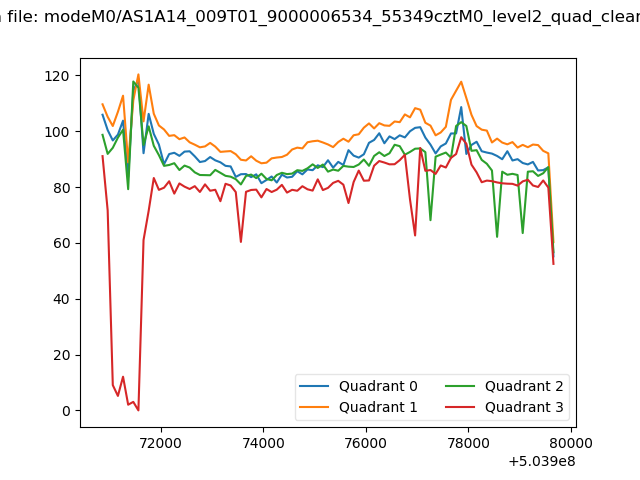 |
|
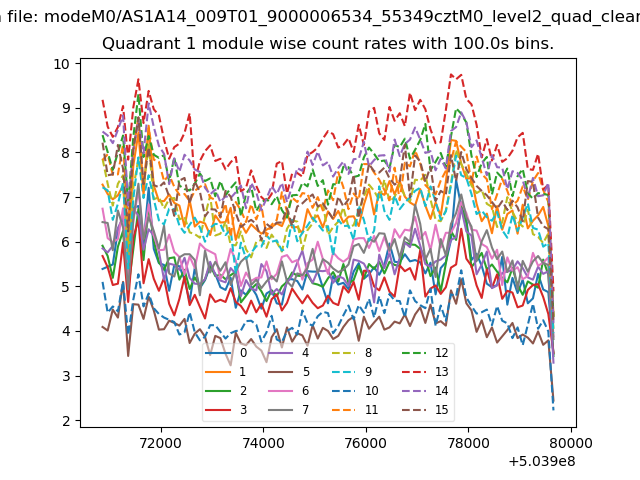
| Module-wise count rates for Quadrant A Data is divided into 100 sec bins |
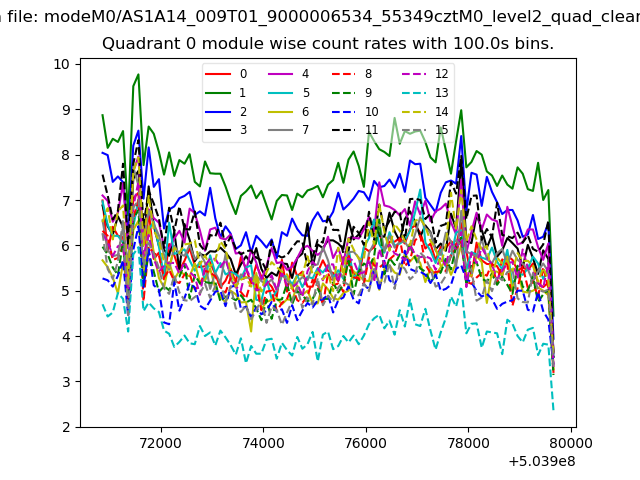 |
 |
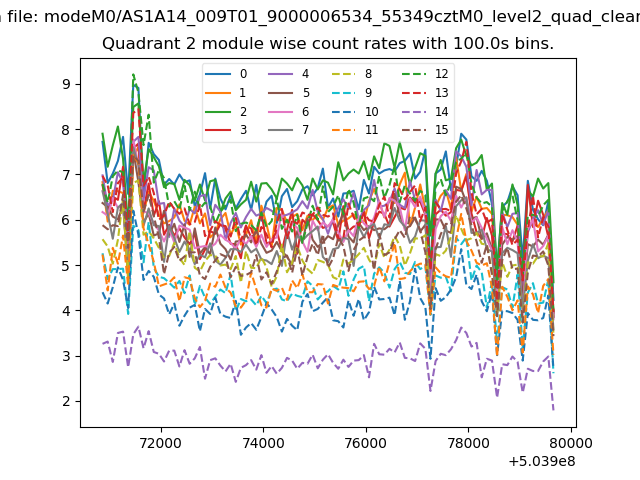
| Module-wise count rates for Quadrant B Data is divided into 100 sec bins |
 |
 |
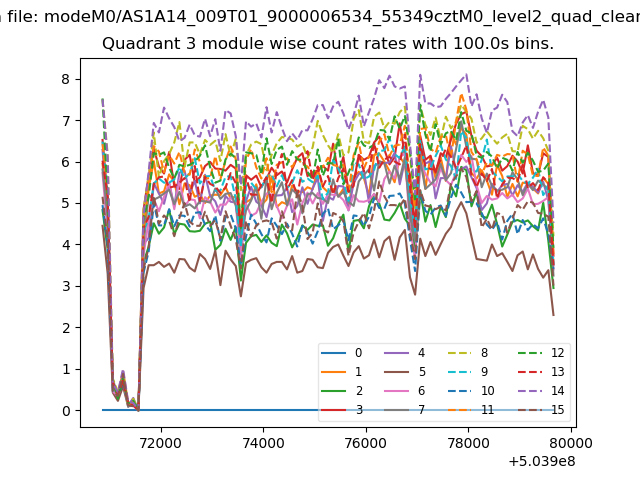
| Module-wise count rates for Quadrant C Data is divided into 100 sec bins |
 |
 |
| Module-wise count rates for Quadrant D Data is divided into 100 sec bins |
 |
 |
| Parameter | Plot |
|---|---|
| CZT HV Monitor | 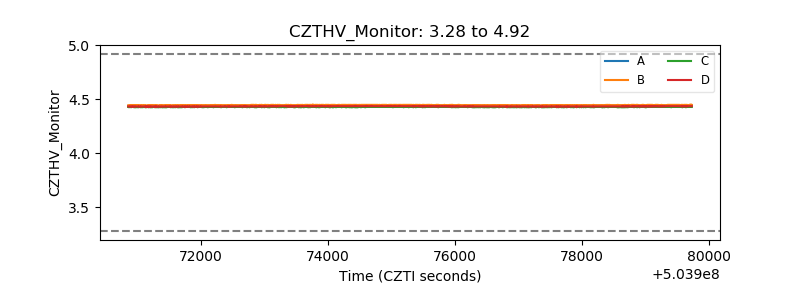 |
| D_VDD | 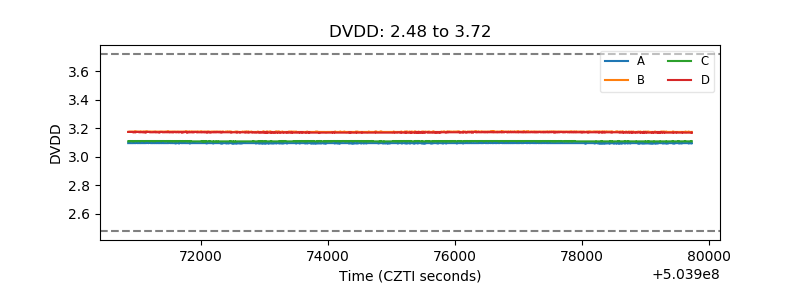 |
| Temperature 1 | 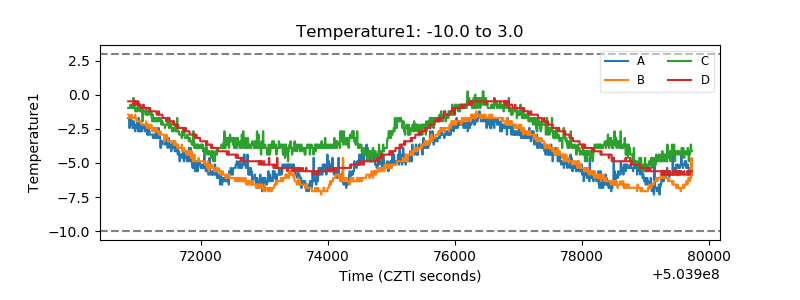 |
| Veto HV Monitor | 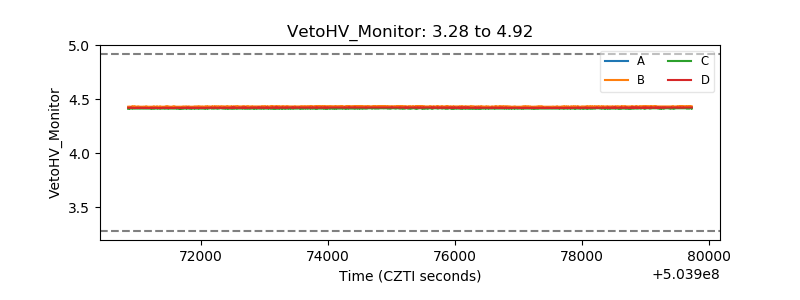 |
| Veto LLD | 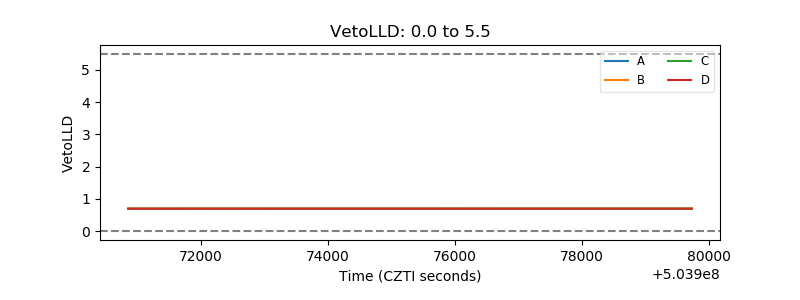 |
| Alpha Counter | 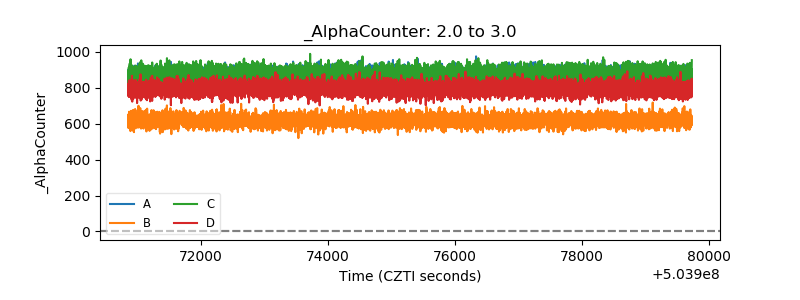 |
| _CPM_Rate | 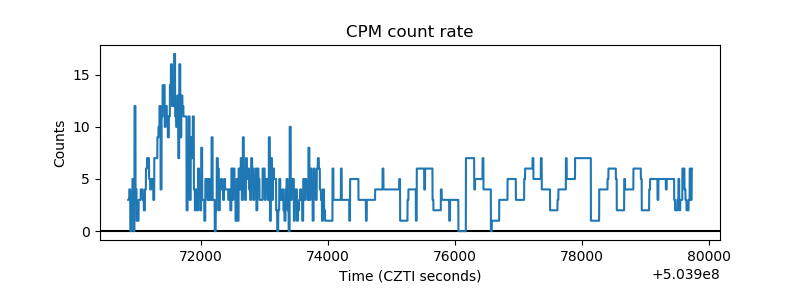 |
| CZT Counter | 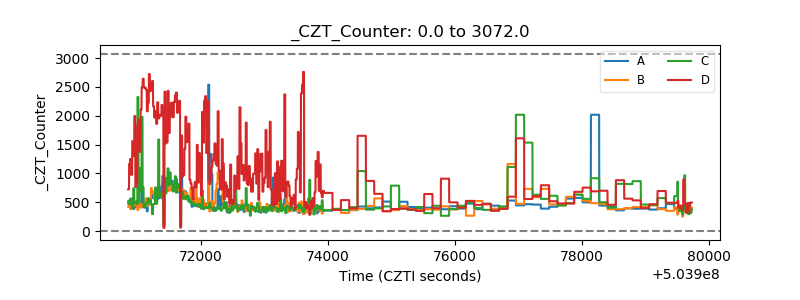 |
| +2.5 Volts monitor |  |
| +5 Volts monitor |  |
| _ROLL_ROT | 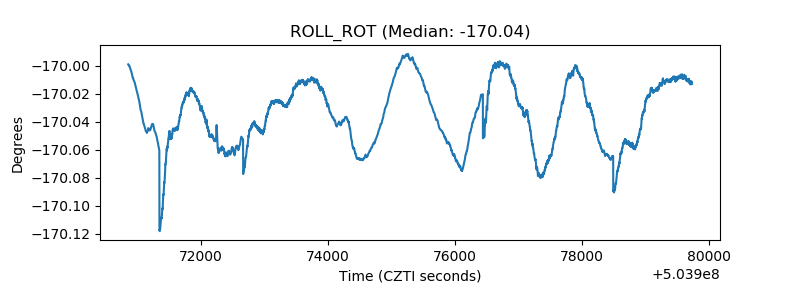 |
| _Roll_DEC | 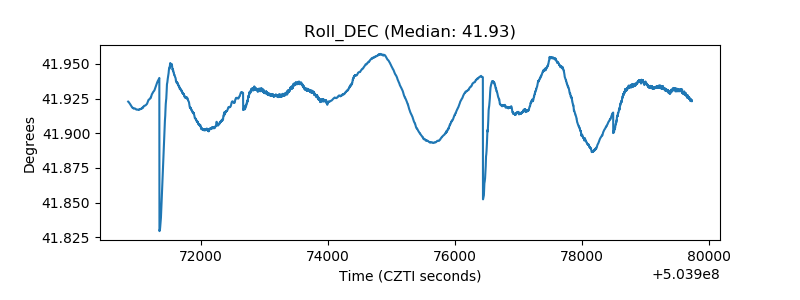 |
| _Roll_RA | 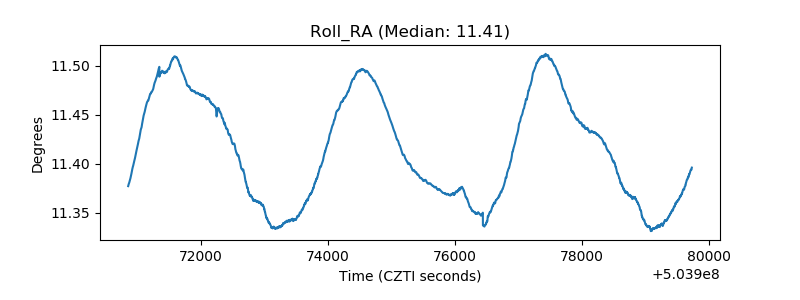 |
| Veto Counter | 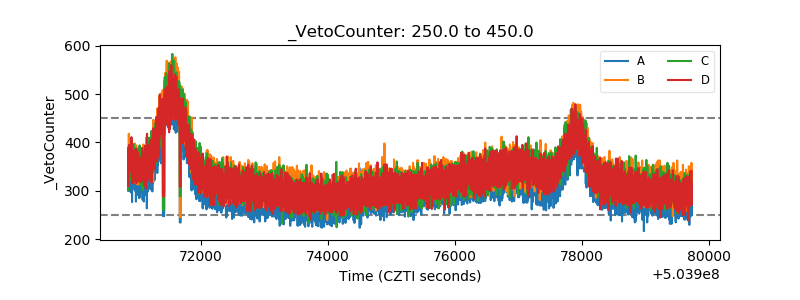 |